Abstract
Mucins are a key component of the surface mucus overlying airway epithelium. Given the different functions of the olfactory and respiratory epithelia, we hypothesized that mucins would be differentially expressed between these 2 areas. Secondarily, we evaluated for potential changes in mucin expression with radiation exposure, given the clinical observations of nasal dryness, altered mucus rheology, and smell loss in radiated patients. Immunofluorescence staining was performed to evaluate expression of mucins 1, 2, 5AC, and 5B in nasal respiratory and olfactory epithelia of control mice and 1 week after exposure to 8 Gy of radiation. Mucins 1, 5AC, and 5B exhibited differential expression patterns between olfactory and respiratory epithelium (RE) while mucin 2 showed no difference. In the olfactory epithelium (OE), mucin 1 was located in a lattice-like pattern around gaps corresponding to dendritic knobs of olfactory sensory neurons, whereas in RE it was intermittently expressed by surface goblet cells. Mucin 5AC was expressed by subepithelial glands in both epithelial types but to a higher degree in the OE. Mucin 5B was expressed by submucosal glands in OE and by surface epithelial cells in RE. At 1-week after exposure to single-dose 8 Gy of radiation, no qualitative effects were seen on mucin expression. Our findings demonstrate that murine OE and RE express mucins differently, and characteristic patterns of mucins 1, 5AC, and 5B can be used to define the underlying epithelium. Radiation (8 Gy) does not appear to affect mucin expression at 1 week.
Level of Evidence
N/A (Basic Science Research).
IACUC-approved study [Protocol 200065].
Keywords: MUC1, MUC5, mucin, olfaction, radiation, sinus
Introduction
Mucins are large glycoproteins (up to 1500 nm in length) found in the hydrophilic gel of mucus overlying the airway epithelium (Rose and Voynow 2006; Hattrup and Gendler 2008). Mucus serves as a protective barrier against desiccation and a wide range of foreign substances including chemical irritants, particulates, and bacterial, fungal, and viral pathogens. Both the remarkable size and extensive glycosylation of mucins contribute to their function in the airways where they protect from the continuous exposure to airborne bacterial and viral pathogens, toxins, and contaminants. In vivo, mucus contains more than 90% water, and mucins constitute up to 80% of the dry weight making them the major protein component of mucus (Lai et al. 2009).
Mucins are a key component of the mucus overlying the sinonasal epithelium. Of the 21 known mucin isoforms, mucins 1, 4, 5AC, and 8 have been found in human sinonasal epithelium and mucins 1, 5B, and 8 in sinonasal glands (Cone 2005, 2009; Martínez-Antón et al. 2006; Ali and Pearson 2007; Rubin 2010). Importantly, some mucins, including mucin 1, have a transmembrane spanning peptide that binds them to cell membrane while other mucins are entirely secreted (Hattrup and Gendler 2008). The point of contact between the shorter and lower viscosity, membrane-bound mucins and the higher viscosity secreted mucins forms a slippage plane and double-barrier against environmental insults (Cone 2005, 2009). Under stress, the secreted mucus layer may entirely shear away from the surface-bound mucus layer, which remains bound to the underlying cells (Cone 2009; Lai et al. 2009). This is significant because membrane-bound mucus may exist to protect extremely sensitive structures, such as olfactory sensory neurons (OSNs), that would be destroyed altogether if the entire mucus layer were lost.
While there is substantial understanding of mucin expression in the sinonasal respiratory epithelium (RE), there are few studies of their expression in the olfactory epithelium (OE) that makes up 3% of human and 50% of mouse nasal mucosal surface area (Harkema et al. 2011; Solbu and Holen 2012). Cuschieri and Bannister (1974) found differential histological staining in and around Bowman’s glands due to “sulfated mucosubstances” that may have a role in olfaction. Mozell and colleagues reported regional uptake differences in 3 different odorants with varying mucus solubility, suggesting that there may be some underlying differences in mucus character in various olfactory zones (Yang et al. 2007). The cilia of OSNs contain receptors that detect odorant molecules within the overlying mucus layer (Axel 2005; Buck 2005). Odorant binding to these receptors initiates a second messenger signal transduction process that results in generation of action potentials (Restrepo et al. 1996; Gold 1999) traveling to second-order neurons in the olfactory bulb. We hypothesize that expression of mucins in the mucus overlying the OE differs from their expression in the RE because of the inherently different functions of these epithelia. For instance, the abundant expression of mucins in the OE mucus may supplement the role that odorant binding proteins, also found in OE mucus, play in odor transport and chemical modification of chemosensory stimuli (Heydel et al. 2013; Block et al. 2015). In addition, OSNs by virtue of their anatomic location, are a vulnerable target for external environmental insults, such as exposure to toxins or infectious agents (Dando et al. 2014; van Riel et al. 2015). Since mucins help protect against infection (Rose and Voynow 2006; Hattrup and Gendler 2008), mucin expression in the OE may differ from expression in the RE.
Though radiation therapy has well-documented effects on mucous membranes and clinically apparent effects on mucus character, we do not know if radiation alters the composition of mucin production in a similar manner to other inflammatory disease states (e.g., chronic rhinosinusitis).
In this study, we address the primary question whether mucin expression differs between the respiratory and the OE and as a secondary objective, if radiation alters mucin expression.
Materials and methods
Animals
Nasal epithelia were obtained from 6, 2- to 4-month old sibling wild type (C57BL/6) mice, 2 OMP-ChR2-YFP (C57BL/6 background) mice (Li et al. 2014), and 1 FOXJ1-eGFP mouse (Ostrowski et al. 2003; Pathak et al. 2019). Mice were kept in the National Institutes of Health-approved animal facility of the University of Colorado Anschutz Medical Center. They were given food and water ad libitum, and were maintained in a 12 h light/dark cycle. All procedures were in compliance with the University of Colorado Anschutz Medical Campus Institutional Animal Care and Use Committee (IACUC).
Irradiation
To test effects of radiation on the OE mucin expression, 3 of the C57BL/6 wild type mice (2 female/1 male) were anesthetized with fresh Avertin (0.5 mg/mouse, i.p.), then shielded with lead so that only their heads and necks would receive irradiation. Eight Gy of X-ray was administered by an RS 2000 Biological Irradiator (Rad Source Technologies, Inc.) in accordance with published studies that showed this amount of radiation induces changes in olfactory neuroepithelium without being lethal to the animals under study (Cunha et al. 2012; Nguyen et al. 2012). Because Cunha et al. showed disruption in Bowman’s glands and the basal lamina 1-week post 8 Gy irradiation, we chose this as our survival time point. Three littermate control mice (2 female/1 male) were not irradiated, but were sacrificed at the same time point as the irradiated group.
Tissue preparation
Mice were anesthetized with fresh Avertin and perfused transcardially with 4% paraformaldehyde in 0.1 M phosphate buffer (PFA) as described by Nguyen et al. (2012). All nasal tissue, including septum, turbinates, and olfactory bulbs were resected en bloc and placed in 4% PFA. Tissue was cryoprotected with 20% sucrose in 0.1 phosphate buffer solution (PBS). Pairs of irradiated and control tissue were then transferred to cutting block molds, embedded in OCT and frozen to −20 °C. We placed control and irradiated mouse tissue in the same cutting block to ensure consistency between the 2 groups during the immunohistochemical staining component and image acquisition process. Coronal sections of 12 μm were obtained in an anterior to posterior fashion using a microtome (Leica Biosystems) and thaw-mounted to glass slides, which were then stored at −20 °C until staining.
Immunohistochemistry
We followed a previously described protocol (López et al. 2014) where samples were allowed to equilibrate to room temperature then washed 3 times in 0.1 M PBS. They were then exposed to a blocking solution (0.2 M phosphate buffer [PB], 0.05 M NaCl, 0.3% triton X-100, 3% BSA, 3% normal donkey serum [NDS]) for 2 h at room temperature. Primary antibodies (Table 1) diluted in blocking solution were allowed to incubate for 2 days at 4 °C. After incubation with the primary antibodies, slides were then washed in 0.1 M PBS for 30 min with 3 changes of solution. Secondary antibodies were diluted in blocking buffer (1:1000) and incubated at room temperature for 2 h then washed in PBS as mentioned earlier. In some instances, triton-X-100 was omitted from the blocking solution for all steps to determine if the presence of detergent has any effect on the observed mucin immunoreactivity (Supplementary Figure 2). Control slides were stained with secondary antibody, but no primary antibody, and no labeling was seen (Supplementary Figure 2). Samples were counterstained with DRAQ5 or DAPI for 10 min to show nuclei, washed as mentioned earlier, and mounted with Fluoromount G and coverslips.
Table 1.
List of antibodies and counterstains
| Antiserum | Company | Catalog number | Dilution | RRID |
|---|---|---|---|---|
| Chicken Polyclonal anti-GFP | Aves Lab | GFP-1020 | 1:2000 | AB_10000240 |
| Rabbit Polyclonal anti-Mucin 1 | Abcam | Ab15481 | 1:300 | AB_301891 |
| Rabbit Polyclonal anti-Mucin 5B (H-300) | Santa Cruz Biotechnology | Sc-20119 | 1:300 | AB_1842559 |
| Mouse Monoclonal anti-Mucin 2 (ccp58) | Santa Cruz Biotechnology | Sc-7314 | 1:300 | AB_627970 |
| Goat Polyclonal anti-CNGA2 | Santa Cruz Biotechnology | Sc-13700 | 1:300 | AB_2081833 |
| Donkey anti-Chicken 488 | Jackson Immuno Research | 703-546-155 | 1:1000 | AB_2340375 |
| Donkey anti-Rabbit 488 | Invitrogen | A21206 | 1:1000 | AB_141708 |
| Donkey anti-Rabbit 568 | Invitrogen | A10042 | 1:1000 | AB_2534017 |
| Donkey anti-Mouse 488 | Invitrogen | A21202 | 1:1000 | AB_141607 |
| Donkey anti-Mouse 568 | Invitrogen | A1137 | 1:1000 | AB_2758529 |
| Donkey anti-Goat 488 | Invitrogen | A11055 | 1:1000 | AB_142672 |
| Donkey anti-Goat 568 | Invitrogen | A1157 | 1:1000 | AB_2758603 |
| DRAQ5 | Abcam | ab108410 | 1:5000 | AB_108410 |
| DAPI | Invitrogen | 62248 | 1:10 000 | AB_2307445 |
Image acquisition and processing
Samples were viewed and images acquired with a Leica TCS SP8 laser scanning confocal microscope with ×10 and ×20 air objectives and a ×63 oil immersion objective. Leica Application Suite (LAS) AF was used to acquire z-stack images consisting of 12–20 1-μm thick planes and saved as LIF files. ImageJ (Rasband 1994; Abramoff et al. 2004; Schneider et al. 2012) with the Fiji (Schindelin et al. 2012) graphical user interface was used to generate maximum intensity projections from the confocal z-stacks. Staining patterns of each mucin with respect to OE and RE were visually observed in a blinded fashion for control and irradiated mouse tissue. Only unenhanced images from slides that showed both OE and RE within the same sample were used for quantitative analysis, which was performed by creating linear regions of interest (ROI) that isolated OE or RE as determined by cyclic nucleotide-gated A2 (CNGA2) staining. The plot profile analysis tool was used to extract single pixel fluorescence intensity values ranging from 0 to 255 along the lengths of each ROI. A two-tailed paired t-test was employed when comparing immunofluorescence intensity values from single images containing both OE and RE from the same animal (n = 3 mice).
Antibody validation
Cell culture and immunocytochemistry
TSA-201 cells cultured at ~60% confluency were transfected with 1 µg/mL human MUC1 in pCMV3-GFPSpark (Sino Biological; MG50877ACG) using Lipofectamine 3000 (Thermo Fisher) (Supplementary Figure 1). 48 h post-transfection, cells were washed with PBS and fixed with 4% PFA for 30 min at room temperature. After fixation, cells were washed with PBS and incubated in blocking buffer (0.3% Triton-X100, 1% BSA, and 2% NDS in 0.1 M PB [29 mM NaH2PO4, 75 mM Na2HPO4, pH 7.2–7.4]) for 1 h at room temperature. MUC1 primary antisera was diluted in blocking buffer and applied overnight at 4 °C. Secondary antisera were applied for 2 h at room temperature. Negative controls consisted of untransfected cells processed as mentioned earlier and transfected cells processed with omission of the primary antisera. After washing, cells were counterstained with DAPI (0.5 µg/mL) and imaged using Ocular software (QImaging) controlling a CCD camera (QImaging Retiga R3) connected to an Olympus IX71 inverted microscope with ×40 air objective (NA 0.6). Negative control images were collected using the same acquisition settings.
Image analysis
Raw images were imported to ImageJ (NIH) where regions of interest were drawn around cells as identified with DAPI and/or a brightfield image. Background-subtracted fluorescence intensity for both GFP and Alexa-568 signals was measured and visualized on a scatterplot using SigmaPlot (Systat Studios).
Results
Mucins are differentially expressed in mouse OE and RE
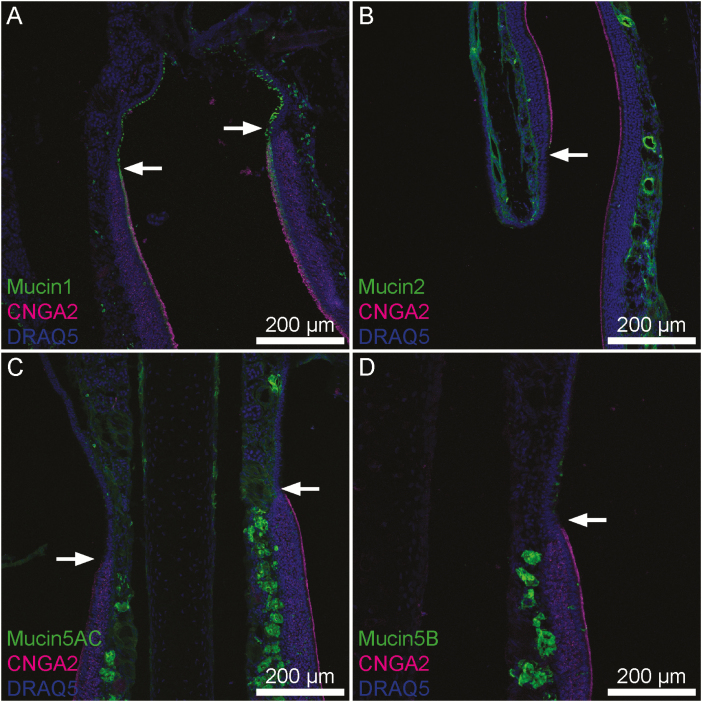
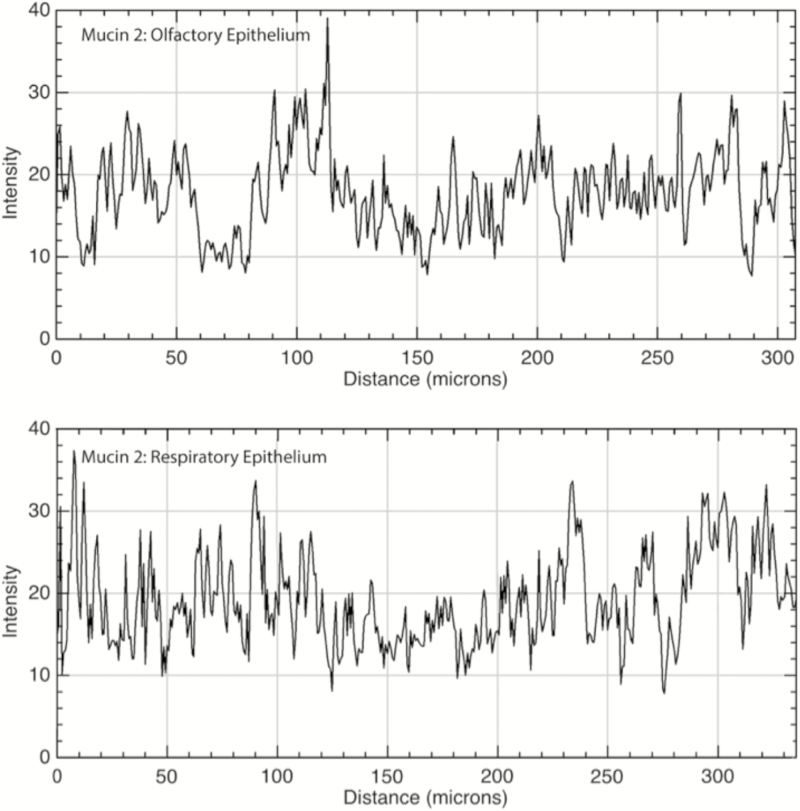
OE was identified and distinguished from RE by the presence of CNGA2, an ion channel subunit unique to OE (Liman and Buck 1994). Of the 4 mucins we studied, only mucin 2 showed a similar staining pattern in both OE and RE tissue (Figure 1). Mucin 2 is a secreted mucin, and we found it clustered in mucus overlying the luminal areas of samples where the secreted mucus layer survived the sample preparation process. We also observed mucin 2 diffusely expressed in the connective tissue of the lamina propria underlying both OE and RE. Quantitatively, there was a significant difference in the immunofluorescence intensity of mucin 2 between the OE and RE lamina propria (P < 0.01; Figure 2); however, this difference was small and may not be functionally significant. Unlike the other secreted mucins (mucins 5AC and 5B), mucin 2 was not seen in glandular structures.
Figure 1.
Transitions between OE and RE in mouse nasal tissue. CNGA2 (magenta), a marker specific to neurocilia of OSNs indicates portions of OE. Visible portions of OE and RE are broadly representative of these tissues. (A) Mucin 1 (green) is present uniformly across a continuous layer of sustentacular cells within the OE whereas in the RE scattered individual surface epithelial cells express it. (B) Mucin 2 (green) is expressed uniformly within lamina propria connective tissue below both OE and RE. (C) Mucin 5AC is expressed by submucosal glands and to a lesser degree within lamina propria connective tissue below both OE and RE. The density of positively staining glands was much higher in the OE. (D) Mucin 5B was expressed intensely by submucosal Bowman’s glands within the OE, but within the RE goblet cells expressed mucin 5B. Arrows denote the transition from RE to OE. Also, this transition is noticeable as the thickness of the epithelial layer changes from thick to thin from OE to RE.
Figure 2.
Immunofluorescence quantitation of mucin 2 in the lamina propria underlying OE and RE. Mucin 2 was diffusely present within the lamina propria of both the olfactory (top panel) and respiratory (bottom panel) epithelia. X axis is the distance moving along a linear region of interest within the lamina propria, parallel to the epithelial layer; Y axis is intensity of immunofluorescence with possible values ranging from 0 to 255. Mean OE versus RE immunofluorescence was 19.0 versus 17.7, respectively (P < 0.01).
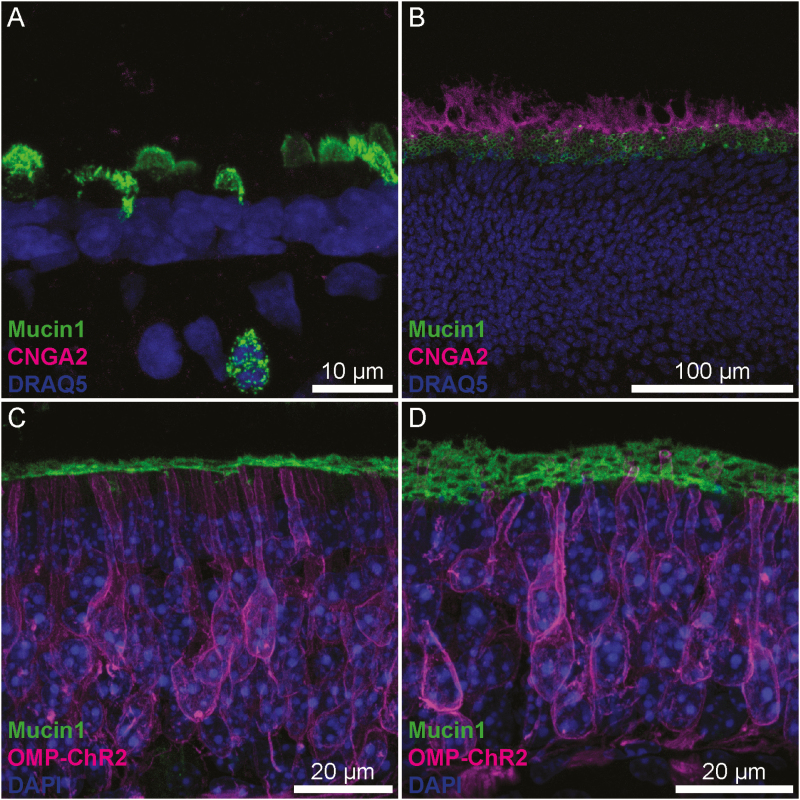
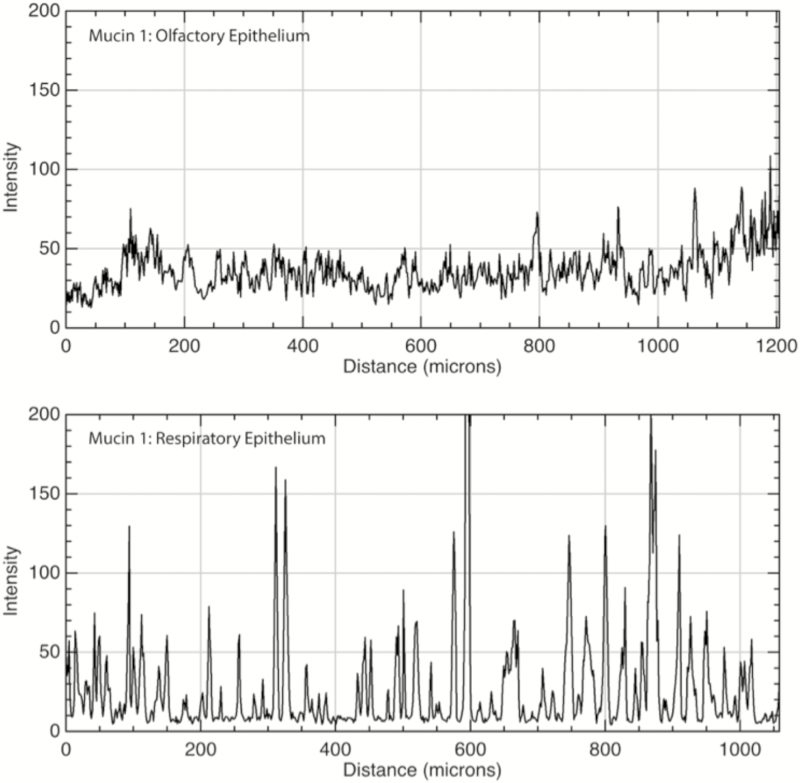
We observed differential expression of mucins 1, 5AC, and 5B between OE and RE. Mucin 1 is membrane-bound, and within the RE, mucin 1 demonstrates a patchy pattern of expression that upon higher magnification was limited to scattered individual cells located apically within the epithelium (Figure 3A). In contrast, it was observed in a lattice-like pattern at the apical-most end of the OSN dendrites (Figure 3B–D) in the OE. The “spaces” in the lattice where mucin 1 is absent were measured at 1.5 (SD = 0.21) microns in diameter, which corresponds to the size of dendrites or dendritic knobs from which olfactory cilia project (Ma et al. 2003; Kwon et al. 2009; Oberland et al. 2015). Within the OE, mucin 1 shows a consistent, linear, 1.1 (SD = 0.11) micron thick layer likely residing between the apical dendrite and the cilia. Immunofluorescence intensity plots demonstrated a relatively consistent value across the OE (mean = 36, SD = 13) whereas the RE showed high intensity peaks that coincided with individual cells separated by troughs of minimal immunofluorescence (Figure 4).
Figure 3.
Mucin 1 differential staining between OE and RE. (A) Mucin 1 is present in the apical layer of RE and expressed by scattered individual cells. (B and C) In the OE, mucin 1 lies at the base of the neurocilia. When viewed in oblique section (B), mucin 1 exhibits a lattice-like staining pattern indicative of perforations by OSN dendritic knobs suggesting it may be produced and secreted into this layer by the sustentacular cells. (C and D) OMP-ChR2-YFP knock-in mice were used to examine the relationship between OSNs (magenta) and mucin 1 (green). Mucin 1 is found in a layer just above the sustentacular cells, at the level of the OSN dendritic knob, as olfactory dendrites coursing through the OE are seen. In orthogonal section, this layer appears continuous, but in an oblique section (D) the lattice pattern of mucin 1 is clearly observed.
Figure 4.
Immunofluorescence quantitation of mucin 1 in OE and RE. Top: Mucin 1 was diffusely present along the apical surface of olfactory epithelial cells. Bottom: In the RE, it was present on the apical surfaces of individual goblet cells, resulting in a series of immunofluorescence peaks. X axis is distance along a linear region of interest consisting of the apical surface of the epithelium; Y axis is intensity of immunofluorescence with possible values ranging from 0 to 255. Values indicate consistent moderate expression of the membrane-bound protein throughout the OE, versus intermittent areas of high expression in RE consistent with goblet cell colocalization.
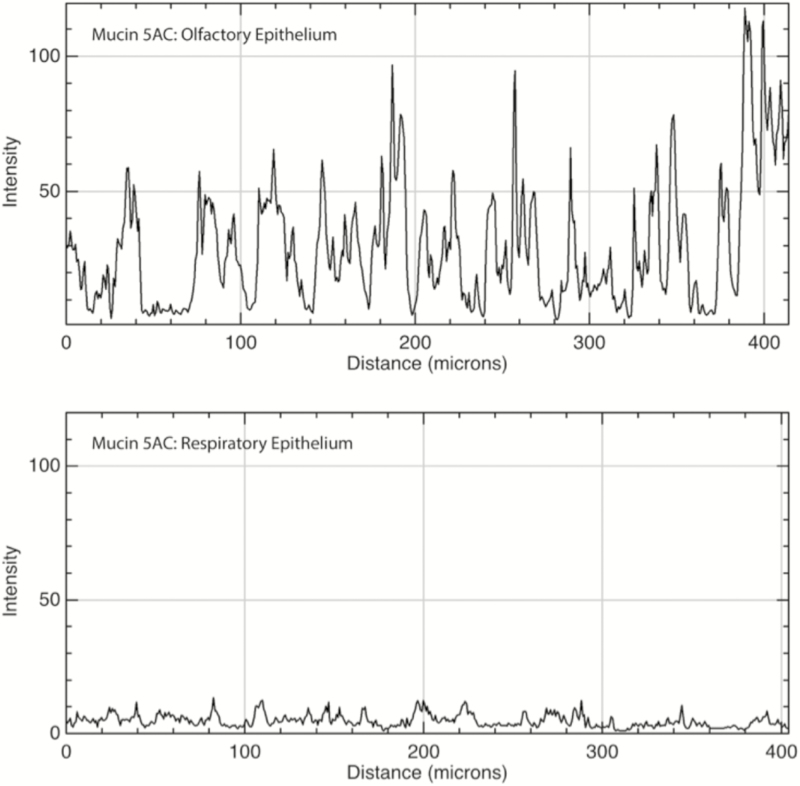
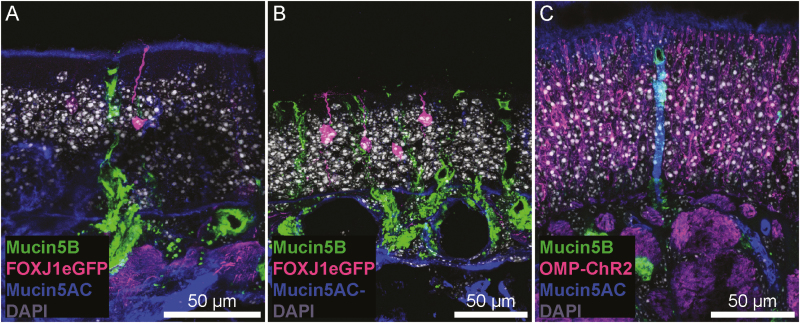
Mucin 5AC is found in the mucus layer overlying OSN cilia and portions of the RE where it survived the sample preparation process, consistent with its known action as a secreted mucin. Interestingly, we observed no changes in the presence of secreted mucins when detergents were omitted from our immunofluorescence protocol (Supplementary Figure 2). Connective tissue within the lamina propria stained diffusely positive for mucin 5AC at a low level (mean = 5.2, SD = 3.1), though some of this signal is attributable to off-target staining of anti-mouse secondary antisera (Supplementary Figure 2). Some, but not all, subepithelial glands with ducts (Bowman’s glands) from the lamina propria to the epithelial surface stained positive for mucin 5AC at a higher level than the surrounding connective tissue (mean = 35.5, SD = 21.5), and the frequency of these glands was substantially greater in the OE versus RE of our samples (Figures 1, 5, and 6C). This is consistent with previous research demonstrating that Bowman’s glands secrete mucin 5AC in rodents (Solbu and Holen 2012). We also observed mucin 5AC immunoreactivity in a layer that covered olfactory cilia (Figure 6A) but this layer was not present across the entire epithelium (Figure 6B) and could have been lost during sample preparation.
Figure 5.
Immunofluorescence quantitation of mucin 5AC in OE and RE. Top: Mucin 5AC was present primarily in submucosal glands within the OE and to a much lesser degree within the surrounding lamina propria connective tissue. Bottom: In the RE, there was a low level of immunofluorescence within the connective tissue and very few glands expressing the protein (none are present in the sample mentioned earlier). X axis is distance along a linear region of interest consisting of the submucosa, parallel to the epithelium; Y axis is intensity of immunofluorescence with possible values ranging from 0 to 255.
Figure 6.
Mucin 5AC and 5B staining in OE. (A and B) FOXJ1-eGFP mice were used to visualize a small subset of OSNs. The cilia and dendritic knob of an OSN (magenta) are observed within a layer of mucin 5AC immunoreactivity (blue; A), though this layer was not consistent across the entire OE (B). Additionally, mucin 5B+ (green), AC—Bowman’s glands are present in the OE. (C) Some Bowman’s glands were immunoreactive for mucin 5AC, surrounded by OMP-ChR2+ OSNs.
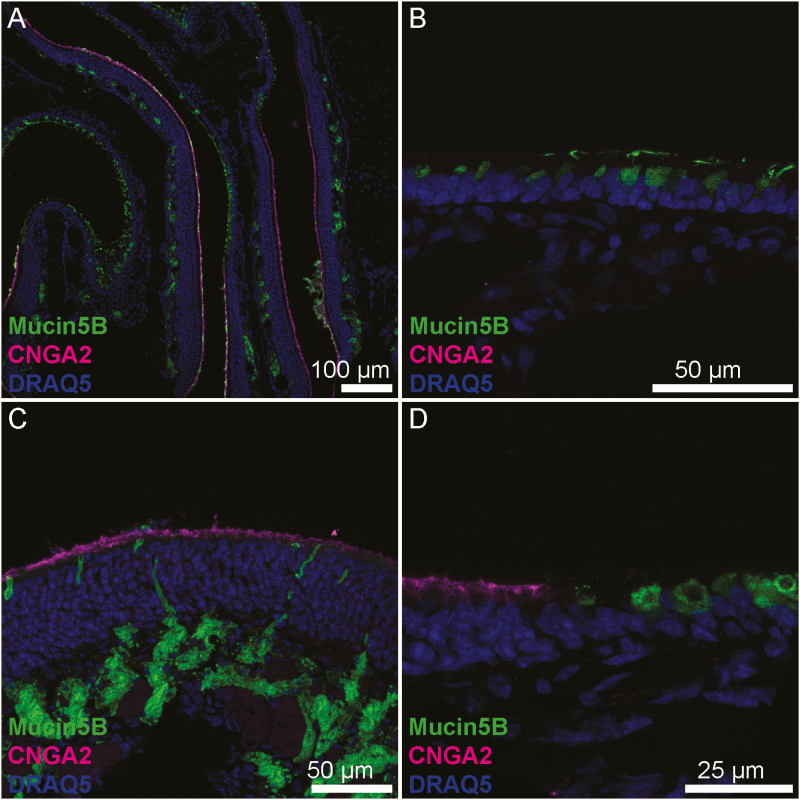
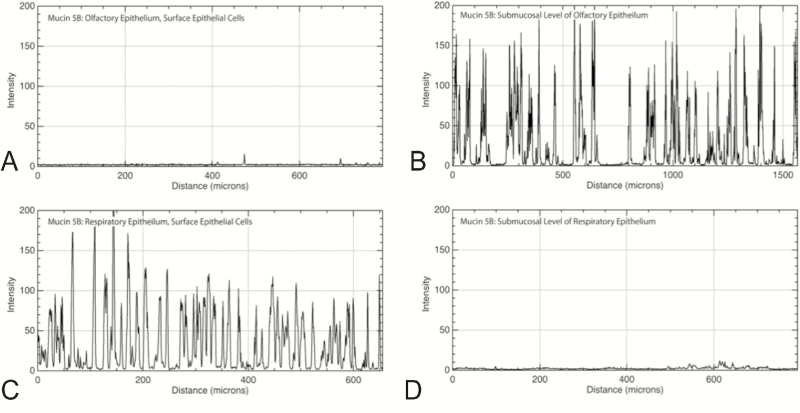
Mucin 5B is also a secreted protein and was present within clusters of mucus on the luminal surface of both OE and RE. In contrast to mucin 5AC, mucin 5B did not appear within lamina propria connective tissue of the RE and labeled far more epithelial glands than mucin 5AC. Within the OE, mucin 5B-producing glands existed submucosally with ducts opening to the epithelial surface, and these glands appeared to have an acinar structure with a central lumen surrounded by a ring of secretory cells consistent with the structure of Bowman’s glands. In contrast, epithelial rather than submucosal cells expressed mucin 5B in the RE. These single cells were spaced apart, usually within 15 microns of each other, and at low power magnification had a granular staining pattern within the epithelium (Figures 7 and 8). Because mucin 5B expression was subepithelial in the OE and superficial in the RE, this pattern easily differentiated OE from RE.
Figure 7.
Mucin 5B differential staining between OE and RE. (A) In the OE, mucin 5B is located in submucosal glands while in the RE it is secreted by surface goblet cells. (B) Magnification of RE showing goblet cells secreting directly to the epithelial surface. Note the vesicles filled with mucin oriented to the apical side while the nuclei are located basolaterally. (C) Magnification of OE showing submucosal glands with ducts to the luminal surface. (D) Transition between OE (left) and RE (right).
Figure 8.
Immunofluorescence quantitation of mucin 5B at the epithelial and submucosal level of OE and RE. Mucin 5B exhibited almost no immunofluorescence in the epithelial layer (A), but was present primarily in submucosal glands of the OE as evidenced by the strong peaks of immunofluorescence (B). Individual goblet cells throughout the surface of the RE expressed high levels of mucin 5B, resulting in immunofluorescence peaks (C). There was virtually no mucin 5B in the submucosal level of RE (D). X axis is distance along a linear region of interest; Y axis is intensity of immunofluorescence with possible values ranging from 0 to 255.
Radiation did not affect mucin expression at 1 week
We analyzed mucin expression 1 week after mice received 8 Gy of radiation to the anterior cranium in a single dose, in the same fashion. Three radiated mice were compared with 3 sex-matched littermate controls. Comparing control to irradiated tissues using similar qualitative and quantitative testing (unpaired t-test) as mentioned earlier, we did not find any consistent changes in mucin expression between the irradiated and nonirradiated samples (data not shown).
Discussion
Comparison with human nasal mucosa
There is evidence that murine nasal mucosa approximates that of humans (Harkema et al. 2011), making it a good model for study of mucins in the OE. The gel-forming secreted mucins 2, 5AC, and 5B we studied as well as mucin 6 are encoded by the same gene cluster located on chromosome 11p15.5 in humans and chromosome 7 band F5 in mice, and each of these mucins has been shown to be highly conserved across species (Pigny et al. 1996; Chen et al. 2001; Desseyn and Laine 2003; Escande et al. 2004; Linden et al. 2008). Patterns of expression within RE of the larynx, trachea, and lungs also appear similar between mice and humans though to date, no study has analyzed patterns of mucin isoform expression in mouse nasal mucosa. Multiple studies have analyzed nasal mucin isoform expression in humans and have found that mucin 5AC is weakly expressed by surface goblet cells of the nasal epithelium in healthy samples while mucin 5B is produced by both goblet cells and submucosal glands (Ali et al. 2002, 2005; Groneberg et al. 2003; Kim et al. 2004; Ding and Zheng 2007; Fahy and Dickey 2010). In our mouse study, we found mucin 5AC ubiquitously in submucosal connective tissue as well as submucosal glands that were clustered more closely in OE than RE. We did not observe mucin 5AC production within the epithelium in structures consistent with goblet cells. In contrast, mucin 5B was produced by cells morphologically resembling goblet cells and submucosal glands consistent with human studies with one important caveat. We observed a differential expression of mucin 5B based on the overlying mucosal tissue type. In RE, mucin 5B was confined to goblet cells while in OE only submucosal glands produced mucin 5B. The acinar structure of the glands expressing mucin 5B is consistent with Bowman’s glands (Nomura et al. 2004; Solbu and Holen 2012). The difference in surface versus submucosal expression was consistent and could be used to differentiate these 2 tissue types. Airway secretion of mucin 5B has been shown to be essential to murine life (Fahy and Dickey 2010), and this may explain why mucin 5B was produced across both epithelial types. Due to the density of neurons competing for access to the luminal surface of OE, mucin 5B production may be forced to go “underground” to the submucosa where there is room enough to accommodate glands. Without olfactory neurons occupying the epithelial surface in the RE, there is room for production of this essential airway mucin within the luminal cells.
Mucin 1 expression is observed in the dendritic layer under the cilia of OSNs
We found that mucin 1 appears to tightly surround the dendrites or dendritic knobs of olfactory neurons (Figure 3). Its uniformity suggests secretion by sustentacular cells; indeed, in secondary analysis of existing single cell transcriptome data a population of sustentacular cells express Muc1 transcript (Tan et al. 2015). Mucin 1 has been postulated to defend against pathogens and toxins via a range of mechanisms, which is significant given access to the intracranial compartment presented by olfactory neurons (McAuley et al. 2007; Guang et al. 2010; Nguyen et al. 2011; Dando et al. 2014). Mucin 1 contains a large protein core with dense sugar chains that interfere with pathogen and toxin binding by denying them access to receptors on underlying cells, blocking them from penetrating intercellular spaces, and disrupting pathogen adhesion via a strong negative charge (Hattrup and Gendler 2008), Additionally, mucin 1 mimics some cellular pathogen binding sites, and though mucin 1 is tethered to the cell membrane, it has the ability to slough off and shed the bound pathogens (McGuckin et al. 2007; Linden et al. 2008; Lindén et al. 2009; Guang et al. 2010). The intracellular portion of mucin 1 affects cellular survival in response to pathogens by downregulating the immune system to avoid excessive inflammation that would degrade the integrity of the mucosal barrier (Groneberg et al. 2003; Hattrup and Gendler 2008; Kim and Lillehoj 2008; Ueno et al. 2008; McAuley et al. 2007; Kyo et al. 2012). Mucin 1 has also been shown to counteract genotoxins that trigger apoptosis, which is useful in responding to some bacterial attacks, but may be detrimental in others. For instance, mucin 1 is considered an oncoprotein, in part due to its ability to promote cancer cell survival and resistance to chemotherapies by counteracting signals that would trigger apoptosis in healthy cells (Linden et al. 2008; Kufe 2009; McAuley et al. 2007).
In our olfactory epithelial samples, the OSN cilia projected above the mucin 1 layer by 2.4 micrometers (SD = 0.3 µm). Although we did not co-stain for mucin 1 and 5AC or 5B, comparison between images indicates that the mucin 1 layer in the OE is beneath the layer of mucus containing mucins 5AC and 5B resting on top of the olfactory cilia. This supports the model of a slippage plane formed by membrane-bound and secreted mucin layers. This is significant because membrane-bound mucus may exist to protect extremely sensitive structures, such as OSNs, that could be susceptible to damage if the entire mucus layer were lost. Mucins give the mucus layer its unique physical properties of thixotropy which allows mucus to slide smoothly when exposed to high shear stress like coughing or sneezing but then become less mobile and gel-like under low stress (Lai et al. 2009). This may be another method of conferring protection to the underlying sensory neurons by diffusing high velocity stress within the mucus layer rather than transferring it to the underlying epithelium, such as occurs in blunt head trauma.
Our findings of mucin 1 expression in the OE, and the associated slippage plane of overlying mucins, suggest that these mucins may protect the delicate OSNs, and indicates a rationale for continued research.
Effects of radiation
We did not observe any effects of radiation exposure on mucin expression at the 1-week time point. We selected a single 8 Gy dose because this has been shown to alter cellular function within mouse olfactory and taste mucosa without resulting in excess mortality (Cunha et al. 2012; Nguyen et al. 2012). At 1-week post irradiation, Cunha et al. reported changes in mouse nasal mucosal morphology as well as olfactory performance as measured by behavioral testing. Specifically, they found that 8 Gy induced a decrease in OSN proliferation but an increase in sustentacular cell proliferation. CD15, a marker for Bowman’s glands, appeared between OSNs after irradiation. We observed that in portions of one irradiated specimen, mucin 2 was highly expressed within the OE epithelial layer in a strand-like fashion suggesting it interdigitated between cells while in the other irradiated and control mice mucin 2 was confined to the lamina propria (figure not shown). This may parallel Cunha’s finding of increased CD15 between OSNs after radiation; however, our observation was not sufficiently consistent to form any conclusions. Cunha also reported a disruption in the basal lamina at the 5-week time point compared with 24 h postirradiation, though no intermediate time points were reported. We did not observe any changes in the basal lamina at 1 week. Given that other studies have shown alterations in mucin production in response to sinonasal irritation (Ali and Pearson 2007; Fahy and Dickey 2010), it is possible that 1-week post-treatment is too soon to see any detrimental effects on mucin production. Based on our results, it appears that 1-week was either too soon for radiation to effect mucin expression or that mucins may not substantially affected by radiation.
Limitations and directions for further research
We designed our radiation model with the intent that it would help us better understand the pathophysiology that underlies radiation damage to mucosal tissues observed in humans. Our single dose model was similar to that employed in other animal studies, but head and neck cancer patients undergo fractionated radiation rather than single exposures. Currently, available literature does not shed any light on the comparison of single dose versus fractionated radiation effects on airway mucosa. We used a sample size of 6 mice in the radiation experiment, and results from control mice were consistent across samples and similar to data from healthy human tissue studies, a reassuring finding. Only one irradiated sample demonstrated an inflammatory response with mucin 2 expressed within the epithelial layer. It is possible that the experiment was underpowered, or alternatively, that delayed post-treatment time points may show differences.
This study demonstrated differential mucin expression between the OE and RE, and mucin 1 in particular seems to have a unique distribution suggestive of a special role within the OE. Further research will test mucin 1’s protective effects on susceptibility to pathogen infection (Nguyen et al. 2011), and its ability to protect OSNs from physical injury.
Conclusion
OE is unique from RE with regard to expression of mucins 1, 5AC, and 5B. The physical relationship of mucin 1 with OSNs and its known role in mucosal defense suggests it may serve to protect OSNs from injury, and by extension, the central nervous system from environmental insult. OE expresses more mucin 5AC than does RE, whereas mucin 5B is ubiquitous across both epithelial types, and this pattern consistently distinguishes OE from RE. Lastly, radiation did not appear to affect mucin expression at the 1-week time point.
Supplementary Material
Funding
This work was supported by the National Institute On Deafness And Other Communication Disorders (NIDCD) of the National Institutes of Health (K23-DC014747 to V.R.R., R01-DC014253 to D.R.), and a training grant to the Department of Otolaryngology at the University of Colorado (T32-DC012280). The content is solely the responsibility of the authors and does not necessarily represent the official views of the National Institutes of Health.
Authors Contributions
C.K. conceived, organized, and executed the study, performed the analysis, and contributed to the article. E.A.G. conceived and executed the study, and contributed to the article. D.R. conceived and executed the study, supervised the experiments, reviewed the analysis, and contributed to the article. E.S. performed experiments and reviewed the article. T.V. performed experiments and reviewed the article. E.D.L. performed experiments and reviewed the article. V.R.R. conceived and executed the study, reviewed the analysis, and contributed to the article. All authors discussed the results and implications and contributed to the final article.
Conflicts of interest
None declared.
References
- Abramoff M, Magalhaes P, Ram S. 2004. Image processing with ImageJ. Biophotonics Int. 11(7):36–42. [Google Scholar]
- Ali MS, Pearson JP. 2007. Upper airway mucin gene expression: a review. Laryngoscope. 117:932–938. [DOI] [PubMed] [Google Scholar]
- Ali MS, Wilson JA, Bennett M, Pearson JP. 2005. Mucin gene expression in nasal polyps. Acta Otolaryngol. 125:618–624. [DOI] [PubMed] [Google Scholar]
- Ali MS, Wilson JA, Pearson JP. 2002. Mixed nasal mucus as a model for sinus mucin gene expression studies. Laryngoscope. 112:326–331. [DOI] [PubMed] [Google Scholar]
- Axel R. 2005. Scents and sensibility: a molecular logic of olfactory perception (Nobel lecture). Angew Chem Int Ed Engl. 44(38):6110–6127. [DOI] [PubMed] [Google Scholar]
- Block E, Jang S, Matsunami H, Sekharan S, Dethier B, Ertem MZ, Gundala S, Pan Y, Li S, Li Z, et al. 2015. Implausibility of the vibrational theory of olfaction. Proc Natl Acad Sci U S A. 112:E2766–E2774. [DOI] [PMC free article] [PubMed] [Google Scholar]
- Buck LB. 2005. Unraveling the sense of smell (Nobel lecture). Angew Chem Int Ed Engl. 44(38):6128–6140. [DOI] [PubMed] [Google Scholar]
- Chen Y, Zhao YH, Wu R. 2001. In silico cloning of mouse Muc5b gene and upregulation of its expression in mouse asthma model. Am J Respir Crit Care Med. 164:1059–1066. [DOI] [PubMed] [Google Scholar]
- Cone RA. 2005. Mucus. In: Mestecky J, Lamm ME, Ogra PL, et al. , editors. Mucosal immunology. Waltham, MA: Academic Press; p. 49–71. [Google Scholar]
- Cone RA. 2009. Barrier properties of mucus. Adv Drug Deliv Rev. 61:75–85. [DOI] [PubMed] [Google Scholar]
- Cunha C, Hort Y, Shine J, Doyle KL. 2012. Morphological and behavioural changes occur following the X-ray irradiation of the adult mouse olfactory neuroepithelium. BMC Neurosci. 13:134. [DOI] [PMC free article] [PubMed] [Google Scholar]
- Cuschieri A, Bannister LH. 1974. Some histochemical observations on the mucosubstances of the nasal glands of the mouse. Histochem J. 6:543–558. [DOI] [PubMed] [Google Scholar]
- Dando SJ, Mackay-Sim A, Norton R, Currie BJ, St John JA, Ekberg JA, Batzloff M, Ulett GC, Beacham IR. 2014. Pathogens penetrating the central nervous system: infection pathways and the cellular and molecular mechanisms of invasion. Clin Microbiol Rev. 27:691–726. [DOI] [PMC free article] [PubMed] [Google Scholar]
- Desseyn JL, Laine A. 2003. Characterization of mouse muc6 and evidence of conservation of the gel-forming mucin gene cluster between human and mouse. Genomics. 81:433–436. [DOI] [PubMed] [Google Scholar]
- Ding GQ, Zheng CQ. 2007. The expression of MUC5AC and MUC5B mucin genes in the mucosa of chronic rhinosinusitis and nasal polyposis. Am J Rhinol. 21:359–366. [DOI] [PubMed] [Google Scholar]
- Escande F, Porchet N, Bernigaud A, Petitprez D, Aubert JP, Buisine MP. 2004. The mouse secreted gel-forming mucin gene cluster. Biochim Biophys Acta. 1676:240–250. [DOI] [PubMed] [Google Scholar]
- Fahy JV, Dickey BF. 2010. Airway mucus function and dysfunction. N Engl J Med. 363:2233–2247. [DOI] [PMC free article] [PubMed] [Google Scholar]
- Gold GH. 1999. Controversial issues in vertebrate olfactory transduction. Annu Rev Physiol. 61:857–871. [DOI] [PubMed] [Google Scholar]
- Groneberg DA, Peiser C, Dinh QT, Matthias J, Eynott PR, Heppt W, Carlstedt I, Witt C, Fischer A, Chung KF. 2003. Distribution of respiratory mucin proteins in human nasal mucosa. Laryngoscope. 113:520–524. [DOI] [PubMed] [Google Scholar]
- Guang W, Ding H, Czinn SJ, Kim KC, Blanchard TG, Lillehoj EP. 2010. Muc1 cell surface mucin attenuates epithelial inflammation in response to a common mucosal pathogen. J Biol Chem. 285:20547–20557. [DOI] [PMC free article] [PubMed] [Google Scholar]
- Harkema JR, Carey SA, Wagner JG, Dintzis SM, Liggitt D. 2011. Nose, sinus, larynx, and pharynx. In: Treuting PM, Dintzis SM, editors. Comparative anatomy and histology: a mouse and human atlas. Waltham, MA: Academic Press; p. 71–94. [Google Scholar]
- Hattrup CL, Gendler SJ. 2008. Structure and function of the cell surface (tethered) mucins. Annu Rev Physiol. 70:431–457. [DOI] [PubMed] [Google Scholar]
- Heydel JM, Coelho A, Thiebaud N, Legendre A, Le Bon AM, Faure P, Neiers F, Artur Y, Golebiowski J, Briand L. 2013. Odorant-binding proteins and xenobiotic metabolizing enzymes: implications in olfactory perireceptor events. Anat Rec (Hoboken). 296:1333–1345. [DOI] [PubMed] [Google Scholar]
- Kim DH, Chu HS, Lee JY, Hwang SJ, Lee SH, Lee HM. 2004. Up-regulation of MUC5AC and MUC5B mucin genes in chronic rhinosinusitis. Arch Otolaryngol Head Neck Surg. 130:747–752. [DOI] [PubMed] [Google Scholar]
- Kim KC, Lillehoj EP. 2008. MUC1 mucin: a peacemaker in the lung. Am J Respir Cell Mol Biol. 39:644–647. [DOI] [PMC free article] [PubMed] [Google Scholar]
- Kufe DW. 2009. Mucins in cancer: function, prognosis and therapy. Nat Rev Cancer. 9:874–885. [DOI] [PMC free article] [PubMed] [Google Scholar]
- Kwon HJ, Koo JH, Zufall F, Leinders-Zufall T, Margolis FL. 2009. Ca extrusion by NCX is compromised in olfactory sensory neurons of OMP mice. PLoS One. 4:e4260. [DOI] [PMC free article] [PubMed] [Google Scholar]
- Kyo Y, Kato K, Park YS, Gajghate S, Gajhate S, Umehara T, Lillehoj EP, Suzaki H, Kim KC. 2012. Antiinflammatory role of MUC1 mucin during infection with nontypeable haemophilus influenzae. Am J Respir Cell Mol Biol. 46:149–156. [DOI] [PMC free article] [PubMed] [Google Scholar]
- Lai SK, Wang YY, Wirtz D, Hanes J. 2009. Micro- and macrorheology of mucus. Adv Drug Deliv Rev. 61:86–100. [DOI] [PMC free article] [PubMed] [Google Scholar]
- Li A, Gire DH, Bozza T, Restrepo D. 2014. Precise detection of direct glomerular input duration by the olfactory bulb. J Neurosci. 34:16058–16064. [DOI] [PMC free article] [PubMed] [Google Scholar]
- Liman ER, Buck LB. 1994. A second subunit of the olfactory cyclic nucleotide-gated channel confers high sensitivity to cAMP. Neuron. 13:611–621. [DOI] [PubMed] [Google Scholar]
- Lindén SK, Sheng YH, Every AL, Miles KM, Skoog EC, Florin TH, Sutton P, McGuckin MA. 2009. MUC1 limits Helicobacter pylori infection both by steric hindrance and by acting as a releasable decoy. PLoS Pathog. 5:e1000617. [DOI] [PMC free article] [PubMed] [Google Scholar]
- Linden SK, Sutton P, Karlsson NG, Korolik V, McGuckin MA. 2008. Mucins in the mucosal barrier to infection. Mucosal Immunol. 1:183–197. [DOI] [PMC free article] [PubMed] [Google Scholar]
- López F, Delgado R, López R, Bacigalupo J, Restrepo D. 2014. Transduction for pheromones in the main olfactory epithelium is mediated by the Ca2+-activated channel TRPM5. J Neurosci. 34:3268–3278. [DOI] [PMC free article] [PubMed] [Google Scholar]
- Ma M, Grosmaitre X, Iwema CL, Baker H, Greer CA, Shepherd GM. 2003. Olfactory signal transduction in the mouse septal organ. J Neurosci. 23:317–324. [DOI] [PMC free article] [PubMed] [Google Scholar]
- Martínez-Antón A, Debolós C, Garrido M, Roca-Ferrer J, Barranco C, Alobid I, Xaubet A, Picado C, Mullol J. 2006. Mucin genes have different expression patterns in healthy and diseased upper airway mucosa. Clin Exp Allergy. 36:448–457. [DOI] [PubMed] [Google Scholar]
- McAuley JL, Linden SK, Png CW, King RM, Pennington HL, Gendler SJ, Florin TH, Hill GR, Korolik V, McGuckin MA. 2007. MUC1 cell surface mucin is a critical element of the mucosal barrier to infection. J Clin Invest. 117:2313–2324. [DOI] [PMC free article] [PubMed] [Google Scholar]
- McGuckin MA, Every AL, Skene CD, Linden SK, Chionh YT, Swierczak A, McAuley J, Harbour S, Kaparakis M, Ferrero R, et al. 2007. Muc1 mucin limits both Helicobacter pylori colonization of the murine gastric mucosa and associated gastritis. Gastroenterology. 133:1210–1218. [DOI] [PubMed] [Google Scholar]
- Nguyen Y, Procario MC, Ashley SL, O’Neal WK, Pickles RJ, Weinberg JB. 2011. Limited effects of Muc1 deficiency on mouse adenovirus type 1 respiratory infection. Virus Res. 160:351–359. [DOI] [PMC free article] [PubMed] [Google Scholar]
- Nguyen HM, Reyland ME, Barlow LA. 2012. Mechanisms of taste bud cell loss after head and neck irradiation. J Neurosci. 32:3474–3484. [DOI] [PMC free article] [PubMed] [Google Scholar]
- Nomura T, Takahashi S, Ushiki T. 2004. Cytoarchitecture of the normal rat olfactory epithelium: light and scanning electron microscopic studies. Arch Histol Cytol. 67:159–170. [DOI] [PubMed] [Google Scholar]
- Oberland S, Ackels T, Gaab S, Pelz T, Spehr J, Spehr M, Neuhaus EM. 2015. CD36 is involved in oleic acid detection by the murine olfactory system. Front Cell Neurosci. 9:366. [DOI] [PMC free article] [PubMed] [Google Scholar]
- Ostrowski LE, Hutchins JR, Zakel K, O’Neal WK. 2003. Targeting expression of a transgene to the airway surface epithelium using a ciliated cell-specific promoter. Mol Ther. 8:637–645. [DOI] [PubMed] [Google Scholar]
- Pathak S, Larson ED, Ramakrishnan VR, Finger TE. 2019. A subset of olfactory sensory neurons express forkhead box J1-driven eGFP. BioRxiv. 643460. doi:10.1101.643460. [DOI] [PMC free article] [PubMed] [Google Scholar]
- Pigny P, Guyonnet-Duperat V, Hill AS, Pratt WS, Galiegue-Zouitina S, d’Hooge MC, Laine A, Van-Seuningen I, Degand P, Gum JR, et al. 1996. Human mucin genes assigned to 11p15.5: identification and organization of a cluster of genes. Genomics. 38:340–352. [DOI] [PubMed] [Google Scholar]
- Rasband WS. 1994. ImageJ Available from: URL http://imagej.nih.gov/ij/.
- Restrepo D, Teeter JH, Schild D. 1996. Second messenger signaling in olfactory transduction. J Neurobiol. 30:37–48. [DOI] [PubMed] [Google Scholar]
- Rose MC, Voynow JA. 2006. Respiratory tract mucin genes and mucin glycoproteins in health and disease. Physiol Rev. 86:245–278. [DOI] [PubMed] [Google Scholar]
- Rubin BK. 2010. Mucus and mucins. Otolaryngol Clin North Am. 43:27–34, vii. [DOI] [PubMed] [Google Scholar]
- Schindelin J, Arganda-Carreras I, Frise E, Kaynig V, Longair M, Pietzsch T, Preibisch S, Rueden C, Saalfeld S, Schmid B, et al. 2012. Fiji: an open-source platform for biological-image analysis. Nat Methods. 9:676–682. [DOI] [PMC free article] [PubMed] [Google Scholar]
- Schneider CA, Rasband WS, Eliceiri KW. 2012. NIH image to ImageJ: 25 years of image analysis. Nat Methods. 9:671–675. [DOI] [PMC free article] [PubMed] [Google Scholar]
- Solbu TT, Holen T. 2012. Aquaporin pathways and mucin secretion of Bowman’s glands might protect the olfactory mucosa. Chem Senses. 37:35–46. [DOI] [PubMed] [Google Scholar]
- Tan L, Li Q, Xie XS. 2015. Olfactory sensory neurons transiently express multiple olfactory receptors during development. Mol Syst Biol. 11:844. [DOI] [PMC free article] [PubMed] [Google Scholar]
- Ueno K, Koga T, Kato K, Golenbock DT, Gendler SJ, Kai H, Kim KC. 2008. MUC1 mucin is a negative regulator of toll-like receptor signaling. Am J Respir Cell Mol Biol. 38:263–268. [DOI] [PMC free article] [PubMed] [Google Scholar]
- van Riel D, Verdijk R, Kuiken T. 2015. The olfactory nerve: a shortcut for influenza and other viral diseases into the central nervous system. J Pathol. 235:277–287. [DOI] [PubMed] [Google Scholar]
- Yang GC, Scherer PW, Zhao K, Mozell MM. 2007. Numerical modeling of odorant uptake in the rat nasal cavity. Chem Senses. 32:273–284. [DOI] [PubMed] [Google Scholar]
Associated Data
This section collects any data citations, data availability statements, or supplementary materials included in this article.


