Abstract
Some bitter taste receptors (TAS2R gene products) are expressed in the human sinonasal cavity and may function to detect airborne irritants. The expression of all 25 human bitter taste receptors and their location within the upper airway is not yet clear. The aim of this study is to characterize the presence and distribution of TAS2R transcripts and solitary chemosensory cells (SCCs) in different locations of the human sinonasal cavity. Biopsies were obtained from human subjects at up to 4 different sinonasal anatomic sites. PCR, microarray, and qRT-PCR were used to examine gene transcript expression. The 25 human bitter taste receptors as well as the sweet/umami receptor subunit, TAS1R3, and canonical taste signaling effectors are expressed in sinonasal tissue. All 25 human bitter taste receptors are expressed in the human upper airway, and expression of these gene products was higher in the ethmoid sinus than nasal cavity locations. Fluorescent in situ hybridization demonstrates that epithelial TRPM5 and TAS2R38 are expressed in a rare cell population compared with multiciliated cells, and at times, consistent with SCC morphology. Secondary analysis of published human sinus single-cell RNAseq data did not uncover TAS2R or canonical taste transduction transcripts in multiciliated cells. These findings indicate that the sinus has higher expression of SCC markers than the nasal cavity in chronic rhinosinusitis patients, comprising a rare cell type. Biopsies obtained from the ethmoid sinus may serve as the best location for study of human upper airway taste receptors and SCCs.
Keywords: bitter taste, chemoreceptor, chemosensory cell, rhinitis, sinusitis, taste transduction
Introduction
Classically, bitter taste receptors (TAS2Rs) in the taste buds of the tongue recognize a diverse array of bitter substances encountered in nature and aid in avoidance of ingestion of toxic substances. To date, 25 human bitter taste receptors have been characterized, and it is estimated that they are collectively responsible for detection of tens of thousands of chemically diverse bitter molecules (Meyerhof et al. 2010). In recent years, many studies have demonstrated extraoral expression of bitter receptors and functional importance of these receptors in their respective organ systems, independent of their classical “taste” purpose (Finger and Kinnamon 2011). Notably, scattered chemosensory cells—termed solitary chemosensory cells (SCCs)—have been described in the rodent nasal cavity, and these cells utilize bitter taste receptors and canonical taste transduction pathways to play a key role as sentinels of respiration (Finger et al. 2003). Subsequently TAS2R expression has been documented in the human sinonasal cavity and may be relevant in rhinosinusitis, where these receptors help monitor the airway surface liquid (ASL) and initiate an immune response (Barham et al. 2013; Cohen 2017). The efficient detection of bacterial quorum sensing molecules, such as gram-negative homoserine lactones and other bacterial metabolites, appears to require the bitter receptor TAS2R38 specifically (Lee et al. 2012; Lee and Cohen 2013; Verbeurgt et al. 2017). Thus, bitter taste receptor expression in the human airway represents a unique opportunity for initiation of defense against airborne insults.
Upper airway disorders, such as allergic rhinitis and chronic rhinosinusitis (CRS), are highly prevalent and economically burdensome inflammatory disorders of the nose and sinuses (Rosenfeld et al. 2015; Meltzer 2016). Anatomic structures of the nasal cavity and paranasal sinuses are often separated based on their differing histology, physiology, immune features, exposure to airflow, and relevance for particular airway diseases (Kamil et al. 1998; Schroeter et al. 2006). Nasal cavity structures, including the septum and the turbinates, are largely responsible for filtration and conditioning of inspired air and are attributed to the rhinitis group of nasal disorders. The sinuses are deeper structures with less potential airflow and are associated with acute and CRS. Acute rhinosinusitis and early CRS, of note, typically affect the maxillary and anterior ethmoid sinus, suggesting an importance of these sinuses in disease (Fraczek et al. 2017). SCCs have been identified in murine nasal respiratory epithelia and at the entrance duct of the mouse vomeronasal organ (Ogura et al. 2010). As they exhibit anatomic predilection to certain areas in the murine upper nasal cavity, it may be hypothesized that SCCs in human would be found in higher density on septum and turbinate structures.
The presence and distribution of all 25 human bitter taste receptors (TAS2Rs) and SCCs in the human nasal cavity have yet to be thoroughly examined. The aim of this study is to evaluate the presence and distribution of TAS2Rs and SCC markers in different locations of the human sinonasal cavity, to provide better indication of their physiological functions and identify areas where tissue biopsies may offer a higher yield for research study.
Materials and Methods
Patient recruitment
This study was performed in compliance with the Declaration of Helsinki for medical research involving human subjects and accordingly was approved by the Colorado Multi-Institutional Review Board (COMIRB #HS-11–1442 and #HS-14–0349), with all patients providing informed consent. Nasal tissue biopsies were obtained from subjects undergoing clinically indicated sinus surgery (Table 1). Control subjects undergoing sinus surgery for benign orbital or intracranial processes were enrolled. These subjects had normal hormonal function, absence of sinus symptoms, and normal sinus endoscopy and radiographic imaging. CRS patients with or without nasal polyps were also enrolled who underwent clinically indicated sinus surgery for symptoms refractory to medical therapies. The 2007 Adult Sinusitis Guidelines criteria were used for diagnosis (Rosenfeld et al. 2007), and clinical history for comorbid diseases was obtained from the medical chart.
Table 1.
Patient demographics
| Methods | qRT-PCR | RT-PCR | Microarray | ||||
| Groups | CRS | Control | CRSsNP | CRSwNP | Control | CRSsNP | CRSwNP |
| Number | 6 | 10 | 10 | 10 | 7 | 13 | 7 |
| Mean age (year) | 58.8 | 51.7 | 54.2 | 50.0 | 49.7 | 51.5 | 56.6 |
| Male (%) | 67 | 40 | 60 | 40 | 43 | 62 | 43 |
| Allergic rhinitis (%) | 50 | 10 | 40 | 80 | 29 | 46 | 100 |
| Asthma (%) | 33 | 0 | 0 | 70 | 0 | 46 | 100 |
| Purulence (%) | 17 | 0 | 40 | 40 | 0 | 39 | 71 |
| Never smoker (%) | 17 | 80 | 60 | 60 | 57 | 69 | 57 |
CRS, chronic rhinosinusitis; CRSsNP, chronic rhinosinusitis without nasal polyps; CRSwNP, chronic rhinosinusitis with nasal polyps.
Sinonasal tissue biopsy protocol
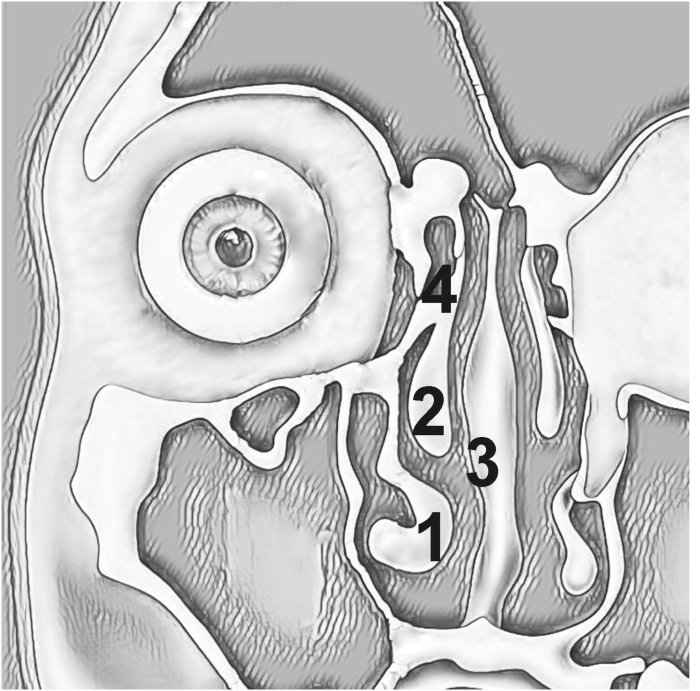
After the induction of general anesthesia, the nasal cavity was prepared with topical oxymetazoline-soaked cottonoids and submucosal injection of 1% lidocaine with 1:100 000 epinephrine. Biopsies (~4 mm diameter or larger) were obtained under direct endoscopic visualization using a smooth grasping forceps from at least one of each of the following regions as demonstrated in Figure 1: 1) anterior aspect of the inferior turbinate, 2) anterior head of the middle turbinate, 3) nasal septum respiratory epithelium opposite the anterior middle turbinate, and/or 4) anterior ethmoid sinus. Forceps were rinsed with saline between each biopsy to minimize cross-contamination. A portion of each biopsy was immediately immersed in RNAlater (Qiagen, Valencia, CA) and then stored at 4°C until RNA extraction, while remaining portions were fixed with 4% paraformaldehyde (PFA) or periodate-lysine-paraformaldehyde (PLP) for immunofluorescence staining. Samples from 6 CRS subjects were used to comparatively examine the nasal cavity and ethmoid anatomic subsites by qRT-PCR. Subsequently, 10 subjects from each group of control, CRS without nasal polyps (CRSsNP), and CRS with nasal polyps (CRSwNP) were used for RT-PCR examination of the 25 TAS2Rs and signal transduction transcripts within anterior ethmoid tissues. Last, a separate cohort of ethmoid sinus tissue specimens from control, CRSsNP, and CRSwNP subjects were interrogated with the Affymetrix GeneChip Human Transcriptome Array v2.0 to confirm these findings.
Figure 1.
Sinonasal biopsy sites. Areas of biopsy included at least one of the following regions: 1) anterior aspect of the inferior turbinate and/or 2) anterior head of the middle turbinate, 3) nasal septum opposite the anterior middle turbinate head, and 4) anterior ethmoid sinus. Figure adapted with permission from Ramakrishnan (2012).
Taste bud biopsy protocol
Fungiform papillae biopsies from the anterior tongue were obtained from healthy adult donors according to an established protocol (Spielman et al. 2010). Briefly, sterilized iris scissors were used to harvest 1–3 papillae, which were washed in phosphate-buffered saline (PBS) before processing for histology (see below).
RT-PCR and qRT-PCR
cDNA synthesis
RNAs were extracted using the Qiagen RNeasy Mini kit (Valencia, CA). To remove genomic DNA, a 30-min DNase I treatment was conducted at room temperature. The Qiagen QuantiTect Reverse Transcription kit (Valencia, CA) was used for cDNA synthesis. This cDNA synthesis kit includes a gDNA Wipeout Buffer for removal of any residual genomic DNA.
RT-PCR
RT-PCR was performed for the 25 human TAS2R bitter receptors, and the taste signaling effectors GNAT3 (α-gustducin), PLCB2 (phospholipase C β 2), and TRPM5 (transient receptor potential cation channel subfamily M member 5). Human tongue positive control was obtained from Clontech Inc (Mountain View, CA). Reverse transcription reactions were set up in which the reverse transcriptase enzyme was omitted as a control to detect for genomic DNA contamination. Samples that showed genomic DNA contamination were omitted from the study. Primers were designed using PrimerQuest (IDT, Coralville, IA) and listed in Table 2. The PCR procedure utilized the Qiagen Taq PCR Core kit as previously described, with all primer annealing temperatures at 57°C (Barham et al. 2013).
Table 2.
Primers used for RT-PCR
| Gene | Accession number | Primers (5′–3′) | Prod (bp) |
|---|---|---|---|
| TRPM5 | NM_0014555 | TGGTAGAGCGCATGATGAAG | 300 |
| ACCAACAGGAAGGTGACCAG | |||
| GNAT3 | NM_001102386 | TCTGGGTATGTGCCAAATGA | 366 |
| GGCCCAGTGTATTCTGGAAA | |||
| PLCB2 | NM_004573 | GTCACCTGAAGGCATGGTCT | 332 |
| TTAAAGGCGCTTTCTGCAAT | |||
| TAS2R1 | NM_019599 | GCATCATTGTGGTGGTGAATG | 632 |
| GGATCAGGAAGGACAGGATAGA | |||
| TAS2R3 | NM_016943 | GAGTTTCTAGGGTGATGGTATGG | 245 |
| GGGAGAAGATGAGCAAAGAGTAG | |||
| TAS2R4 | NM_016944 | ACTCGAGCAGTGTCTGGTTTGTGA | 473 |
| ACTGGACCAGGGTAGCAACTGAAT | |||
| TAS2R5 | NM_018980 | CCATCACCTCCAAGACTTATCC | 254 |
| ATGGAAAGCAGCTCCCTTATAG | |||
| TAS2R7 | NM_023919 | CATGGACTGGGTCAAGAAGAG | 352 |
| CAGTGGCTGGAAGGCTAATAA | |||
| TAS2R8 | NM_023918 | GTGGATTACCACCTGCCTTAAT | 522 |
| CTCTCCAAACTCCACAGCTAAC | |||
| TAS2R9 | NM_023917 | GGCTTCTTTATGCTGCTCTTTC | 442 |
| CGAATCTGCTTGGTGTGTCTA | |||
| TAS2R10 | NM_023921 | ATTCTCACCGGCTTAGCTATTT | 356 |
| GAGATCCCAGACTGTGTCATTC | |||
| TAS2R13 | NM_023920 | GAGCTGTCCTCAGTCGATAAAC | 547 |
| GGGTCTCTGTGTCCTTTGTAAT | |||
| TAS2R14 | NM_023922 | TGCTGCTTCTTGTGACTTCGGTCT | 249 |
| GTGTGCTGCATCTTCTTGCGATGT | |||
| TAS2R16 | NM_016945 | GGTCCCTTGCCGTCTTATTT | 199 |
| GGCCTAGCACTTTCCCTTTAG | |||
| TAS2R38 | NM_176817 | CTGCTGTTCCTGAGTGCTATC | 300 |
| CTGTGAAGTGAGGTCTGCTAAA | |||
| TAS2R39 | NM_176881 | CTGTGGCTGTCCGTGTTTAT | 242 |
| CATGTGTAGGGTGTGTCTCTTG | |||
| TAS2R40 | NM_176882 | GCCTGGCTCAAAGTCTTCTATT | 344 |
| CATGTGTAGGGTGTGTCTCTTG | |||
| TAS2R41 | NM_176883 | CCGACAGTTCTTCCATCTACAC | 316 |
| CCAGTTTCAGGGATGGGAAATA | |||
| TAS2R42 | NM_181429 | GACTGGTAAACTGCTCTGAAGG | 213 |
| AGCCAGGTTGTCAAGTGATTAG | |||
| TAS2R43 | NM_176884 | CCTTTCACCCAGTACCTCATTT | 348 |
| TAS2R44/31 | NM_176885 | CCAGTGTGGTAGTGGTTCTATTT | 245 |
| CGGTTACTGCCCAGACATTAT | |||
| TAS2R45 | NM_176886 | CCAGTACCAAGGTCCACATAAA | 210 |
| GTCTGCTTTAGCTTCTTGTTTCC | |||
| TAS2R46 | NM_176887 | AGATCCCAGCATGAAGGTCCACAT | 255 |
| TTTCACCCAGTACCTCACATGCCA | |||
| TAS2R47/30 | NM_001097643 | TGGTTTGCTCTGGGTGTTATT | 663 |
| GAATGGGTGGGTTGAAGGATAG | |||
| TAS2R48/19 | NM_176888 | TCTAGCAAACCTCATACCCTTTAC | 227 |
| CTCTGCTGTGTCCTAAGATTCC | |||
| TAS2R49/20 | NM_176889 | AGTTGGTTTGCTCTGGGTAATA | 411 |
| CAGGGTCAGAGTGAATGGTATC | |||
| TAS2R50 | NM_176890 | CTGGGTTGTAACCAACCATTTC | 208 |
| CTTCTGCCCACATACTCTCATC | |||
| TAS2R60 | NM_177437 | CCTGGCTCAGTGTCTTCTATTG | 513 |
| GACTCCCACACCCAGAATTT |
Quantitative RT-PCR
Quantitative RT-PCR (qRT-PCR) was performed for ARL13B (ADP Ribosylation Factor-Like GTPase 13b), a multiciliated cell marker and the selected taste effectors including TAS2R38, TAS1R3, TAS2R47, PLCB2, and TRPM5. qRT-PCR was used to compare expression levels at different locations sampled within a single subject’s sinonasal cavity. One microgram of cDNA was used in each reaction using the iTaq Universal SYBR Green Supermix (Bio-Rad, Hercules, CA). Primers (10 µM) were designed for TAS2R38, TAS2R47, TAS1R3, TRPM5, PLCB2, and GAPDH (glyceraldehyde-3-phosphate dehydrogenase) and purchased from Integrated DNA Technologies (Coralville, IA) and shown in Table 3. Amplification procedures included an initial 10-min denaturation at 95°C, followed by 40 cycles of 15-s denaturation at 95°C and 60-s annealing and extension at 60°C, conducted in the Bio-Rad CFX Real-Time PCR Detection System (Bio-Rad, Hercules, CA). Each sample and gene was examined in triplicate.
Table 3.
Primers used for qRT-PCR
| Gene name | Accession number | Primers (5′–3′) | Prod (bp) |
|---|---|---|---|
| GAPDH | NM_002046 | GGTGTGAACCATGAGAAGTATGA | 122 |
| GAGTCCTTCCACGATACCAAAG | |||
| TAS1R3 | NM_152228 | GCACCAGGTTCTCCTCAAA | 121 |
| CGTATCAAAGAGGTCGTAGCC | |||
| TAS2R47/30 | NM_001097643 | ATCCTTCAACCCACCCATTC | 102 |
| CTTCTGTCTTTCACCCAGTACC | |||
| TAS2R38 | NM_176817 | ATCCTGTGTTGCCTTCATCTC | 94 |
| AGGGACAAGCTGCCATTATC | |||
| PLCB2 | NM_004573 | CCATGTAGAAGTGGAGCTGTTT | 94 |
| CCAGACAGGATTGATGGAGTTAG | |||
| ARL13B | NM_182896 | GGAGCTTTAGGAGAAGCTGATG | 84 |
| GTTCTATCTGACACAGGCACTT |
Statistical analysis
The comparative cycle threshold (CT) relative expression method (2−ΔΔCT) was used for quantitation of the mRNA expression level of selected genes with GAPDH as an internal reference gene. The reference calibrator for the target genes was the mean ΔCT value (CTtarget gene − CTGAPDH) for the anterior ethmoid sinus. The relative expression of bitter taste receptors and SCCs markers were compared with the highest gene expression level by anatomic group. To compare expression levels of taste receptors and SCC markers in different locations, one-way ANOVA with Dunnet’s post-test was used in GraphPad Prism 5.0 (GraphPad Software, La Jolla, CA; www.graphpad.com). Data were represented as mean ± SEM. Differences were considered significant at P < 0.05.
Microarray
RNA preparation
RNAs from tissue specimens were added to RLT buffer containing β-mercaptoethanol and 0.1 mm Zirconia/Silica beads (BioSpec, Bartlesville, OK) and incubated for 5 min at room temperature with intermittent vortexing. Samples then underwent bead beating for 30 s at 6000 rpm using a Magna Lyser (Roche, Germany) and centrifuged for 3 min at 10 000 rpm. Samples were processed according to protocol, including a 15-min incubation with DNase I (Qiagen, Valencia). RNA concentration was measured using a ND-1000 Spectrophotometer (NanoDrop Technologies, Wilmington, DE).
Gene array and data analyses
Microarray analysis was performed at the University of Colorado Genomics and Microarray Core. Five hundred nanogram of RNA was reverse-transcribed and cDNA labeled, hybridized onto Affymetrix GeneChip Human Transcriptome Array 2.0 gene chips (Affymetrix, Santa Clara, CA), and processed according to manufacturer specifications. Target gene probes were labeled with FAM and reference normalizer probe set was labeled with VIC (Applied Biosystems, Grand Island, NY). Affymetrix CEL files were read and RMA normalized using the Oligo package in R (http://www.r-project.org/) (Carvalho and Irizarry 2010). Differential expression analysis was performed with Limma (Ritchie et al. 2015). Gene expression was fit with a linear model, and differential expression statistics were calculated using an empirical Bayes moderation of the standard errors method (glmQLFit and eBayes within Limma) (Phipson et al. 2016). Statistical significance was determined when q (FDR-adjusted P) < 0.1.
RNAscope in situ hybridization
Middle turbinate, ethmoid, and lingual specimens were fixed in buffered 4% PFA or PLP (periodate-lysine-1.6% PFA) and kept in 20% sucrose overnight for cryoprotection. Tissues were sectioned at 14 µm with a cryostat, collected on charged glass slides, and frozen until use. RNA in situ hybridization was performed using RNAscope (ACD Bio, Newark, CA) technology (Wang et al. 2012), an ultrasensitive and robust method for detecting RNA in fixed tissues. RNAscope was performed according to manufacturer’s protocol. Briefly, tissue sections were prepared by treatment with hydrogen peroxide, antigen retrieval using Target Retrieval Solution (ACD Bio; 95°C for 10 min), and treatment with Protease III (ACD Bio). RNA probes (Table 4) were hybridized for 2 h followed by amplification. After addition of horseradish peroxidase, fluorophores (Table 4) were added sequentially to detect bound, amplified probe. After each fluorophore, unreacted horseradish peroxidase was blocked before adding the next fluorophore. After labeling, slides were immediately processed for immunohistochemistry (see below).
Table 4.
RNA probes, antibodies, and fluorescent secondaries
| Name | Catalogue number | Company | Dilution | RRID |
|---|---|---|---|---|
| RNAscope HS-TAS2R38 | 4055871 | ACD Bio | Stock | n/a |
| RNAscope HS-TRPM5 | 400891-C3 | ACD Bio | 1:1000 | n/a |
| Ms α-acetylated tubulin | T7451 | Sigma-Aldrich | 1:2000 | AB_609894 |
| Goat GNAT3 | OAEB00418 | AVIVA | 1:300 | AB_10882823 |
| Opal-520 | FP1487001KT | Perkin Elmer | 1:1500 | n/a |
| Opal-570 | FP1488001KT | Perkin Elmer | 1:1500 | n/a |
| α-ms Alexa 647 | A31571 | Thermo Fisher | 1:800 | AB_162542 |
| DAPI | D1306 | Thermo Fisher | 1:5000 | AB_2629482 |
Immunohistochemistry
Frozen slides were thawed, washed with phosphate buffer (pH 7.35–7.45), then blocked for 1 h in 2% normal donkey serum, 1% bovine serum albumin, 0.3% Triton-X100 in PBS. Slides were then washed with PBS 3 times and incubated with primary antibody overnight at 4°C. Slides were thoroughly washed and subsequently incubated with the appropriate secondary antibody 2 h in the dark. Slides were counterstained with DAPI prior to mounting with Fluoromount G (Sothern Biotech, Birmingham, AL). For antibodies used in this study, see Table 4. Controls performed with each experiment included an endogenous tissue background control and a secondary antibody only control. Images were acquired on a Leica SP8 laser scanning confocal microscope equipped with a 63× lens (NA. 1.4).
Secondary analysis of single-cell RNAseq
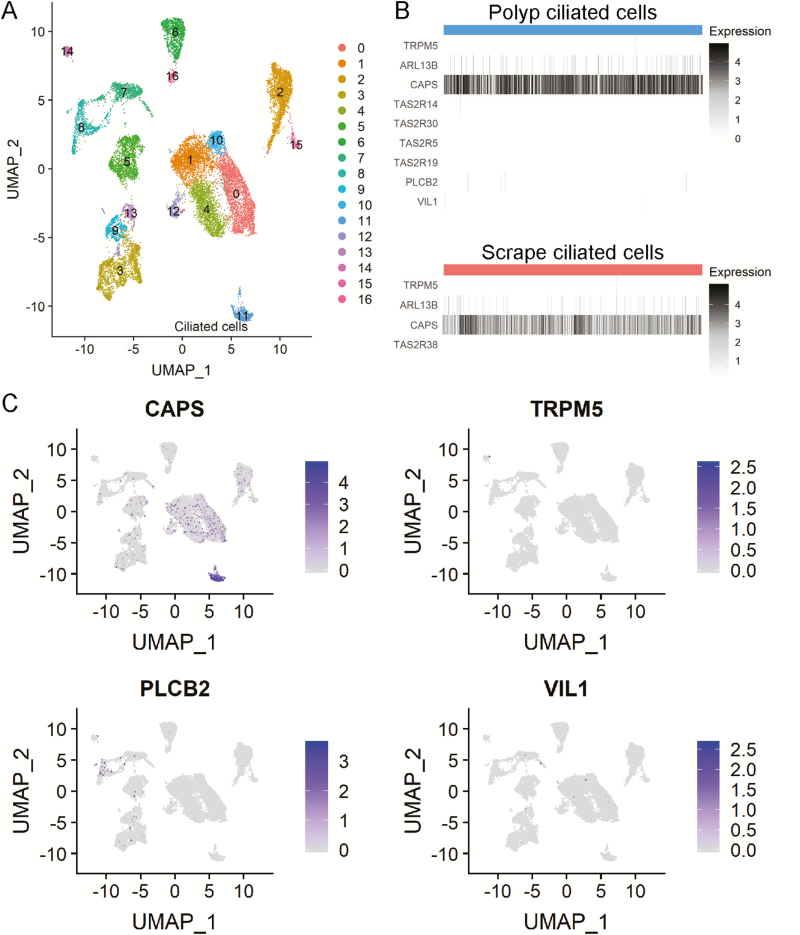
To evaluate for cell-specific expression of taste transcripts in human sinus tissues, secondary analysis was performed on the raw count table obtained from Supplementary Tables 2 and 6 in Ordovas-Montanes et al. 2018. The raw count tables were input to Seurat V3.0 (Butler et al. 2018) in R 3.6.0 (R Core Team 2019). Cells were filtered based on unique molecular identifier count (<15 000), unique gene counts (>300), and percent mitochondrial gene expression (<20%) resulting in 18 143 cells. The data set was normalized and center-scaled with percent mitochondrial genes regressed out. Clustering was performed using “FindNeighbors(dims=1:30)” and “FindClusters(resolution=0.5).” Dimensionality reduction was performed using Uniform Manifold Approximation and Projection (McInnes et al. 2018; Becht et al. 2019). Cluster markers were identified with “FindAllMarkers(),” and significance was determined by FDR-adjusted P value of <0.05. Plots displayed in Figure 9 were generated with “DimPlot(),” “DoHeatmap(),” and “FeaturePlot().”
Figure 9.
Secondary analysis of human nasal scRNAseq (Ordovas-Montanes et al. 2018, Supplementary Tables 2 [polyp] and 6 [epithelial scrapings]). (A) Raw counts of “polyp” data set were input to Seurat for filtering, normalization, and scaling. Clustering of 18,143 cells was determined using the K-nearest neighbor approach followed by the Louvain algorithm. Data are plotted after UMAP dimensionality reduction. Cluster 11 represents ciliated epithelial cells defined by expression of canonical ciliated cell markers including CAPS, FOXJ1, and TUBA1A. Other cell types identified include basal, apical, glandular, fibroblast, endothelial, plasma, T, myeloid, and mast based on top cluster markers, in accordance with the analyses of Ordovas-Montanes et al. (B) Heatmap of cells in ciliated cell cluster from both “polyp” and “scrape” data set showing expression of all nonzero TAS2R genes and canonical SCC markers TRPM5, VIL1, and PLCB2. Although few cells had some detectable levels of these markers, there was no overlapping expression of these markers within cells. (C) Overlap of UMAP plot showing expression of CAPS, TRPM5, PLCB2, and VIL1.
Results
Quantitative RT-PCR evaluation by anatomic sites
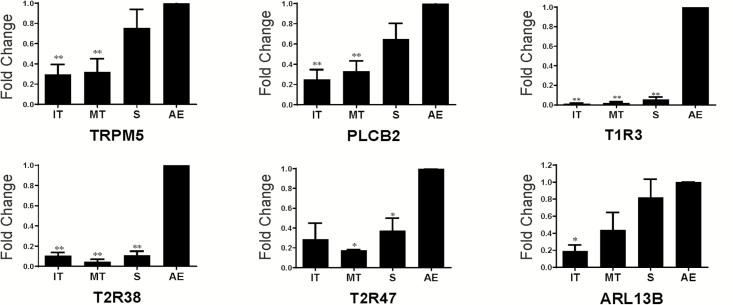
Six CRS subjects were examined by qRT-PCR at 4 anatomic subsites (middle turbinate [MT], inferior turbinate [IT], septum [S], and anterior ethmoid sinus [AE] to determine relative expression of selected taste effectors in the nasal cavity versus paranasal sinus. The mean age of participants was 58.8 years (range 27–76), with a male:female ratio of 4:2 (Table 1). TAS2R38 was examined as there are now abundant data showing its airway expression with associated physiological importance (Shah et al. 2009; Lee et al. 2012). TAS2R47 and the sweet/umami receptor subunit, TAS1R3, were evaluated as they appear to be uniquely expressed by SCCs (Lee et al. 2014). The downstream taste signaling effectors, TRPM5 and PLCB2, are markers of SCCs in rodents and humans (Finger et al. 2003; Tizzano et al. 2010; Barham et al. 2013). Expression of a ciliary GTPase, ARL13B, was used as a marker for multiciliated cells.
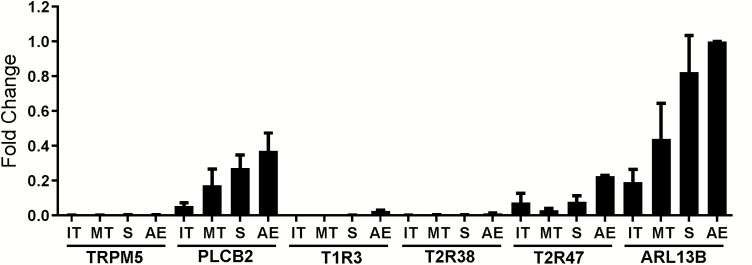
We found that TRPM5, PLCB2, TAS1R3, TAS2R38, TAS2R47, and ARL13B were expressed in all 4 sinonasal subsites (inferior turbinate, middle turbinate, septum, and anterior ethmoid sinus) (Figure 2). Expression of all gene products was higher in the ethmoid sinus than other locations. The expression level of ARL13B is the highest, followed by PLCB2 and TAS2R47; relative expression of TRPM5, TAS1R3, and TAS2R38 were comparatively lower (Figure 3).
Figure 2.
Relative mRNA expression of TRPM5, PLCB2, TAS1R3, TAS2R38, TAS2R47, and ARL13B in different sinonasal locations in human CRS patients. IT, inferior turbinate; MT, middle turbinate; S, septum; AE, anterior ethmoid. *P < 0.05, **P < 0.01 versus anterior ethmoid. Data are represented as means ± SEM relative to AE expression. n = 4–6 patients with chronic rhinosinusitis.
Figure 3.
Relative mRNA expression of TRPM5, PLCB2, TAS1R3, TAS2R38, TAS2R47, and ARL13B in human inferior turbinate, middle turbinate, septum, and anterior ethmoid sinus from CRS patients. IT, inferior turbinate; MT, middle turbinate; S, septum; AE, anterior ethmoid. Expression is shown relative to AE ARL13B. Data are represented as means ± SEM. n = 4–6 patients with chronic rhinosinusitis.
RT-PCR findings in health versus disease
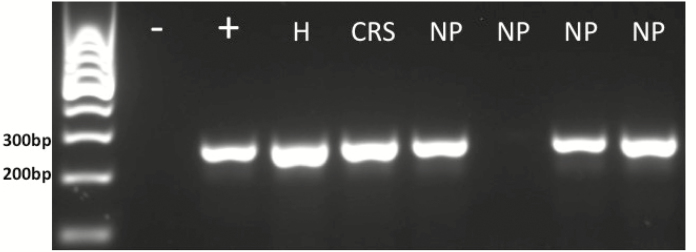
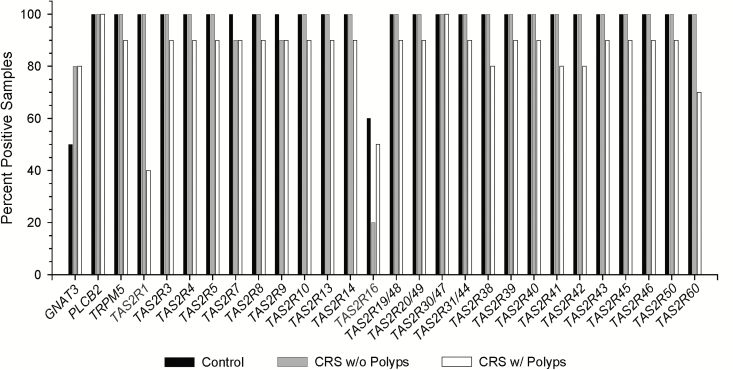
Thirty subjects were examined by RT-PCR of anterior ethmoid tissues, including 10 each of control subjects, CRSsNP, and CRSwNP (Figure 4). The mean age of this group was 51 years (range 22–77), with a male/female ratio of 2:1 (Table 1). Nearly all subjects expressed the 25 TAS2Rs and signaling effectors (Figure 5). Notably, GNAT3 was expressed in fewer samples, even when PLCB2 and TRPM5 were present, suggesting that there could be alternative G-protein subunits involved as there are in traditional bitter taste (Wong et al. 1996). TAS2R1 and TAS2R16 were the least expressed of the TAS2Rs. There was no consistent pattern of expression or lack of expression by disease group.
Figure 4.
Representative RT-PCR for TAS2R31. GelRed-stained RT-PCR products from mRNA obtained from human ethmoid sinus tissue for TAS2R31 (246 bp). In order, lanes represent: ladder, negative control (no template/water), human tongue positive control, and individual subjects (H, healthy; CRS, chronic rhinosinusitis without nasal polyps; NP, 4 different patients with chronic rhinosinusitis with nasal polyps).
Figure 5.
RT-PCR of TAS2Rs and taste signaling effectors show near ubiquitous expression across controls and CRS subjects. TAS2R1 and TAS2R16 were the 2 receptors exhibiting less-frequent expression.
Microarray
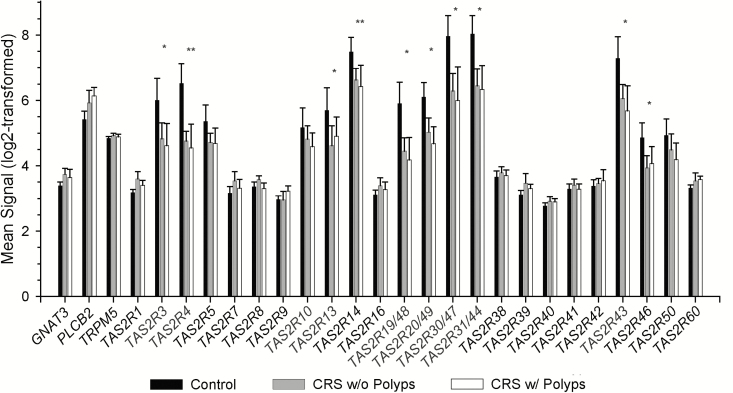
Anterior ethmoid tissues from 27 separate subjects were interrogated by microarray, including 7 control subjects, 13 CRSsNP, and 7 CRSwNP subjects. Mean age was 52.4 years (range 25–69), with a male/female ratio of 13:14 (Table 1). Data indicate the universal presence of bitter taste transduction components, validating our individual RT-PCR findings. Quantitative comparison indicates diminished expression of several gene products in the CRS disease state reaching statistical significance, but the physiological relevance of these low-level changes in gene expression is unclear (Figure 6).
Figure 6.
Transcriptome array findings demonstrate common expression of TAS2Rs and taste signaling effectors. Differential gene expression in control subjects and CRS patients with and without polyps. No significant differences were observed between CRS with and without polyps. *FDR < 0.001 across all 3 groups, log-fold change < −1; **FDR < 0.001, log-fold change < −2.
RNAscope in situ hybridization
Our qRT-PCR experiments show that TAS2R genes and taste transduction elements are less expressed than the ciliated cell marker ARL13B, suggesting that these markers could belong to the small subpopulation of chemosensory cells in the human sinonasal epithelium consistent with findings in murine airways. To explore this histologically, we attempted immunofluorescence assays on nasal biopsies using several antibodies and multiple fixation and staining protocols. However, results were inconclusive and often fraught with high background or strong fluorescence in negative control experiments. Thus, we turned to in situ hybridization using the ultrasensitive RNAscope technology.
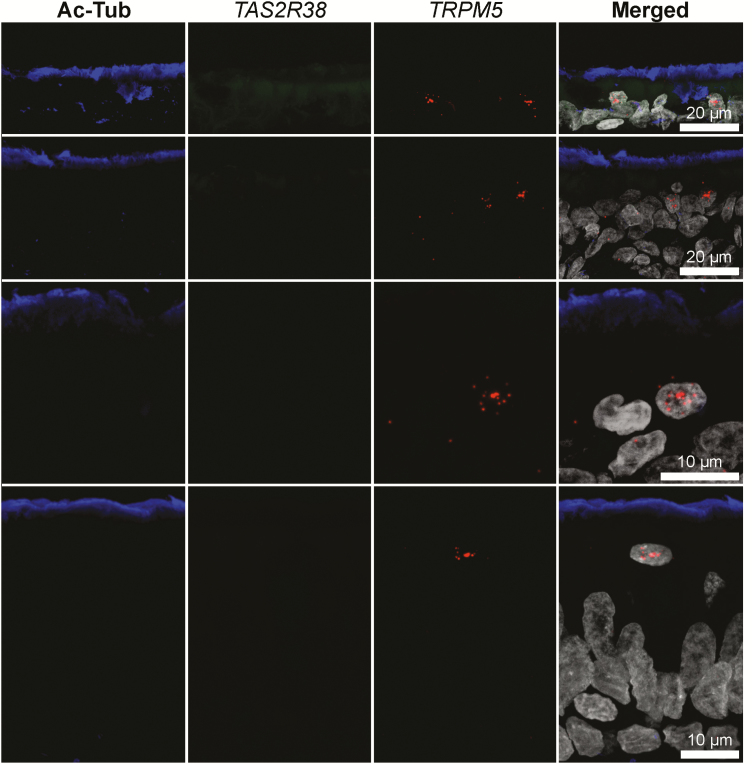
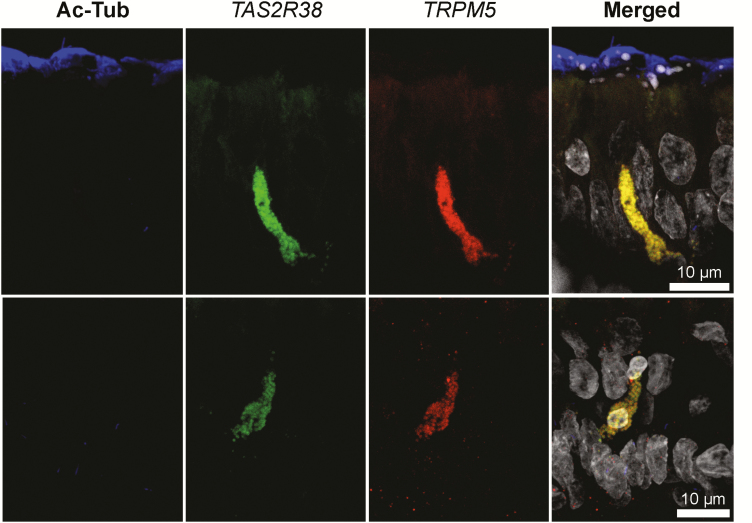
Sinus tissue sections were labeled using probes against TRPM5 and TAS2R38. We observed scattered TRPM5 RNA labeling throughout the ciliated epithelium and often apically located within the epithelium (Figure 7). Given the nuclear nature of this signal, we are unable to attribute this RNA to a specific cell type. However, as it was clearly in a minority of epithelial cells, we hypothesize that the TRPM5 RNA probes are likely not labeling ciliated epithelial cells. TAS2R38 signal was far less prevalent, but observed in cells with SCC morphology (Figure 8) and coincident with TRPM5 signal. When RNA probes were omitted from the RNAscope protocol, these staining patterns were not observed (Supplementary Figure S1).
Figure 7.
RNAscope in situ hybridization identifies cells containing TRPM5 but not TAS2R38 RNA in sinonasal epithelium. Sinonasal tissues were examined using RNAscope with probes against TRPM5 and TAS2R38 followed by IHC with anti-acetylated tubulin (Ac-Tub) antibodies. TRPM5 RNA fluorescence is observed as a punctate star-like pattern associated with cell nuclei.
Figure 8.
RNAscope in situ hybridization labels a rare population of elongated chemosensory cells within the ciliated epithelium. TAS2R38 expression was only observed in a rare population of cells morphologically consistent with SCCs that co-express TRPM5.
As a positive control for our RNAscope probes, we labeled human fungiform papillae biopsies with TRPM5 and TAS2R38 probes. Indeed, α-gustducin-immunoreactive taste cells had detectable TRPM5 and TAS2R38 RNA (Supplementary Figure S2). This signal was not observed when the RNAscope probes were omitted from the assay.
From these results, we conclude that 1) TRPM5+ cells (likely SCCs) are a minority cell population in the human nasal epithelium and 2) TAS2R38 RNA is absent in ciliated cells and when present in the epithelium, coincides with TRPM5 RNA presence.
Single-cell RNAseq secondary analysis
To further evaluate cell-specific expression of bitter taste receptors and taste signaling effectors, we performed secondary analysis of a recent single-cell transcriptomics study of excised human sinus tissue (Ordovas-Montanes et al. 2018). Findings from this study of sinus tissues and scrapings profiled over 36 000 cells from epithelial and subepithelial compartments, where few if any cells showed expression of TAS2R38 or taste transduction elements. The ciliated cell population (cluster 11 in Figure 9A) was defined by significant cluster markers such as FOXJ1 and CAPS as shown by Ordovas-Montanes. Neither TAS2R38 nor other TAS2R genes were enriched in this population strongly arguing that TAS2R38 is not expressed in ciliated epithelial cells, in agreement with data presented in the current study. Also of note, TAS2R38 was not expressed in myeloid cells (cluster 8 in Figure 9A) as has been recently reported (Maurer et al. 2015). Although some classic SCC markers were identified (Figure 9B), their expression appeared scattered throughout different clusters (Figure 9C) and at low levels. Individual cells rarely expressed more than one SCC marker, indicating the rarity of SCCs or their exclusion in the tissue processing. Although Seq-Well single-cell RNAseq (scRNAseq) (Gierahn et al. 2017) may not completely evaluate expression of low-level transcripts, taken in the context of prior study of mammalian SCCs and RNAscope data shown here, these findings strongly support the hypothesis that epithelial TAS2Rs and taste effectors are expressed in SCCs.
Discussion
Here, we have demonstrated expression of all 25 bitter taste receptors and associated taste signaling effectors in human sinonasal tissues. We observed all examined genes (TAS1R3, TAS2R38, TAS2R47, TRPM5, PLCB2, and ARL13B) to be expressed to a larger degree in the ethmoid sinus when compared with nasal cavity sites in CRS subjects, expanding on the findings of our previous study (Barham et al. 2013). When comparing ethmoid tissues from CRS subjects versus controls, frequency of expression of taste transcripts was similar between the 2 groups, and comparable expression levels of most TAS2Rs were observed between groups. Data from the qRT-PCR and microarray experiments were generally consistent, although seemingly more PLCB2 and TRPM5 transcripts were detected by qRT-PCR than by microarray. This observation may be attributed to technical differences between the assays. We confirmed that ciliated epithelium was present in these tissue samples and curiously noted relatively low amounts of the taste receptors compared with the high amount of ARL13B (ciliary GTPase) mRNA. Utilizing RNAscope in situ hybridization, we were able to detect TRPM5 and TAS2R38 mRNA in the sinonasal tissues. We observed one type of TRPM5-positive cell generally located apically in the epithelium with nuclear labeling. The majority of these TRPM5-positive cells had no detectable TAS2R38 mRNA, which was largely absent from the nasal epithelium despite abundance of cilia. Second, we observed rare cells with morphology typical of SCCs exhibiting cytoplasmic colabeling with probes against TRPM5 and TAS2R38. The rarity of this cell population in humans corresponds to prior study in rodents, where airway chemosensory cells make up a small (~0.5–1%) proportion of the respiratory epithelial cell population (Gulbransen et al. 2008; Tizzano et al. 2011; Saunders et al. 2013) and selectively express taste transduction elements. To further evaluate cell-specific expression of bitter taste receptors and taste signaling effectors, we performed secondary analysis of a recent single-cell transcriptomics study of excised human sinus tissue (Ordovas-Montanes et al. 2018). The conclusions we made from these analyses agree strongly with the original data presented in this manuscript, namely that we could not detect TAS2R or taste signaling transcripts in ciliated cells.
TAS2Rs in the rodent upper airway have been classically identified in the anterior nasal cavity in TRPM5-expressing SCCs (Finger et al. 2003; Tizzano et al. 2010). Our previous results showed that TAS2R4, TAS2R14, TAS2R46, and downstream signaling effectors were also expressed in human nasal cavity (Barham et al. 2013); however, cell types expressing these components in extraoral airway tissues are still unclear. It has previously been reported that human airway epithelia—both multiciliated cells and SCCs—express taste receptors (Shah et al. 2009; Lee et al. 2012, 2014; Yan et al. 2017). This contrasts with existing literature in the rodent nasal cavity, where TAS2R and TAS1R genes have been observed exclusively in SCCs (Tizzano et al. 2011). In the current report, we also examine this inconsistency, with particular attention to TAS2R38 expression. Our qRT-PCR results and immunostaining demonstrated an abundance of ciliated cells; however, taste transcripts remained relatively low. Published results regarding TAS2R38 expression in airway cilia are primarily based on immunohistochemistry (Shah et al. 2009; Lee et al. 2012). Antibody validation in human tissues is exceedingly challenging, and one explanation for the discrepancy between our findings and the published literature is that the antibody used in these studies was poorly validated in human tissues and is unfortunately no longer available. A second potential explanation is that some of these important experiments were performed in cell culture systems where in vitro findings may not be completely translatable in vivo or in human subjects with varying degrees of tissue inflammation. Our repeated attempts at immunofluorescence microscopy in both CRS and control tissues under many different conditions, using antibodies validated in human tongue, revealed nonspecific and/or off target staining in stroma, subepithelial glands, and respiratory cilia colocalizing with α-tubulin. This difficulty has been highlighted by others, as well. As discussed by Behrens et al. (2012), only one of 5 antibodies detected the corresponding receptor in transiently transfected mammalian cell lines, whereas the other antisera failed to recognize their specific epitope even with high expression levels of the receptors. To overcome these challenges, we utilized RNAscope in situ hybridization and secondary analysis of a large scRNAseq data set. As summarized above, these findings suggest that TAS2R38 and taste effectors are not found in multiciliated cells. Interestingly, a prior study utilizing a multi-faceted proteomics approach to study of ciliary axonemes likewise did not identify TAS2Rs or taste transduction elements within respiratory cilia (Ostrowski et al. 2002). As our findings are primarily RNA based, some limitations exist, and the issue warrants further study.
As a group, bitter taste receptors exhibit the ability to detect a wide range of bitter compounds with varied chemical structures. Evolutionarily, bitter taste signals in detection of food compounds, but also as a beneficial warning sign for the avoidance of toxins. Airway bitter taste receptors could serve any number of functions, from detection of volatile food compounds to microbial metabolites or other airborne irritants. Studies in rodents have established a clear role for this type of “sentinel” detection in the airway (Finger et al. 2003), and bitter receptors such as the broadly tunes TAS2R38 may be able to detect many different bacterial-derived molecules and initiate rapid immune responses (Tizzano et al. 2010; Lee et al. 2012; Verbeurgt et al. 2017). The complete repertoire of human bitter receptors is probably able to detect numerous natural ligands in the ASL and may link to cell-specific machinery to initiate immune responses. Mucociliary transport is a key feature of airway physiology, as the mucus blanket above the cilia traps potentially harmful foreign particles, pollutants, and pathogens before they can reach the lungs. Sampling of sequestered molecules in the ASL by TAS2Rs and SCCs may play a key role in human respiratory health. It is therefore not a surprise that these gene products would be expressed throughout the ciliated epithelium of the sinonasal region. Similarly, taste receptors in humans have been increasingly recognized in many luminal surfaces, serving a variety of purposes (Lu et al. 2017). Expression of taste effectors in extraoral tissues may not occur at similar levels in tongue, but can still be physiologically relevant. Although we did not directly compare sinus expression levels to tongue, a recent publication did explore this question. TAS2R38 mRNA in sinus versus tongue with an accompanying secondary analysis of Genotype-Tissue Expression Consortium data concluded that gene expression in one tissue was not correlated with abundance in other tissues (Douglas et al. 2019).
Inflammatory nasal disorders such as rhinitis and CRS result in severe quality of life impairments, healthcare burden, and productivity losses for affected patients. In recent years, an increasingly accepted role for taste signaling in the regulation of mucosal immunity distinguish this pathway as a novel target for management of airway diseases (Deshpande et al. 2010; Lee and Cohen 2013; Douglas et al. 2016). Importantly, human nasal anatomy is more complex than the rodent, and diseases may localize to specific anatomic compartments. For instance, rhinitis is defined by its restriction to the nasal cavity with particular importance in the inferior turbinate (Orlandi et al. 2016), whereas the paranasal sinuses and especially the maxillary and anterior ethmoid sinus are the major areas affected CRS (Farmer and Eccles 2006). As guardians of the airway to irritants, toxins, and microbes, one might speculate that SCCs are most likely to be found in humans along the turbinates and septum, given the greater exposure to airflow and particulate deposition. However, we found increased expression of taste signaling transcripts in the sinus when compared with these nasal cavity structures. The finding of increased mRNA transcripts in the sinuses in CRS subjects provides further evidence for its role in sinus health and suggests that sinus tissue may be a useful site to study the function of TAS2Rs and SCCs. Interestingly, there was decreased expression of some TAS2Rs in CRS subjects (both with and without polyps) when compared with controls; however, the clinical relevance of this finding is unknown.
One of the limitations of the present study is that anatomic site comparisons were performed only in samples available from CRS patients, and it is therefore not known if this pattern of differential expression would hold true in healthy subjects. It could be possible that increased sinus expression of taste effectors in CRS is part of the disease process or response to chronic inflammation or repeated infection. In our previous work, we examined 4 TAS2Rs and taste signaling molecules in the uncinate process of control and CRS subjects, and found no difference between the 2 groups by qRT-PCR (Barham et al. 2013), in contrast to the subtle findings seen on the microarray in this study. Further work, particularly protein expression and physiology experiments, will be critical to determining the role for taste signaling in airway health and disease. Additionally, deeper sampling of the nasopharynx, sphenoid, or frontal sinus tissues was not included, so no comment can be made for these areas. Single-cell RNAseq is a rapidly evolving technology, and newer methods may prove more reliable for inclusion of rare cell types, such as SCCs, and detection of lower level transcripts.
Conclusion
Expression of chemosensory cell markers, bitter taste receptors, and ciliated cells were highest in the ethmoid sinus when compared with the anterior nasal cavity sites. Higher expression of taste receptors and SCC markers in the sinus carries implications for their potential role(s) in upper airway physiology, and future study of this newly recognized part of the innate immune system. Immunolocalization studies have been challenging in human; however, RNA-based cellular assays indicate that TAS2R38 expression may not occur in multiciliated cells as has been previously published.
Supplementary Material
Acknowledgments
We thank Thomas Finger, PhD, and Marco Tizzano, PhD, for their valuable advice and expertise in fluorescence microscopy. We thank Eszter Vladar, PhD, and Evgenia Dobrinskikh, PhD, for their advice and assistance with RNAscope. Jingguo Chen gratefully acknowledges the financial support from Xi’an Jiaotong University Health Science Center.
Funding
Research reported in this publication was supported by the National Institute on Deafness and Other Communication Disorders of the National Institutes of Health under Award Number K23DC014747 (V.R.R.) and Flight Attendants Medical Research Institute grant CIA130066 (D.N.F.). The content is solely the responsibility of the authors and does not necessarily represent the official views of the National Institutes of Health.
Ethics statement
This study was performed in compliance with the Declaration of Helsinki for medical research involving human subjects and accordingly was approved by the Colorado Multi-Institutional Review Board (COMIRB #HS-11–1442 and #HS-14–0349), with all patients providing informed consent.
Conflicts of interest
The authors have no relevant conflicts of interest to disclose. These data were presented in part at the Association for Chemoreception Sciences annual meetings (2017, abstract #156; 2018, abstract #438).
References
- Barham HP, Cooper SE, Anderson CB, Tizzano M, Kingdom TT, Finger TE, Kinnamon SC, Ramakrishnan VR. 2013. Solitary chemosensory cells and bitter taste receptor signaling in human sinonasal mucosa. Int Forum Allergy Rhinol. 3:450–457. [DOI] [PMC free article] [PubMed] [Google Scholar]
- Becht E, McInnes L, Healy J, Dutertre C-A, Kwok IW, Ng LG, Ginhoux F, Newell EW. 2019. Dimensionality reduction for visualizing single-cell data using UMAP. Nat Biotechnol. 37:38. [DOI] [PubMed] [Google Scholar]
- Behrens M, Born S, Redel U, Voigt N, Schuh V, Raguse JD, Meyerhof W. 2012. Immunohistochemical detection of TAS2R38 protein in human taste cells. PLoS One. 7:e40304. [DOI] [PMC free article] [PubMed] [Google Scholar]
- Butler A, Hoffman P, Smibert P, Papalexi E, Satija R. 2018. Integrating single-cell transcriptomic data across different conditions, technologies, and species. Nat Biotechnol. 36:411–420. [DOI] [PMC free article] [PubMed] [Google Scholar]
- Carvalho BS, Irizarry RA. 2010. A framework for oligonucleotide microarray preprocessing. Bioinformatics. 26:2363–2367. [DOI] [PMC free article] [PubMed] [Google Scholar]
- Cohen NA. 2017. The genetics of the bitter taste receptor T2R38 in upper airway innate immunity and implications for chronic rhinosinusitis. Laryngoscope. 127:44–51. [DOI] [PMC free article] [PubMed] [Google Scholar]
- Deshpande DA, Wang WC, McIlmoyle EL, Robinett KS, Schillinger RM, An SS, Sham JS, Liggett SB. 2010. Bitter taste receptors on airway smooth muscle bronchodilate by localized calcium signaling and reverse obstruction. Nat Med. 16:1299–1304. [DOI] [PMC free article] [PubMed] [Google Scholar]
- Douglas JE, Saunders CJ, Reed DR, Cohen NA. 2016. A role for airway taste receptor modulation in the treatment of upper respiratory infections. Expert Rev Respir Med. 10:157–170. [DOI] [PMC free article] [PubMed] [Google Scholar]
- Douglas JE, Lin C, Mansfield CJ, Arayata CJ, Cowart BJ, Spielman AI, Adappa ND, Palmer JN, Cohen NA, Reed DR Tissue-Dependent Expression of Bitter Receptor TAS2R38 mRNA. Chem Senses. 1;44:33–40. 2019 doi: 10.1093/chemse/bjy066. [DOI] [PMC free article] [PubMed] [Google Scholar]
- Farmer SE, Eccles R. 2006. Chronic inferior turbinate enlargement and the implications for surgical intervention. Rhinology. 44:234–238. [PubMed] [Google Scholar]
- Finger TE, Böttger B, Hansen A, Anderson KT, Alimohammadi H, Silver WL. 2003. Solitary chemoreceptor cells in the nasal cavity serve as sentinels of respiration. Proc Natl Acad Sci U S A. 100:8981–8986. [DOI] [PMC free article] [PubMed] [Google Scholar]
- Finger TE, Kinnamon SC. 2011. Taste isn’t just for taste buds anymore. F1000 Biol Rep. 3:20. [DOI] [PMC free article] [PubMed] [Google Scholar]
- Fraczek M, Guzinski M, Morawska-Kochman M, Krecicki T. 2017. Investigation of sinonasal anatomy via low-dose multidetector CT examination in chronic rhinosinusitis patients with higher risk for perioperative complications. Eur Arch Otorhinolaryngol. 274:787–793. [DOI] [PMC free article] [PubMed] [Google Scholar]
- Gierahn TM, Wadsworth MH 2nd, Hughes TK, Bryson BD, Butler A, Satija R, Fortune S, Love JC, Shalek AK. 2017. Seq-Well: portable, low-cost RNA sequencing of single cells at high throughput. Nat Methods. 14:395–398. [DOI] [PMC free article] [PubMed] [Google Scholar]
- Gulbransen B, Silver W, Finger TE. 2008. Solitary chemoreceptor cell survival is independent of intact trigeminal innervation. J Comp Neurol. 508:62–71. [DOI] [PMC free article] [PubMed] [Google Scholar]
- Kamil A, Ghaffar O, Lavigne F, Taha R, Renzi PM, Hamid Q. 1998. Comparison of inflammatory cell profile and Th2 cytokine expression in the ethmoid sinuses, maxillary sinuses, and turbinates of atopic subjects with chronic sinusitis. Otolaryngol Head Neck Surg. 118:804–809. [DOI] [PubMed] [Google Scholar]
- Lee RJ, Cohen NA. 2013. The emerging role of the bitter taste receptor T2R38 in upper respiratory infection and chronic rhinosinusitis. Am J Rhinol Allergy. 27:283–286. [DOI] [PubMed] [Google Scholar]
- Lee RJ, Kofonow JM, Rosen PL, Siebert AP, Chen B, Doghramji L, Xiong G, Adappa ND, Palmer JN, Kennedy DW, et al. 2014. Bitter and sweet taste receptors regulate human upper respiratory innate immunity. J Clin Invest. 124:1393–1405. [DOI] [PMC free article] [PubMed] [Google Scholar]
- Lee RJ, Xiong G, Kofonow JM, Chen B, Lysenko A, Jiang P, Abraham V, Doghramji L, Adappa ND, Palmer JN, et al. 2012. T2R38 taste receptor polymorphisms underlie susceptibility to upper respiratory infection. J Clin Invest. 122:4145–4159. [DOI] [PMC free article] [PubMed] [Google Scholar]
- Lu P, Zhang CH, Lifshitz LM, ZhuGe R. 2017. Extraoral bitter taste receptors in health and disease. J Gen Physiol. 149:181–197. [DOI] [PMC free article] [PubMed] [Google Scholar]
- Maurer S, Wabnitz GH, Kahle NA, Stegmaier S, Prior B, Giese T, Gaida MM, Samstag Y, Hänsch GM. 2015. Tasting Pseudomonas aeruginosa biofilms: human neutrophils express the bitter receptor T2R38 as sensor for the quorum sensing molecule N-(3-Oxododecanoyl)-l-Homoserine Lactone. Front Immunol. 6:369. [DOI] [PMC free article] [PubMed] [Google Scholar]
- McInnes L, Healy J, Melville J. 2018. Umap: uniform manifold approximation and projection for dimension reduction. arXiv preprint arXiv.1802.03426, 2:18–19.
- Meltzer EO. 2016. Allergic rhinitis: burden of illness, quality of life, comorbidities, and control. Immunol Allergy Clin North Am. 36:235–248. [DOI] [PubMed] [Google Scholar]
- Meyerhof W, Batram C, Kuhn C, Brockhoff A, Chudoba E, Bufe B, Appendino G, Behrens M. 2010. The molecular receptive ranges of human TAS2R bitter taste receptors. Chem Senses. 35:157–170. [DOI] [PubMed] [Google Scholar]
- Ogura T, Krosnowski K, Zhang L, Bekkerman M, Lin W. 2010. Chemoreception regulates chemical access to mouse vomeronasal organ: role of solitary chemosensory cells. PLoS One. 5:e11924. [DOI] [PMC free article] [PubMed] [Google Scholar]
- Ordovas-Montanes J, Dwyer DF, Nyquist SK, Buchheit KM, Vukovic M, Deb C, Wadsworth MH 2nd, Hughes TK, Kazer SW, Yoshimoto E, et al. 2018. Allergic inflammatory memory in human respiratory epithelial progenitor cells. Nature. 560:649–654. [DOI] [PMC free article] [PubMed] [Google Scholar]
- Orlandi RR, Kingdom TT, Hwang PH, Smith TL, Alt JA, Baroody FM, Batra PS, Bernal-Sprekelsen M, Bhattacharyya N, Chandra RK, et al. 2016. International consensus statement on allergy and rhinology: rhinosinusitis. Int Forum Allergy Rhinol. 6(Suppl 1):S22–209. [DOI] [PubMed] [Google Scholar]
- Ostrowski LE, Blackburn K, Radde KM, Moyer MB, Schlatzer DM, Moseley A, Boucher RC. 2002. A proteomic analysis of human cilia: identification of novel components. Mol Cell Proteomics. 1:451–465. [DOI] [PubMed] [Google Scholar]
- Phipson B, Lee S, Majewski IJ, Alexander WS, Smyth GK. 2016. Robust hyperparameter estimation protects against hypervariable genes and improves power to detect differential expression. Ann Appl Stat. 10:946–963. [DOI] [PMC free article] [PubMed] [Google Scholar]
- Ramakrishnan VR. 2012. Surgical approaches: endoscopic. In: Chiu A, Ramakrishnan V, Suh J, editors. Sinonasal tumors. New Delhi (India): Jaypee Brothers Medical Publishers; p. 63. [Google Scholar]
- R Core Team (2019) R: A Language and Environment for Statistical Computing. R Foundation for Statistical Computing, Vienna. https://www.R-project.org
- Ritchie ME, Phipson B, Wu D, Hu Y, Law CW, Shi W, Smyth GK. 2015. Limma powers differential expression analyses for RNA-sequencing and microarray studies. Nucleic Acids Res. 43:e47. [DOI] [PMC free article] [PubMed] [Google Scholar]
- Rosenfeld RM, Andes D, Bhattacharyya N, Cheung D, Eisenberg S, Ganiats TG, Gelzer A, Hamilos D, Haydon RC 3rd, Hudgins PA, et al. 2007. Clinical practice guideline: adult sinusitis. Otolaryngol Head Neck Surg. 137:S1–S31. [DOI] [PubMed] [Google Scholar]
- Rosenfeld RM, Piccirillo JF, Chandrasekhar SS, Brook I, Ashok Kumar K, Kramper M, Orlandi RR, Palmer JN, Patel ZM, Peters A, et al. 2015. Clinical practice guideline (update): adult sinusitis. Otolaryngol Head Neck Surg. 152:S1–S39. [DOI] [PubMed] [Google Scholar]
- Saunders CJ, Reynolds SD, Finger TE. 2013. Chemosensory brush cells of the trachea. A stable population in a dynamic epithelium. Am J Respir Cell Mol Biol. 49:190–196. [DOI] [PMC free article] [PubMed] [Google Scholar]
- Schroeter JD, Kimbell JS, Asgharian B. 2006. Analysis of particle deposition in the turbinate and olfactory regions using a human nasal computational fluid dynamics model. J Aerosol Med. 19:301–313. [DOI] [PubMed] [Google Scholar]
- Shah AS, Ben-Shahar Y, Moninger TO, Kline JN, Welsh MJ. 2009. Motile cilia of human airway epithelia are chemosensory. Science. 325:1131–1134. [DOI] [PMC free article] [PubMed] [Google Scholar]
- Spielman AI, Pepino MY, Feldman R, Brand JG. 2010. Technique to collect fungiform (taste) papillae from human tongue. J Vis Exp. 18:42. [DOI] [PMC free article] [PubMed] [Google Scholar]
- Tizzano M, Cristofoletti M, Sbarbati A, Finger TE. 2011. Expression of taste receptors in solitary chemosensory cells of rodent airways. BMC Pulm Med. 11:3. [DOI] [PMC free article] [PubMed] [Google Scholar]
- Tizzano M, Gulbransen BD, Vandenbeuch A, Clapp TR, Herman JP, Sibhatu HM, Churchill ME, Silver WL, Kinnamon SC, Finger TE. 2010. Nasal chemosensory cells use bitter taste signaling to detect irritants and bacterial signals. Proc Natl Acad Sci USA. 107:3210–3215. [DOI] [PMC free article] [PubMed] [Google Scholar]
- Verbeurgt C, Veithen A, Carlot S, Tarabichi M, Dumont JE, Hassid S, Chatelain P. 2017. The human bitter taste receptor T2R38 is broadly tuned for bacterial compounds. PLoS One. 12:e0181302. [DOI] [PMC free article] [PubMed] [Google Scholar]
- Wang F, Flanagan J, Su N, Wang LC, Bui S, Nielson A, Wu X, Vo HT, Ma XJ, Luo Y. 2012. RNAscope: a novel in situ RNA analysis platform for formalin-fixed, paraffin-embedded tissues. J Mol Diagn. 14:22–29. [DOI] [PMC free article] [PubMed] [Google Scholar]
- Wong GT, Gannon KS, Margolskee RF. 1996. Transduction of bitter and sweet taste by gustducin. Nature. 381:796–800. [DOI] [PubMed] [Google Scholar]
- Yan CH, Hahn S, McMahon D, Bonislawski D, Kennedy DW, Adappa ND, Palmer JN, Jiang P, Lee RJ, Cohen NA. 2017. Nitric oxide production is stimulated by bitter taste receptors ubiquitously expressed in the sinonasal cavity. Am J Rhinol Allergy. 31:85–92. [DOI] [PMC free article] [PubMed] [Google Scholar]
Associated Data
This section collects any data citations, data availability statements, or supplementary materials included in this article.


