Abstract
Background
Recent efforts of gene expression profiling analyses recognized at least four different triple-negative breast cancer (TNBC) molecular subtypes. However, little is known regarding their tumor microenvironment (TME) heterogeneity.
Methods
Here, we investigated TME heterogeneity within each TNBC molecular subtype, including immune infiltrate localization and composition together with expression of targetable immune pathways, using publicly available transcriptomic and genomic datasets from a large TNBC series totaling 1512 samples. Associations between molecular subtypes and specific features were assessed using logistic regression models. All statistical tests were two-sided.
Results
We demonstrated that each TNBC molecular subtype exhibits distinct TME profiles associated with specific immune, vascularization, stroma, and metabolism biological processes together with specific immune composition and localization. The immunomodulatory subtype was associated with the highest expression of adaptive immune-related gene signatures and a fully inflamed spatial pattern appearing to be the optimal candidate for immune check point inhibitors. In contrast, most mesenchymal stem-like and luminal androgen receptor tumors showed an immunosuppressive phenotype as witnessed by high expression levels of stromal signatures. Basal-like, luminal androgen receptor, and mesenchymal subtypes exhibited an immune cold phenotype associated with stromal and metabolism TME signatures and enriched in margin-restricted spatial pattern. Tumors with high chromosomal instability and copy number loss in the chromosome 5q and 15q regions, including genomic loss of major histocompatibility complex related genes, showed reduced cytotoxic activity as a plausible immune escape mechanism.
Conclusions
Our results demonstrate that each TNBC subtype is associated with specific TME profiles, setting the ground for a rationale tailoring of immunotherapy in TNBC patients.
Triple-negative breast cancer (TNBC), representing 15%–20% of all breast cancers (BCs), has the worst outcome among BC subtypes and is known to be a heterogeneous disease at the clinical, biological, and genomic levels. Gene expression analyses have led to the identification of several molecular subtypes with distinct mutational profiles, genomic alterations, and biological processes, including basal-like (BL), immunomodulatory (IM), luminal androgen receptor (LAR), mesenchymal (M), and mesenchymal stem-like (MSL) (1–4). TNBC treatment remains challenging because therapeutic options are essentially limited to chemotherapy (5).
Cancer development, progression, and treatment resistance are known to be influenced by genetic and epigenetic alterations as well as cross talk between tumor cells and their microenvironment. The tumor microenvironment (TME) is composed of multiple cell types, including fibroblasts, adipose and immune-inflammatory cells, and blood and lymphatic vascular networks (6). TNBC subtype is associated with the highest tumor-infiltrating lymphocyte (TIL) levels. High TILs were associated with better clinical outcome and response to neoadjuvant chemotherapy (7–9).
Several agents targeting TME immune components by inducing or enhancing antitumor immunity are under development (10). Cancer immunotherapy immune checkpoint blockers (ICB) have changed the treatment paradigm in a variety of neoplastic diseases (11). In BC, immunotherapy with ICB has demonstrated clinical activity and survival benefit, mostly in advanced TNBC and HER2+ subtype (12–14). However, a benefit to ICB was observed in only a minority of BC patients, highlighting the need to better elucidate the mechanisms of treatment resistance allowing us to identify patients who will benefit the most from immunotherapy.
Methods
Additional information on samples and methods used in this study is provided in the Supplementary Methods (available online).
Datasets
Bioinformatic analyses were performed on four publicly available datasets assembled as cohorts A, B, and C (Supplementary Figure 1; Supplementary Tables 1 and 2, available online). Cohort A was composed of 555 TNBC samples from the Molecular Taxonomy of Breast Cancer International Consortium (METABRIC) (15) and The Cancer Genome Atlas Consortium (TCGA) (16) with available gene expression, somatic mutation profiles, segmented copy number, and overall survival (OS) data. Cohort B was composed of 360 TNBC samples from patients with Asian ancestry, retrieved from Jiang and colleagues (3), including gene expression, somatic mutation, and whole-genome copy number data. The validation cohort C was composed of 597 TNBC samples with gene expression data retrieved from the Gene Expression Omnibus platform (GSE31519) together with relapse-free survival data (17).
TNBC Molecular Subtyping
Three different classifications were used to define TNBC molecular subtypes according to the recent publications by Bareche et al. (2), Jiang et al. (3), and Burstein et al. (4).
TME Gene Signature Analysis
Ten gene signatures related to the TME were used for this analysis (Supplementary Table 3, available online): two immune related [reflecting “cytolytic activity” (18) and “lymphocytes” (19)], three vascularization related [reflecting “angiogenesis” (2), “hypoxia” (20), and “lymphangiogenesis” (21)], three stroma related [reflecting “cancer associated fibroblast (CAFs)” (22) and “stroma” (23)], and three metabolism related [reflecting “glycolysis” (24), “lipid metabolism” (25), and a “pentose phosphate pathway” (26)]. The “cytolytic activity,” “lymphocyte,” and “stroma” signature scores were calculated as a weighted sum of genes’ normalized expression, with gene-specific weights equal to +1 or −1, depending on the association’s direction with the gene expression phenotype. The other signature scores were calculated as an unweighted mean of the genes’ normalized expression. Gene signature scores were then scaled so that the 2.5% and 97.5% quantiles equaled −1 and +1 (27).
Tumor Immune Microenvironment (TIME) Molecular Subtype
The TIME molecular subtypes were assigned to each tumor sample, as described by Gruosso et al. (28).
Computational Immune Composition Quantification
Gene signatures allowing us to identify 16 distinct immune cell types were obtained from Tamborero et al. (2018) (29). Gene set variation analysis (GSVA) was performed to compute the 16 immune cell type scores, using the gsva (30) R package with default parameters. The 16 GSVA signature scores were then scaled so that the 2.5% and 97.5% quantiles equaled −1 and +1, respectively.
Statistical Analysis
Associations between TME gene signatures, GSVA immune cell types, and immune gene targets, used as continuous variables, together with TNBC molecular and TIME subtypes, used as categorical variables, were evaluated using the logistic regression model with P values computed from parametric Mann-Whitney U tests.
Spearman correlation analysis was performed between chromosomal instability (CIN) scores and gene expression. Genes with Spearman coefficient rho greater than 0.30 or less than −0.30 and P values corrected for multiple testing (false discovery rate [FDR]) less than .05 were considered statistically significant for the Gene Ontology (GO) analysis. GO enrichment was performed using GO.db (version 3.5.0) and limma (version 3.34.9) R packages.
Associations between TME gene signatures and GSVA immune cell types with OS were evaluated using Cox proportional hazards regression univariate and multivariable models [coxph function, R package “genefu” (27), version 2.11.2] in cohort A and with relapse-free survival using Cox proportional hazards regression model in cohort C. Multivariable analyses were performed adjusting for the dataset (TCGA vs METABRIC), nodal status (0 vs 1), age (≤40 years vs >40 years), tumor size (≤2 cm vs >2 cm), and histological grade (I or II vs III). Survival data from cohort B were not used because of a relatively low relapse rate (only 49 of 360 TNBC patients relapsed with a median follow-up of 3.8 years). Cox proportional hazards assumptions of proportionality were checked and verified using the Schoenfeld residual test in cohorts A and B.
All statistical analyses were performed using R (version 3.4.4). P values were corrected for multiple testing using the Benjamini-Hochberg FDR. Statistical tests were considered statistically significant if the FDR was less than .05. All tests were two-sided, and P less than .05 was considered statistically significant.
Results
TNBC Molecular Subtype Association With Distinct TME and Clinical Outcome
To evaluate whether TNBC molecular subtypes as defined by Bareche et al. (2) exhibit distinct TME patterns, we interrogated several specific gene expression signatures capturing different biological features or cellular components, including immune response (18,19), vascularization (2,20,21), stroma compartment (22,23), and metabolic processes (24–26), using cohorts A and B (Figure 1A; Supplementary Tables 3 and 4, available online).
Figure 1.
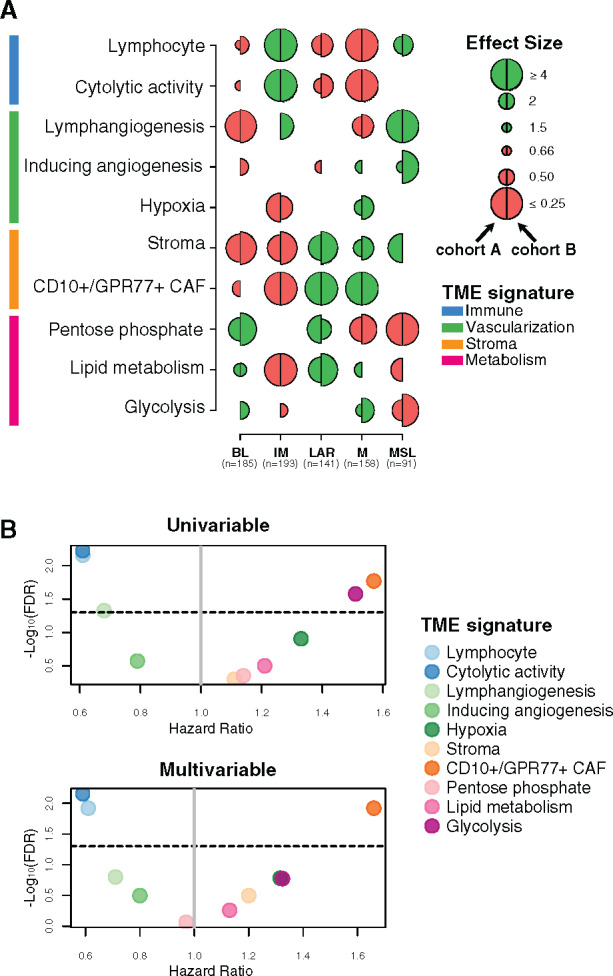
Tumor microenvironment (TME) features associated with triple-negative breast cancer (TNBC) molecular subtypes and overall survival (OS). A) Associations between TME gene expression signatures and TNBC molecular subtypes. A logistic regression model was used to evaluate associations between each specific gene signature and each TNBC molecular subtype. P values were obtained from parametric Mann-Whitney U tests and corrected for multi testing. Only statistically significant associations are shown (false discovery rate [FDR] ≤ .05), with negative and positive associations represented in red and green, respectively. The left half-circle and the right half-circle represent cohorts A and B, respectively. B) Associations between TME gene signatures and 10-year OS, using univariate and multivariable Cox regression models, adjusted for the dataset (The Cancer Genome Atlas Consortium vs Molecular Taxonomy of Breast Cancer International Consortium), patient age (≤40 y vs >40 y), nodal status (positive vs negative), tumor size (<2 cm vs ≥2 cm), and histological grade (I/II vs III). The x- and y-axis represent the hazard ratio and the −log10 (FDR), respectively. The horizontal bold dotted line represents the FDR threshold at .05 for statistically significant associations. BL = Basal-like; CAF = Cancer-associated fibroblast; IM = Immunomodulatory; LAR = Luminal androgen receptor; M = Mesenchymal; MSL = Mesenchymal stem-like.
As illustrated in Figure 1A, BL tumors were enriched with metabolism processes together with low levels of stroma and lymphangiogenesis signatures, whereas the IM subtype was predominantly associated with tumor immune response signatures. LAR and M subtypes showed similar TME patterns with high stroma and metabolism expression levels together with low immune signature expression levels. Finally, MSL was mainly associated with high levels of lymphangiogenesis and low levels of metabolism processes.
We then investigated whether different TME patterns were associated with a distinct clinical outcome. As shown in Figure 1B, the two immune-related signatures were associated with a better OS, whereas the CD10+/GPR77+ CAF signature showed an association with poor outcome. These associations were statistically significant in both the univariate and multivariable analyses (Figure 1B; Supplementary Table 5, available online). Altogether, our results highlight that each TNBC molecular subtype presents specific TME patterns associated with distinct clinical outcome.
Spatial Immune Organization Within TNBC Molecular Subtypes
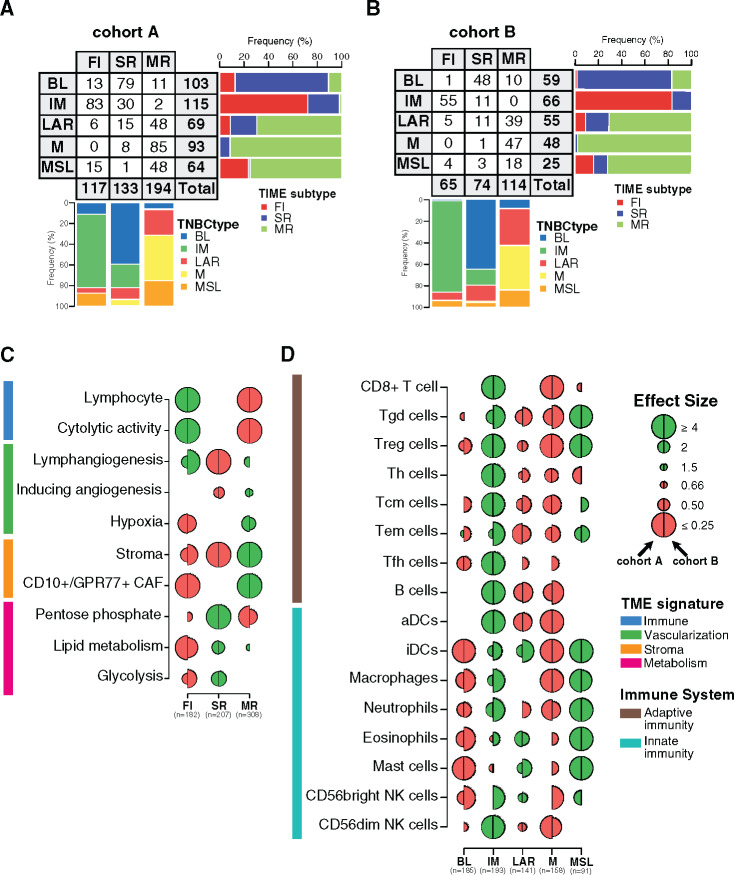
Immune-related gene signatures were derived from bulk tumor gene expression, ignoring immune cell spatial distribution. To investigate the spatial heterogeneity of tumor immune infiltration within each of the TNBC molecular subtypes, we first applied to cohorts A and B the recently reported TIME classification to group tumors into three patterns according to CD8+ TIL spatial distribution: fully inflamed (FI), stroma restricted (SR), and margin restricted (MR) subtypes (28). We then examined whether TNBC molecular subtypes present specific TIL localization according to TIME classification. As illustrated in Figure 2, A and B, IM tumors showed the highest prevalence of FI patterns, which were absent in the M subtype. M, MSL, and LAR molecular subtypes presented the highest levels of the MR pattern, whereas the BL subtype was predominantly associated with the SR pattern (28).
Figure 2.
Characterization of the spatial immune landscape and immune composition in triple-negative breast cancer (TNBC) molecular subtypes. Associations between TNBC molecular subtypes and tumor immune microenvironment (TIME) subtypes in cohorts A (A) and B (B). C) Associations between tumor microenvironment (TME) gene expression signatures and TIME subtypes. Logistic regression model was used to evaluate the association between each feature and each subtype. D) Associations between 16 immune cell subsets scores with TNBC molecular subtypes. A logistic regression model was used to evaluate associations between each immune cell population and each tumor TNBC molecular subtype. P values were obtained from parametric Mann-Whitney U tests and corrected for multi testing. Only statistically significant associations are shown (FDR ≤ .05), with negative and positive associations represented in red and green, respectively. The left half-circle and the right half-circle represent cohorts A and B, respectively. aDC = Activated dendritic cells; B cell = B cell lymphocytes; BL = Basal-like; CAF = Cancer-associated fibroblast; FI = Fully-inflammed; iDC = Inactivated dendritic cells; IM = Immunomodulatory; LAR = Luminal androgen receptor; M = Mesenchymal; MR = Margin restricted; MSL = Mesenchymal stem-like; NK = Natural killer cells; SR = Stroma restricted; Tcm = Central memory T cells; Tem = Effector memory T cells; Tfh = Follicular helper T cells; Th = Helper T cells; Treg = Regulatory T cells.
To investigate whether this classification reliably reflects TIL localization as assessed by a pathologist, we reviewed 161 hematoxylin–eosin (H&E) slides available from the TCGA series and compared TIL localization with TIME molecular classification. Interestingly, we observed a statistically significant concordance of 67% with a Cohen’s κ coefficient value of 0.48 (P less than .001) (Supplementary Figure 2A, available online). Furthermore, the pathologist classification showed similar results as found using the TIME molecular classification (Supplementary Figure 2, B–D, available online), thus demonstrating that the TIME classification faithfully captures TIL spatial localization.
TIME classification was also associated with distinct expression of TME signatures (Figure 2C; Supplementary Table 6, available online). FI tumors were positively and negatively associated with immune-related and stroma- and metabolism-related signatures, respectively, in contrast to MR tumors showing the opposite TME features. Finally, SR tumors were mainly associated with metabolism-related signatures.
We next investigated whether TIME classification was associated with distinct clinic-pathological features and clinical outcome. FI tumors were statistically significantly enriched for medullary carcinoma and smaller tumors, SR tumors were associated with younger patients, and MR tumors were enriched for low-grade tumors (Supplementary Table 2, available online). Furthermore, in line with Gruosso et al., TIME patterns were statistically significantly associated with 10-year OS (log-rank test, P = .048), and patients with FI tumors exhibited the best prognosis (Supplementary Figure 2E, available online). These results highlight that each TNBC molecular subtype is associated with distinct immune localization together with specific TME processes and clinic-pathological characteristics.
Immune Infiltrate Composition of TNBC Molecular Subtypes
To gain more insight into the relative composition of the immune infiltrate between the different TNBC molecular subtypes, we used a compendium of mRNA gene signatures capturing 16 immune cell types depicting innate and adaptive immune responses (29). IM subtype was mainly enriched with adaptive immune cells as compared with MSL mainly composed of innate immune cells (Figure 2D; Supplementary Table 7, available online). LAR subtype was enriched with innate immune cells although to a lesser extent as compared with MSL. Of note, BL and M subtypes were characterized by poor adaptive and innate immune responses. Overall, our results show a statistically significant heterogeneity in the immune cell composition characterizing each TNBC molecular subtype.
Association of Tumor Genomic and TME Features With Cytotoxic Immune Response
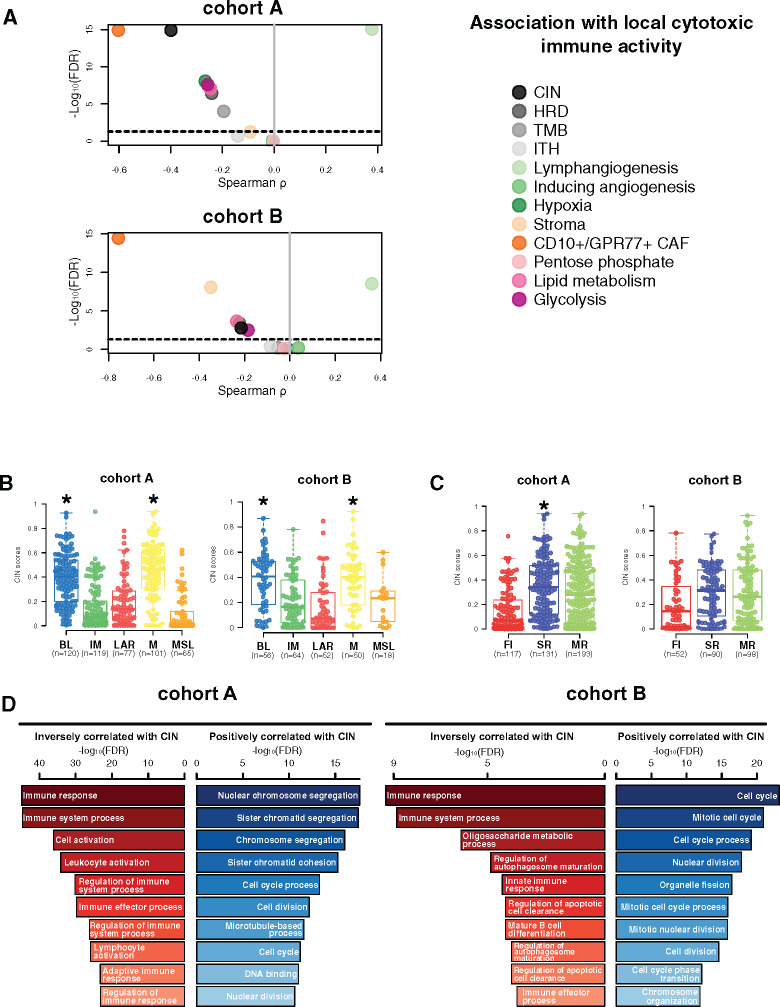
We next aimed to determine the genomic and TME features associated with local cytotoxic immune activity (CYT), evaluated through the geometric mean expression of GZMA and PRF1 genes (18), including CIN, intra tumor heterogeneity, homologous recombination deficiency scores, tumor mutational burden, and several TME signatures as previously described. High CYT was statistically significantly associated with high expression levels of lymphangiogenesis signature, whereas reduced CYT was correlated with high levels of CD10+/GPR77+ CAF and high CIN as well as to a lesser extent with hypoxia, glycolysis, lipid metabolism, and homologous recombination deficiency and tumor mutational burden (Figure 3A).
Figure 3.
Chromosomal instability association with immune escape. A) Associations between tumor microenvironment (TME) and tumor-specific features with local cytotoxic immune activity (CYT) in cohorts A and B. Spearman correlation was used to evaluate associations between each TME and tumor-specific gene expression signature with the CYT gene signature. The x- and y-axis represent Spearman ρ and the −log10(FDR), respectively. The horizontal bold dotted line represents the FDR threshold at 0.05 for statistically significant association. Chromosomal instability (CIN) distribution within each triple-negative breast cancer (TNBC) molecular (B) and tumor immune microenvironment (TIME) (C) subtype in cohorts A and B. Differences between each subtype and the rest of the cohort were assessed using a two-sided Mann-Whitney U test. A black star was displayed when statistically significant CIN score enrichment was observed within a specific TNBC and TIME subtype. D) Gene ontology analyses of genes with mRNA expression statistically significant (FDR ≤ .05) negatively (left, in red) and positively (right, in blue) correlated with CIN scores (Spearman correlation) in cohorts A and B. BL = Basal-like; CAF = Cancer-associated fibroblast; CIN = Chromosomal instability; FI = Fully-inflammed; HRD = Homologous recombination deficiency; IM = Immunomodulatory; ITH = Intra-tumoral heterogeneity; LAR = Luminal androgen receptor; M = Mesenchymal; MR = Margin restricted; MSL = Mesenchymal stem-like; SR = Stroma restricted; TMB = Tumor mutational burden.
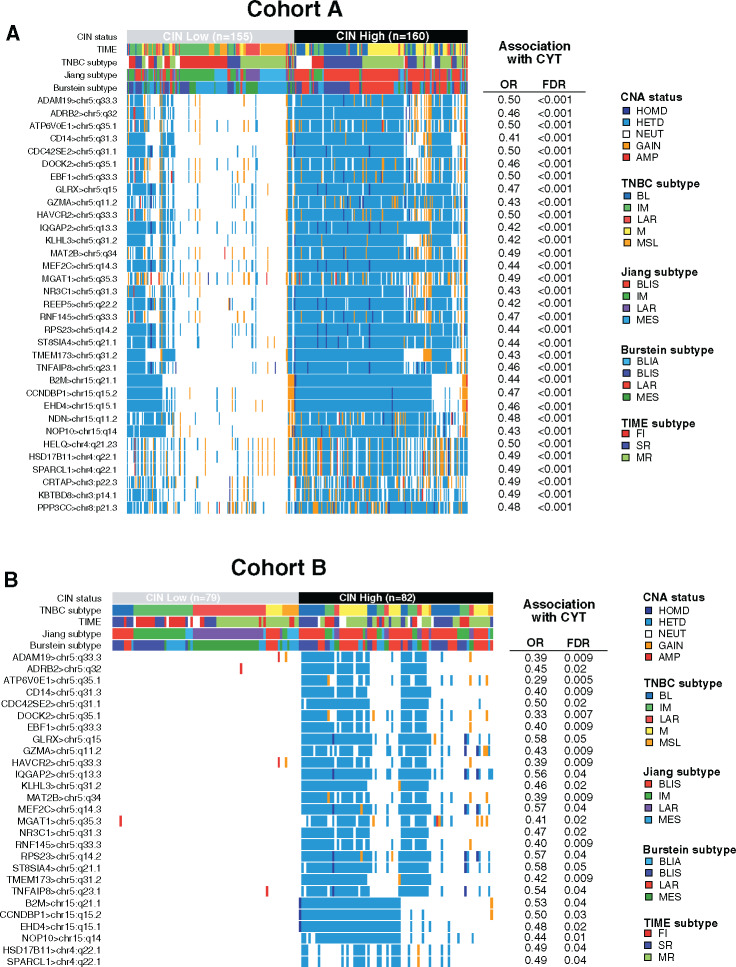
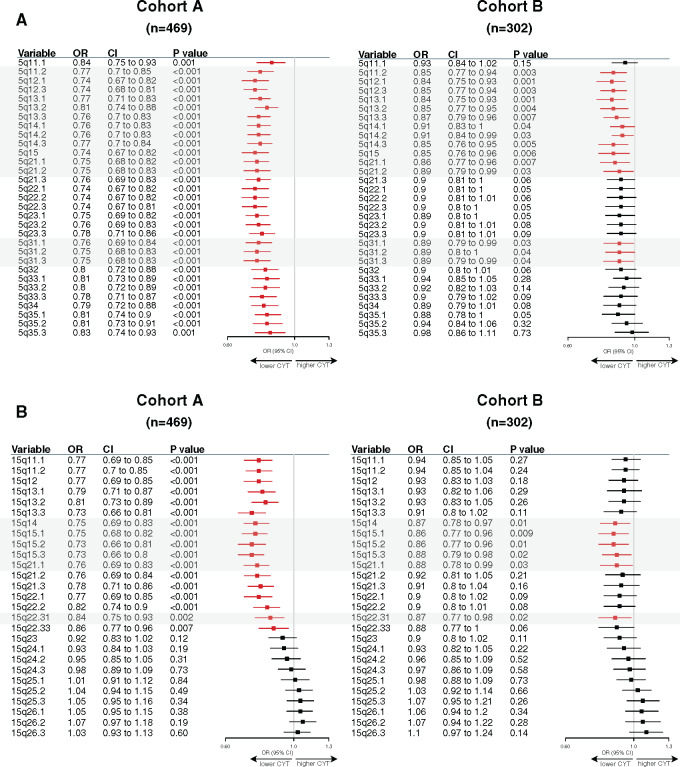
Of note, higher CIN scores were observed in the BL and M subtypes as well as in the SR tumors (Figure 3B). Gene ontology analysis using the Spearman correlation test (|Spearman ρ| ≥ 0.30) showed that CIN scores were positively correlated with genes involved in cell cycle processes and inversely correlated with genes involved in immune response. A total 73.2% (361 of 493) of these inversely correlated genes also showed higher copy number losses in tumors with high CIN scores (Figure 3C; Supplementary Table 8, available online). Of interest, 33 of these genes were associated with reduced CYT levels, including B2M and TMEM173 (STING) genes, both involved in major histocompatibility complex (MHC) class I and II complex molecules and required for tumor antigen presentation; nearly all of these genes are located in chromosomes 5q and 15q (Figure 4A). We further showed that among the 23 000 genes with copy number alterations, 84.1% of the genes associated with reduced CYT were located in the chromosome 5q and 15q regions, independent from CIN status (Supplementary Table 9, available online). Of note, CIN and the chromosome 5q region remained statistically significantly associated with reduced CYT in a multivariable model, suggesting that both CIN and 5q region are independently associated with CYT (Supplementary Figure 3, available online). Finally, we identified two regions on chromosome 5q (5q11.2–5q21.2 and 5q.31.1–5q31.3) and two regions on chromosome 15q (15q14–15q21.1 and 15q22.31) statistically significantly associated with decreased CYT levels (Figure 5). Of great interest, similar findings were observed in cohort B, demonstrating the reproducibility of our results (Figures 3–5; Supplementary Figure 3; Supplementary Tables 9 and 10, available online). Altogether, these data highlight the importance of CIN as well as the chromosome 5q and 15q region lossess as potential immune escape mechanisms in TNBC tumors.
Figure 4.
Loss of chromosome 5q and 15q regions is associated with reduced cytotoxic immune activity (CYT) levels. A) Copy number aberration (CNA) status distribution according to the three different triple-negative breast cancer (TNBC) classifications of the 33 genes associated with high CNA loss and low CYT scores in chromosomal instability (CIN) high (CIN ≥ 0.38, third tertile) and CIN low (CIN ≤ 0.08, first tertile) tumors in cohort A. B) CNA status distribution of 27 of these 33 genes validated in cohort B associated with high CNA loss and low CYT scores in CIN high (CIN ≥ 0.39, third tertile) and CIN low (CIN ≤ 0.11, first tertile) tumors. Differences in CNA status between both CIN subgroups were assessed using a two-sided Fisher exact test. P values were adjusted for multiple testing using the Benjamini-Hochberg procedure. A logistic regression model was used to evaluate the association between each gene CNA loss with CYT activity. P values were obtained from parametric Mann-Whitney U tests and corrected for multi testing.
Figure 5.
Specific 5q and 15q region losses associated with reduced cytotoxic immune activity (CYT). Associations between chromosome 5q (A) and 15q (B) specific region logR with cytotoxic activity using a linear regression model. Forestplots displaying hazard ratios and 95% confidence intervals (CI). Horizontal bars represent the 95% CI of odds ratios (OR). Variables with statistically significant effect (P ≤ .05) are shown in red. Gray boxes highlight common regions significantly associated in both cohorts.
Association of Targetable Immune Marker Expression With TNBC Molecular Subtypes
We next evaluated the expression of key immune targets, including coinhibitory as well as costimulatory ligands and receptors, chemokines, and enzymes, to guide immune therapeutic strategies according to each TNBC and TIME subtype (Supplementary Table 11, available online).
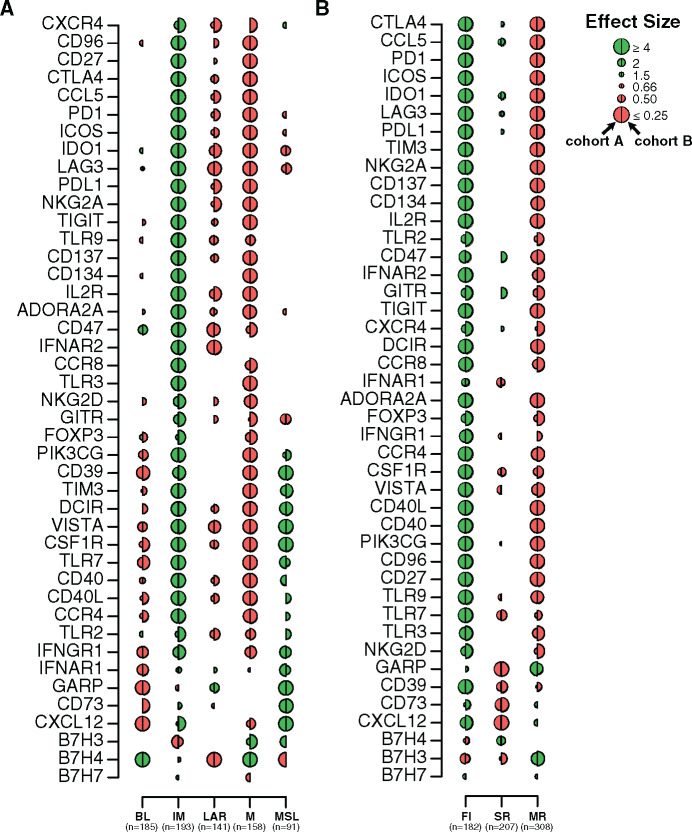
Our analyses showed that most of the evaluated immune targets were highly expressed in the IM and to a lesser extent in the MSL subtype (Figure 6A; Supplementary Table 12, available online) in contrast to the M, LAR, and BL subtypes, which showed low immune target expression. Notably, BL tumors were characterized by an immunosuppressed TME, including association with IM proteins involved in negative immune regulation of T cells (B7-H4) and myeloid cells (CD47). GARP was the only immune target observed in the LAR subtype and was strongly enriched in MSL tumors.
Figure 6.
Therapeutic immune targets according to triple-negative breast cancer (TNBC) molecular and tumor immune microenvironment (TIME) subtypes. Associations of 44 immune genes corresponding to immunomodulatory targets with TNBC molecular (A) and TIME (B) subtypes. A logistic regression model was used to evaluate associations between each gene expression with each subtype. P values were obtained from parametric Mann-Whitney U tests and corrected for multi testing. Only statistically significant associations are shown (FDR ≤ .05), with negative and positive associations represented in red and green, respectively. The left half-circle and the right half-circle represent cohorts A and B, respectively. BL = Basal-like; FI = Fully-inflammed; IM = Immunomodulatory; LAR = Luminal androgen receptor; M = Mesenchymal; MR = Margin restricted; MSL = Mesenchymal stem-like; SR = Stroma restricted.
Other molecules from immune-negative regulation pathways were associated with MSL tumors, including CD39 and CD73 ectoenzymes, responsible for the generation of immunosuppressive adenosine in the TME (31). In contrast to MSL tumors, IM tumors were characterized by a more balanced pattern of immune targets with the association of immune stimulatory receptors such as 4-1-BB, OX40, and IL2-R and ligands such as ICOS and CD40L as well as molecules involved in the dysfunction of proinflammatory status as inhibitory receptors (TIGIT, PD-1, CTLA4). Mesenchymal tumors did not appear immune reactive, with a negative association for most tested immune targets except for two immune inhibitory receptors, B7-H3 and B7-H4, also expressed by tumor cells and involved in the regulation of cancer initiation and progression (32).
Finally, we evaluated the expression of immune targets according to TIME subtypes (Figure 6B; Supplementary Table 13, available online). Almost all immune targets were highly expressed in the FI subtype. MR tumors were enriched in B7-H3 and GARP expression yet were negatively associated with most other targets, reflecting the immunosuppression of these tumors. Finally, SR tumors were characterized by a low expression of most evaluated immune targets. Overall, these analyses show that different immune targets are differentially expressed across TNBC and TIME subtypes, allowing a rationale tailoring of immunotherapy in TNBC patients.
Validation of the TME Heterogeneity Within TNBC Molecular Subtypes
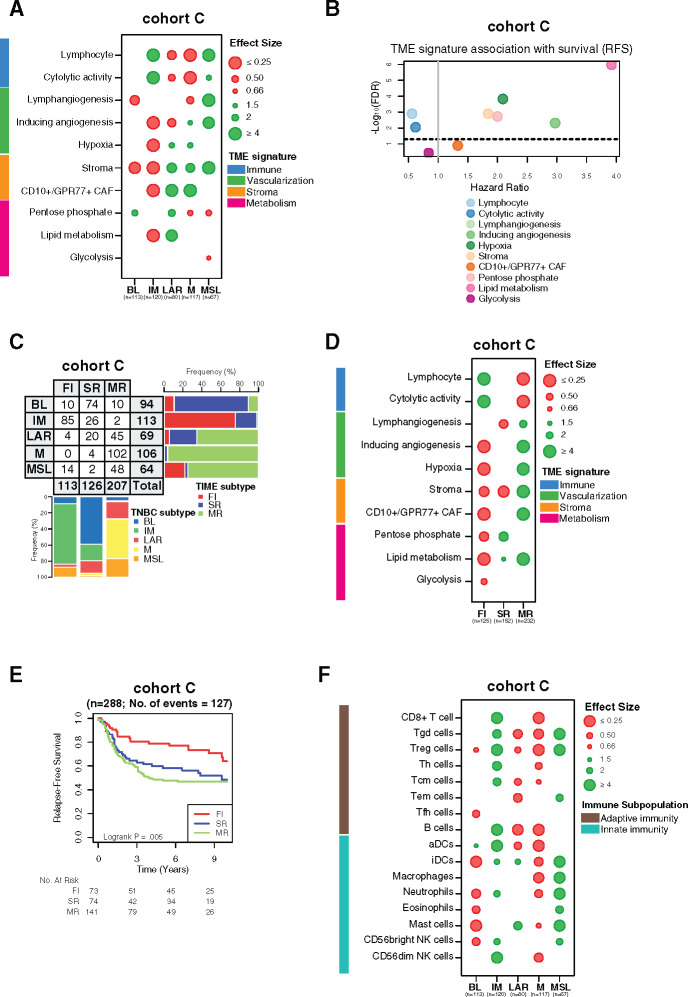
The robustness of our findings was further evaluated using an independent cohort of 497 TNBC samples with available clinical and transcriptomic data (cohort C). Similar TME patterns were found for each TNBC subtype, with immune signatures being statistically significantly associated with better relapse-free survival (Figure 7, A and B; Supplementary Tables 4 and 6, available online). The same distribution of the TNBC molecular subtypes according to TIME classification was observed between all cohorts (Figure 7C). In line with our previous results, the TIME classification was also statistically significantly associated with distinct TME processes and relapse-free survival (Figure 7, D and E; Supplementary Table 5, available online). The IM subtype was mainly enriched with adaptive immune cells compared with MSL, which was mainly composed of innate immune cells (Figure 7F). Finally, IM and FI subtypes were positively associated with almost all evaluated immune targets, in contrast to MSL and MR subtypes, which were more associated with a protumoral TME, overall validating our results (Supplementary Figure 4; Supplementary Tables 12 and 13, available online). Finally, TME heterogeneity was also explored in all three cohorts using two other TNBC molecular classifications reported by Burstein et al. (4) and Jiang et al. (3), showing similar TME profiles and clinical outcome associations (Supplementary Figures 5 and 6, available online).
Figure 7.
Validation of tumor microenvironment (TME) heterogeneity within triple-negative breast cancer (TNBC) molecular subtypes. A) Associations between TME gene expression signatures and TNBC molecular subtypes within cohort C. A logistic regression model was used to evaluate associations between each specific gene signature and each TNBC molecular subtype. P values were obtained from parametric Mann-Whitney U tests and corrected for multi testing. Only statistically significant associations are shown (FDR ≤ .05), with negative and positive associations represented in red and green, respectively. B) Associations between TME gene signatures and relapse-free survival (RFS) using a cox regression model. The x- and y-axis represent hazard ratio and the −log10 (false discovery rate [FDR]), respectively. The horizontal bold dotted line represents the FDR threshold at .05 for statistically significant associations. C) Associations between TNBC molecular subtypes and tumor immune microenvironment (TIME) subtypes in cohort C. D) Associations between TME gene expression signatures with TIME subtypes in cohort C. A logistic regression model was used to evaluate associations between each specific gene signature and each TNBC molecular subtype. P values were obtained from parametric Mann-Whitney U tests and corrected for multi testing. Only statistically significant associations are shown (FDR ≤ 0.05), with negative and positive associations represented in red and green, respectively. (E) Kaplan-meier analysis of relapse-free survival of cohort C stratified according to TIME subtypes (fully inflamed [FI] vs stroma restricted [SR] vs margin restricted [MR]). F) Associations between 16 immune cell population scores with TNBC molecular subtypes in cohort C. A logistic regression model was used to evaluate associations between each immune cell population and each tumor subtype. P values were obtained from parametric Mann-Whitney U tests and corrected for multi testing. Only statistically significant associations are shown (FDR ≤ .05), with negative and positive associations represented in red and green, respectively. BL = Basal-like; CAF = Cancer-associated fibroblast; FI = Fully-inflammed; IM = Immunomodulatory; LAR = Luminal androgen receptor; M = Mesenchymal; MR = Margin restricted; MSL = Mesenchymal stem-like; SR = Stroma restricted.
Discussion
TILs and immune signatures were previously reported to be associated with better survival and response to treatment in TNBC (7–9); however, it is not clear which immune cell types or which spatial organizations drive clinical outcome. This is the largest analysis, exploiting 1512 TNBC samples from four large and independent public datasets, demonstrating the extent of TME heterogeneity that characterizes each TNBC molecular subtype beyond the genomic and transcriptomic diversity (2,3).
We also explored for the first time, to our knowledge, the TIME classification integrating immune cell spatial localization (28). We showed that IM and FI subtypes are associated with high expression of most evaluated immune targets (eg, immune checkpoint receptors) and adaptive immune-related cell populations, suggesting that these “immune hot” tumors are the best potential candidates for ICB. In contrast, most MSL and LAR tumors showed an immunosuppressive and protumorigenic phenotype with high expression levels of stromal signatures known to promote an immunosuppressed TME, suggesting that they are potential candidates for treatment targeting regulatory T cells or immunosuppressive pathways such as the adenosine pathway. The M and MR subtypes could be considered as “immune cold” tumors with low expression of different immune cell populations and downregulation of most immune targets.
Tumor metabolic reprogramming is a known cancer hallmark characterized by an adaptive mechanism promoting tumor development in a hostile TME. Our analysis revealed an activation of the metabolic pathways in the “immune cold” BL, LAR, and M molecular subtypes as well as in the SR subtype, pointing out the tight interplay between tumor metabolism and TME. Targeting the metabolic pathways therefore appears as a promising anticancer strategy in these specific TNBC subtypes.
We are the first, to our knowledge, to demonstrate that TIME classification faithfully reflects TIL localization, as witnessed by a good 67% concordance rate between TIL localization assessed by pathologists and the gene expression-based TIME classification. Discordant cases could notably be explained using H&E instead of CD8+ IHC-stained slides to assess the TIL localization. Discordant cases could notably be explained by the use of H&E instead of CD8+ IHC-stained slides to assess the TIL localization and/or the exclusion by the pathologist of highly infiltrated necrotic areas captured by gene expression analysis from bulk tumors. Indeed, about 25% of discordant cases showed an immune infiltration in either necrotic areas or normal adjacent tissue. Our findings suggest that TIME classification should be evaluated to discriminate responders from nonresponders to immunotherapy as a complementary biomarker to TIL assessment (14,33).
Furthermore, our analysis provides novel evidence of potential mechanisms of resistance to ICB. We have notably shown that tumors with high CIN and chromosomal 5q and 15q region loss, including TMEM173 (5q31.2; STING) and B2M (15q21.1) genes leading to the downregulation of several MHC class I and II genes, were independently associated with reduced immune cytotoxicity. Downregulation of MHC class I molecules by tumor cells decreases tumor antigenicity and could be an immune escape mechanism to avoid recognition and tumor cell death by the immune system (10). In some cases, the absence of MHC class I on tumor cells could explain the low tumor immune infiltration and the lack of response to ICB (34). Inducing MHC recovery to overcome the MHC loss using oncolytic viruses or demethylating agents as well as NK cell therapy activated by the loss of MHC-I on tumors cells therefore appear as potential treatment options for these tumors (35–37). Chromosomal 5q region loss also includes GZMA encoding for proteins involved in cytotoxic activity of immune cells (5q11.2). Although our bulk sequencing analyses do not allow us to discriminate between tumor and immune cell expression, we considered that this loss does not interfere with our findings because it is mainly expressed by immune cells (38,39).
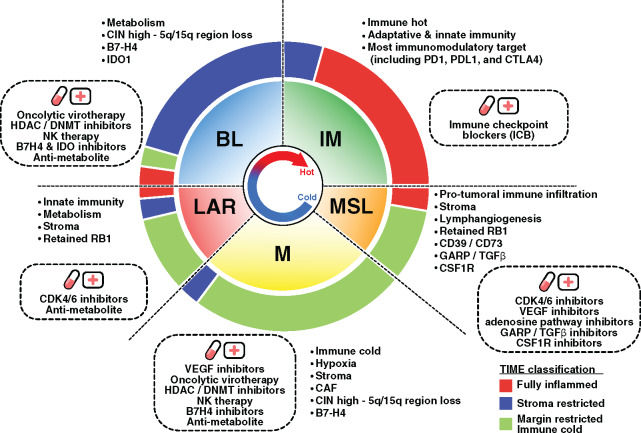
The recent results from the first phase III trial evaluating anti-PD-L1 therapy in combination with chemotherapy demonstrated a survival benefit in metastatic TNBC patients (13). Of note, the survival benefit was observed in only the PD-L1+ subgroup. Considering our results, the identification of novel predictive biomarkers could allow us to determine the most appropriate immunotherapeutic strategy to optimally enhance antitumor immune responses. Hence, combinatorial approaches targeting diverse immune escape mechanisms may potentially improve the response rate and clinical benefit to ICB (Figure 8).
Figure 8.
Response to immunotherapy through targeting triple-negative breast cancer (TNBC) tumor microenvironment and genomic heterogeneity. The inner pie chart represents the relative proportion of the TNBC molecular subtypes. The outer pie chart represents the relative proportion of the tumor immune microenvironment (TIME) subtypes within each TNBC molecular subtype. Observed TNBC subtype-specific aberrations are listed in each quadrant with the corresponding rational therapeutic strategies presented in the dotted box. BL = Basal-like; DNMT = DNA methyltransferase; HDAC = Histone deacetylase; IM = Immunomodulatory; LAR = Luminal androgen receptor; M = Mesenchymal; MSL = Mesenchymal stem-like.
To conclude, despite being limited by its retrospective nature and restricted to bulk tumor sequencing data analysis, this study allowed us to gain more insight into the complex interactions between tumor cells and their microenvironment, particular immune cells. However, prospective validation of our findings is warranted before their clinical implementation. New technologies such as single-cell sequencing and spatial transcriptomics (40,41) may further allow us to investigate the extent of tumor heterogeneity that characterizes TNBC at an unprecedented level.
Funding
YB and CS are supported by the Télévie and the Fonds National de la Recherche Scientifique (F.R.S.-FNRS). LB is supported by “Les Amis de l’Institut Bordet” foundation. DV is supported by the Walloon region under the WALInnov program. This study was supported by a grant from Breast Cancer Research Foundation (BCRF) and Les Amis de Bordet. No grant numbers applied.
Notes
Affiliations of authors: Breast Cancer Translational Research Laboratory J.-C. Heuson, Institut Jules Bordet, Université Libre de Bruxelles, Brussels, Belgium (YB, LB, EG, DV, FD, CD, FR, CS); Department of Oncology, McGill University, Montreal, Canada (TG, MP); Pathology Department, Institut Jules Bordet, Université Libre de Bruxelles, Brussels, Belgium (DL); Centre de Recherche du Centre Hospitalier de l’Université de Montréal, Québec, Canada (JS). Forbius, 750 Boul St-Laurent, Montréal, Quebec, Canada (TG). Laboratory for Translational Breast Cancer Research, Department of Oncology, KU Leuven, Herestraat 49, box 818, 3000 Leuven, Belgium (CD).
The funding sources had no role in the design and conduct of the study; collection, management, analysis, and interpretation of the data; preparation, review, or approval of the manuscript; and decision to submit the manuscript for publication. JS is a permanent member of the Scientific Advisory Board and holds stocks of Surface Oncology. The other authors declare no potential conflicts of interest.
Dr Sotiriou, Dr Buisseret, and Y. Bareche had full access to all of the data in the study and take responsibility for the integrity of the data and the accuracy of the data analysis. Study concept and design: Bareche, Buisseret, Gruosso, Stagg, Sotiriou. Acquisition, analysis, or interpretation of data: All authors. Drafting of the manuscript: Bareche, Buisseret, Stagg, Sotiriou. Critical revision of the manuscript for important intellectual content: Bareche, Buisseret, Gruosso, Rothé, Stagg, Sotiriou. Statistical analysis: Bareche, Venet. Obtained funding: Sotiriou. Administrative, technical, or material support: Bareche, Buisseret, Girard, Dupont, Desmedt, Rothé, Sotiriou. Study supervision: Bareche, Buisseret, Gruosso, Park, Stagg, Rothé, Sotiriou.
We are thankful to the TCGA Research Network (http://cancergenome.nih.gov/) and METABRIC for providing the data analyzed in this study. We are also grateful to both Professor Van Loo and Dr Haase for sharing with us their TCGA ASCAT data.
Supplementary Material
References
- 1. Lehmann BD, Bauer JA, Chen X, et al. Identification of human triple-negative breast cancer subtypes and preclinical models for selection of targeted therapies. J Clin Invest. 2011;121(7):2750–2767. [DOI] [PMC free article] [PubMed] [Google Scholar]
- 2.Bareche Y, Venet D, Ignatiadis M, et al. Unravelling triple-negative breast cancer molecular heterogeneity using an integrative multiomic analysis. Ann Oncol. 2018;29(4):895–902. [DOI] [PMC free article] [PubMed] [Google Scholar]
- 3. Jiang Y-Z, Ma D, Suo C, et al. Genomic and transcriptomic landscape of triple-negative breast cancers: subtypes and treatment strategies. Cancer Cell. 2019;35(3):428–440.e5. [DOI] [PubMed] [Google Scholar]
- 4. Burstein MD, Tsimelzon A, Poage GM, et al. Comprehensive genomic analysis identifies novel subtypes and targets of triple-negative breast cancer. Clin Cancer Res. 2015;21(7):1688–1698. [DOI] [PMC free article] [PubMed] [Google Scholar]
- 5. Dent R, Trudeau M, Pritchard KI, et al. Triple-negative breast cancer: clinical features and patterns of recurrence. Clin Cancer Res. 2007;13(15):4429–4434. [DOI] [PubMed] [Google Scholar]
- 6. Grivennikov SI, Greten FR, Karin M. Immunity, inflammation, and cancer. Cell. 2010;140(6):883–899. [DOI] [PMC free article] [PubMed] [Google Scholar]
- 7. Savas P, Salgado R, Denkert C, et al. Clinical relevance of host immunity in breast cancer: from TILs to the clinic. Nat Rev Clin Oncol. 2016;13(4):228–241. [DOI] [PubMed] [Google Scholar]
- 8. Loi S, Sirtaine N, Piette F, et al. Prognostic and predictive value of tumor-infiltrating lymphocytes in a phase III randomized adjuvant breast cancer trial in node-positive breast cancer comparing the addition of docetaxel to doxorubicin with doxorubicin-based chemotherapy: BIG 02-98. J Clin Oncol. 2013;31(7):860–867. [DOI] [PubMed] [Google Scholar]
- 9. Desmedt C, Haibe-Kains B, Wirapati P, et al. Biological processes associated with breast cancer clinical outcome depend on the molecular subtypes. Clin Cancer Res. 2008;14(16):5158–5165. [DOI] [PubMed] [Google Scholar]
- 10. Allard B, Aspeslagh S, Garaud S, et al. Immuno-oncology-101: overview of major concepts and translational perspectives. Semin Cancer Biol. 2018;52(2):1–11. [DOI] [PubMed] [Google Scholar]
- 11. Pardoll DM. The blockade of immune checkpoints in cancer immunotherapy. Nat Rev Cancer. 2012;12(4):252–264. [DOI] [PMC free article] [PubMed] [Google Scholar]
- 12. Solinas C, Gombos A, Latifyan S, et al. Targeting immune checkpoints in breast cancer: an update of early results. ESMO Open. 2017;2(5):e000255. [DOI] [PMC free article] [PubMed] [Google Scholar]
- 13.Schmid P, Adams s, Rugo HS, et al. Atezolizumab and nab-paclitaxel in advanced triple-negative breast cancer. N Engl J Med. 2018; 379(22):2108–2121. [DOI] [PubMed] [Google Scholar]
- 14.Loi S, Giobbie-Hurder A, Gombos A, et al. Pembrolizumab plus trastuzumab in trastuzumab-resistant, advanced, HER2-positive breast cancer (PANACEA): a single-arm, multicentre, phase 1b–2 trial. Lancet Oncol. 2019;20(3):371–382. [DOI] [PubMed] [Google Scholar]
- 15. Curtis C, Shah SP, Chin S-F, et al. The genomic and transcriptomic architecture of 2,000 breast tumours reveals novel subgroups. Nature. 2012;486(7403):346–352. [DOI] [PMC free article] [PubMed] [Google Scholar]
- 16.Koboldt DC, Fulton RS, McLellan MD, et al. Comprehensive molecular portraits of human breast tumours. Nature. 2012;490(7418):61–70. [DOI] [PMC free article] [PubMed] [Google Scholar]
- 17. Rody A, Karn T, Liedtke C, et al. A clinically relevant gene signature in triple negative and basal-like breast cancer. Breast Cancer Res. 2011;13(5):R97. [DOI] [PMC free article] [PubMed] [Google Scholar]
- 18. Rooney MS, Shukla SA, Wu CJ, Getz G, Hacohen N. Molecular and genetic properties of tumors associated with local immune cytolytic activity. Cell. 2015;160(1–2):48–61. [DOI] [PMC free article] [PubMed] [Google Scholar]
- 19. Alexe G, Dalgin GS, Scanfeld D, et al. High expression of lymphocyte-associated genes in node-negative HER2+ breast cancers correlates with lower recurrence rates. Cancer Res. 2007;67(22):10669–10676. [DOI] [PubMed] [Google Scholar]
- 20. Harris BHL, Barberis A, West CML, Buffa FM. Gene expression signatures as biomarkers of tumour hypoxia. Clin Oncol. 2015;27(10):547–560. [DOI] [PubMed] [Google Scholar]
- 21. Bindea G, Mlecnik B, Tosolini M, et al. Spatiotemporal dynamics of intratumoral immune cells reveal the immune landscape in human cancer. Immunity. 2013;39(4):782–795. [DOI] [PubMed] [Google Scholar]
- 22. Su S, Chen J, Yao H, et al. CD10+GPR77+ Cancer-associated fibroblasts promote cancer formation and chemoresistance by sustaining cancer stemness. Cell. 2018;172(4):841–856.e16. [DOI] [PubMed] [Google Scholar]
- 23. Desmedt C, Majjaj S, Kheddoumi N, et al. Characterization and clinical evaluation of CD10+ stroma cells in the breast cancer microenvironment. Clin Cancer Res. 2012;18(4):1004–1014. [DOI] [PMC free article] [PubMed] [Google Scholar]
- 24. Cascone T, McKenzie JA, Mbofung RM, et al. Increased tumor glycolysis characterizes immune resistance to adoptive T cell therapy. Cell Metab. 2018;27(5):977–987.e4. [DOI] [PMC free article] [PubMed] [Google Scholar]
- 25. Baenke F, Peck B, Miess H, Schulze A. Hooked on fat: the role of lipid synthesis in cancer metabolism and tumour development. Dis Model Mech. 2013;6(6):1353–1363. [DOI] [PMC free article] [PubMed] [Google Scholar]
- 26. Mues C, Zhou J, Manolopoulos KN, et al. Regulation of glucose-6-phosphatase gene expression by insulin and metformin. Horm Metab Res. 2009;41(10):730–735. [DOI] [PubMed] [Google Scholar]
- 27. Gendoo DMA, Ratanasirigulchai N, Schröder MS, et al. Genefu: an R/Bioconductor package for computation of gene expression-based signatures in breast cancer. Bioinformatics. 2016;32(7):1097–1099. [DOI] [PMC free article] [PubMed] [Google Scholar]
- 28.Gruosso T, Gigoux M, Manem VSK, et al. Spatially distinct tumor immune microenvironments stratify triple-negative breast cancers. J Clin Invest. 2019;129(4):1785–1800. [DOI] [PMC free article] [PubMed] [Google Scholar]
- 29.Tamborero D, Rubio-Perez C, Muiños F, et al. A pan-cancer landscape of interactions between solid tumors and infiltrating immune cell populations. Clin Cancer Res. 2018;24(15):3717–3728. [DOI] [PubMed] [Google Scholar]
- 30. Hanzelmann S, Castelo R, Guinney J. GSVA: gene set variation analysis for microarray and RNA-Seq data. BMC Bioinformatics. 2013;14(1):7. [DOI] [PMC free article] [PubMed] [Google Scholar]
- 31. Allard B, Longhi MS, Robson SC, Stagg J. The ectonucleotidases CD39 and CD73: novel checkpoint inhibitor targets. Immunol Rev. 2017;276(1):121–144. [DOI] [PMC free article] [PubMed] [Google Scholar]
- 32. Wang F, Wang G, Liu T, et al. B7-H3 was highly expressed in human primary hepatocellular carcinoma and promoted tumor progression. Cancer Invest. 2014;32(6):262–271. [DOI] [PubMed] [Google Scholar]
- 33.Loi S, Adams S, Schmid P, et al. LBA13Relationship between tumor infiltrating lymphocyte (TIL) levels and response to pembrolizumab (pembro) in metastatic triple-negative breast cancer (mTNBC): results from KEYNOTE-086. Ann Oncol. 2017;28(5):605–649. [Google Scholar]
- 34. Davoli T, Uno H, Wooten EC, Elledge SJ. Tumor aneuploidy correlates with markers of immune evasion and with reduced response to immunotherapy. Science. 2017;355(6322):eaaf8399.. [DOI] [PMC free article] [PubMed] [Google Scholar]
- 35. Gujar SA, Lee PWK. Oncolytic virus-mediated reversal of impaired tumor antigen presentation. Front Oncol. 2014;4:1–7. [DOI] [PMC free article] [PubMed] [Google Scholar]
- 36. Garrido F, Aptsiauri N, Doorduijn EM, Garcia Lora AM, van Hall T. The urgent need to recover MHC class I in cancers for effective immunotherapy. Curr Opin Immunol. 2016;39:44–51. [DOI] [PMC free article] [PubMed] [Google Scholar]
- 37. Morvan MG, Lanier LL. NK cells and cancer: you can teach innate cells new tricks. Nat Rev Cancer. 2016;16(1):7–19. [DOI] [PubMed] [Google Scholar]
- 38.Uhlén M, Fagerberg L, Hallström BM, et al. Tissue-based map of the human proteome. Science. 2015;347(6220):1260419. [DOI] [PubMed] [Google Scholar]
- 39. Barretina J, Caponigro G, Stransky N, et al. The Cancer Cell Line Encyclopedia enables predictive modelling of anticancer drug sensitivity. Nature. 2012;483(7391):603. [DOI] [PMC free article] [PubMed] [Google Scholar]
- 40. Edsgärd D, Johnsson P, Sandberg R. Identification of spatial expression trends in single-cell gene expression data. Nat Methods. 2018;15(5):339–342. [DOI] [PMC free article] [PubMed] [Google Scholar]
- 41.Salmen F, Vickovic S, Larsson L, et al. Multidimensional transcriptomics provides detailed information about immune cell distribution and identity in HER2+ breast tumors. bioRxiv 358937. 2018. doi:10.1101/358937. [Google Scholar]
Associated Data
This section collects any data citations, data availability statements, or supplementary materials included in this article.


