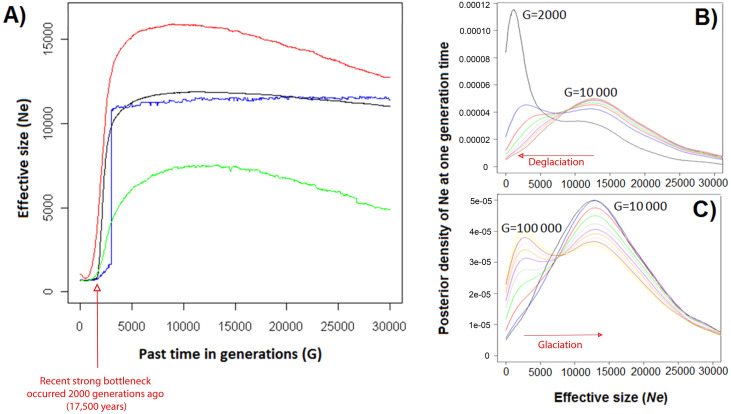
Figure 3. Effective size (Ne) of harbour seals in the north-east UK (from Moray Firth genetic group) as a function of past generation time (G) using 17 microsatellites (VarEff analysis).
(A) Arithmetic (red) and harmonic (green) mean, mode (blue), and median (black) from sampling time (0) to 30,000 generations ago. (B) Posterior densities at the past generation time (G): 2,000 (black), 3,000 (blue), 4,000 (red), 5,000 (green), 6,000 (grey), 7,000 (purple), 8,000 (orange), 9,000 (pink), and 10,000 (red) generations ago. (C) Posterior densities at the past generation time (G) 10,000 (black), 20,000 (blue), 30,000 (red), 40,000 (blue), 50,000 (grey), 60,000 (purple), 70,000 (orange), 80,000 (green), 90,000 (brown), and 100,000 (red) generations ago.

