

Abstract
Pancreatic ductal adenocarcinoma (PDAC) is a leading cause of cancer deaths in the United States. The deoxynucleoside analog gemcitabine is among the most effective therapies to treat PDAC; however, nearly all patients treated with gemcitabine either fail to respond or rapidly develop resistance. One hallmark of PDAC is a striking accumulation of stromal tissue surrounding the tumor, and this accumulation of stroma can contribute to therapy resistance. To better understand how stroma limits response to therapy, we investigated cell-extrinsic mechanisms of resistance to gemcitabine. Conditioned media from pancreatic stellate cells (PSC), as well as from other fibroblasts, protected PDAC cells from gemcitabine toxicity. The protective effect of PSC conditioned media was mediated by secretion of deoxycytidine, but not other deoxynucleosides, through equilibrative nucleoside transporters. Deoxycytidine inhibited the processing of gemcitabine in PDAC cells, thus reducing the effect of gemcitabine and other nucleoside analogs on cancer cells. These results suggest that reducing deoxycytidine production in PSCs may increase the efficacy of nucleoside analog therapies.
Keywords: PSCs, deoxycytidine, gemcitabine, microenvironment
Introduction
Pancreatic ductal adenocarcinoma (PDAC) is notorious as a cancer with poor therapeutic options for most patients. Few patients with PDAC are eligible for surgery, and systemic therapies are all limited in their benefit. FOLFIRINOX combination therapy (Folinic acid, 5-fluorouracil, irinotecan and oxaliplatin) is the most effective regimen for patients who can tolerate the significant side effects. Gemcitabine also can be effective in some patients and has more tolerable side effects (1). Regardless of which therapy is used, the 5-year survival rate is only 8.5%, and, due to increasing incidence, PDAC is projected to become the second leading cause of cancer deaths by 2030 (2, 3).
One striking feature of PDAC is a significant accumulation of stiff stromal tissue surrounding the tumor, termed the desmoplastic response, and this has been proposed as one factor that makes this cancer so resistant to therapy (4–6). Initially, the stiff stroma was thought to present a physical barrier to drug perfusion. However, it is now appreciated that limited drug delivery is not the only reason pancreatic tumors are therapy resistant (6–8). The stroma in PDAC is comprised of a variety of cell types including immune cells, endothelial cells, and fibroblasts, each of which can impact response to therapy (9, 10). In particular, the fibroblasts in the stroma have been shown to belong to heterogeneous subtypes exhibiting differential interactions with tumor cells (11, 12). The ways in which the stromal cells within pancreatic cancer contribute to PDAC resistance has become an area of intense study, with a recent focus on interaction between stroma and PDAC via direct contact and paracrine signaling (13–16). A variety of biomolecules secreted by pancreatic stromal cells have been implicated in resistance to radio- and chemotherapy, including cytokines such as SDF-1α and IGFs, extracellular matrix (ECM) proteins such as fibronectin and collagen I, and even exosomes (17–21). The heterogeneity of fibroblasts in the tumor microenvironment may also result in heterogeneous effects of stroma on therapy resistance.
In addition to the above methods, the stroma has also been shown to cause resistance by sequestering gemcitabine, a deoxycytidine (dC) analog (15, 22). The mechanism by which gemcitabine causes toxicity in cells is well studied (23). This drug enters cells through a variety of nucleoside transporters (24). Once inside cells, gemcitabine is activated via phosphorylation by deoxycytidine kinase to form the active gemcitabine-triphosphate, which can be incorporated into DNA in place of dCTP resulting in masked chain termination, DNA damage, and apoptosis (25).
Here, we show that PSCs, a pancreatic stromal cell type, secrete dC through equilibrative nucleoside transporters. In turn, deoxycytidine protects PDACs from gemcitabine toxicity. We show that dC-mediated gemcitabine resistance likely acts at the level of competition for deoxycytidine kinase. Several other fibroblast cell lines also secrete dC, and media conditioned by PSCs cause resistance to other dC analogs as well as deoxyadenosine analogs. Targeting this stromal dC production and secretion may represent an opportunity to improve the efficacy of nucleoside analog therapies.
Materials and Methods
Cell Culture
P53 2.1.1 PDAC cells derived from p48cre, KrasLSL_G12D/wt, Tp53flox/wt mice were obtained from Eric Collisson (UCSF) (26). PSC1, PSC2and PSC3 cells were derived from the pancreas of FVB/nj mice upon induction of pancreatitis via caerulein treatment mice as described (27, 28). In brief, mice were injected with 8 hourly injections of 50μg/kg of caerulein for two consecutive days. Mice were housed in animal research facilities of the MIT Division of Comparative Medicine (DCM). All facilities are fully accredited by the AAALAC (Animal Welfare Assurance number A-3125) and meet NIH standards as set forth in the “Guide for Care and Use of Laboratory Animals” (DHHS). The MIT DCM Committee on Animal care last reviewed and approved the planned research in this proposal for the Hemann lab (Protocol Number 0515-044-18) on 4/12/18. After the last injection, pancreata were dissected and minced into 2–3 mm pieces which were cultured in a 10 cm dish in 10 mL of DMEM:F12 medium supplemented with 2 mM glutamine and 15% fetal bovine serum. After 72 hours, tissue pieces were removed and the PSCs were immortalized by transduction with SV40. The infected population was selected by puromycin treatment at 2 μg/mL.
PSC6 cells were derived from the pancreas of C57BL/6J mice via density centrifugation as previously described (29), and were immortalized as described above. 293T cells were purchased from ATCC. Hepatic stellate cells (HSC) were a gift from Dr. Linda Griffith (MIT). SW1990, BXPC3, and PANC10.05 were obtained from the Koch Institute High Throughput Facility. Primary and immortalized MEFs were isolated and cultured as previously described (30). For dCK overexpression, ORF expression clones expressing dCK or GFP under control of the EF1a promoter were purchased from GeneCopoeia. After infection, cells were selected with 2 μg/mL puromycin.
Cell lines except SW1990, BXPC3, and PANC10.05 were maintained in DMEM (Corning) supplemented with 100 IU penicillin, 100 μg/mL streptomycin (Corning), 2mM L-glutamine (Corning), and 10% FBS (HyClone). This media was also used for the deoxycytidine supplementation experiments. SW1990 (P53 WT), BXPC3 (homozygous P53 c.659A>G), and PANC10.05 (heterozygous P53 c.764T>A) were obtained from the Koch Institute High Throughput Facility Cell Line Bank and maintained in DMEM (Corning) supplemented with 100 IU penicillin, 100 μg/mL streptomycin (Corning) and 10% FBS (HyClone). All cell lines were routinely tested for mycoplasma contamination using MycoAlert (Lonza). Plasmids for deoxycytidine overexpression were purchased from GeneCopoeia.
Organoid cell culture
Organoids were isolated from LSL-KrasG12D/+;Trp53flox/flox;Pdx-1-Cre;LSL-TdTomato (31) mice bearing PDAC tumors and cultured as previously described (32). Tumors were minced and digested overnight with collagenase XI (Sigma) and dispase II (Roche) and embedded in domes of growth factor reduced (GFR) matrigel (Corning) covered with complete media. Complete media consisted of Advanced DMEM/F12 (Thermo Fisher) containing GlutaMAX (Thermo Fisher), 100 IU penicillin, 100 μg/mL streptomycin, HEPES (Thermo Fisher), 0.5 μM TGF-b inhibitor A-83-01, 0.05 μg/mL EGF, 0.1 μg/mL FGF, 0.01 μM Gastrin I, 0.1 μg/mL Noggin, 10.5 μM Rho Kinase Inhibitor Y-27632, 1.25mM N-acetylcysteine (NAC), 10mM Nicotinamide, 1X B-27 supplement, and 1 μg/mL R-spondin.
Organoids were digested to single cells by triturating with a fire-polished glass pipette and enzymatically digesting with TrypLE Express (Thermo Fisher), dispase II, and DNAse (Sigma) at 37°C. Cells were counted and plated in GFR matrigel at a concentration of 2000 cells/well in complete media. Two days later, media was changed to gemcitabine and/or 20% conditioned media with complete media as the base. Two days later, organoids were imaged and TdTomato fluorescence was quantified using ImageJ software.
Immunofluorescence
Cells were fixed in 4% paraformaldehyde for 10 min on glass coverslips and were permeabilized with .2% TritonX-100 for 10 min and blocked with 5% goat serum for 1 h before staining with primary antibodies against Fibronectin (BD Biosciences 610077, 1:100), αSMA (Sigma A5228, 1:100), and PDGFRβ (Abcam ab32570, 1:100). Secondary antibodies used were anti-mouse 647 (Life Technologies A21240, 1:500) and anti-rabbit 546 (Life Technologies A11010, 1:500). Mounted coverslips were examined using a Zeiss Axio Observer Z1. Images were acquired using a 10X objective and a Zeiss Axiocam 702 camera. Images were processed using Zeiss Zen software.
Conditioned Media
Conditioned media (CM) was produced by changing culturing media of 70%−90% confluent plates, then collecting the media after the indicated number of days passed. CM was filtered through a 0.2 μM SFCA membrane (Corning). Unless otherwise noted, cells conditioned the media for three days prior to collection, and CM was used at a 1:5 dilution. When not in use, CM was stored at −20°C. Boiled CM was incubated at 100°C for 1 hour and centrifuged to remove precipitate. Proteinase K digested CM was incubated with 2 g/mL proteinase K (Invitrogen) for 1 hour at 37°C. Proteinase K was inactivated at 95°C for 10 minutes and the digested media was centrifuged to remove precipitate. Size cutoff columns (EMD Millipore) were used to filter out all compounds larger than 3kDa from the media.
Chemicals
Gemcitabine, azacytidine, and decitabine were purchased from LC Labs. Fludarabine, azidothymidine, and cladribine were purchased from Tocris. Cytarabine was purchased from Selleck Chemicals. Puromycin, nucleosides, nucleotides, and dCTP isotope were purchased from Sigma. Isotopes of deoxycytidine, deoxythymidine, deoxyguanosine, and deoxyadensoine were purchased from Cambridge Isotope Laboratories. Deoxyuridine isotope was purchased from Santa Cruz. Cytarabine, decitabine, azidothymidine, and azacytidine were dissolved in DMSO (Sigma) at 50–100mM and stored at −80°C until use. Working stocks were diluted to 5mM in 100% ethanol (VWR) and stored at −20°C until use. Fludarabine and Cladribine were dissolved in DMSO at 50mM, then divided to 100 μL aliquots. Aliquots were stored at −80°C. Aliquots were diluted in DMSO to 5mM and divided to 10 μL aliquots and stored at −20°C, to reduce freeze/thaw cycles. Puromycin was dissolved in sterile water at 50mM and stored at −20°C. Gemcitabine was dissolved in DMSO at 10mM and stored at −20°C. Nucleosides were dissolved in sterile water at 10mM and stored at −80°C. Nucleoside and nucleotide isotopes were dissolved in HPLC-grade water (Sigma) at 1mM and stored at −80°C.
Cell Viability Assay
Cells were seeded in cell-culture treated 384-well plates (Falcon) in triplicate and spun for 5 minutes at 1500 RPM then allowed to attach for 4–6 hours. After attachment, cells were treated as indicated. Cell viability was measured after 72 hours using resazurin sodium salt (Sigma). Resazurin was used at 0.167 mg/mL and plates were analyzed 3–4 hours after addition. Fluorescence was measured using the Tecan M200 Pro at an excitation of 550nm and emission of 600nm. GR50 values were calculated using GraphPad Prism 5.
Metabolite Extraction
For analysis of conditioned media or adherent cells, cells or 10 μL of media were combined with 600 μL HPLC grade methanol (Sigma-Aldrich, 646377-4X4L) containing 1 μM each of 15N3 13C9-dCTP, 13C1 15N2-deoxyuridine, 13N3-deoxycytidine, 13C10 15N2-thymidine, 15N5-deoxyguanosine, and 15N5-deoxyadenosine, 300 μL HPLC grade water (Sigma-Aldrich), and 400 μL HPLC grade chloroform (Sigma-Aldrich). Samples were vortexed for 10 minutes at 4 °C, then centrifuged at 21000 x g at 4°C for 10 minutes. 400 μL of the aqueous layer was removed and dried under nitrogen.
HPLC fractionation
Conditioned media was extracted as described above, then the dried, aqueous layer was resuspended in 65 μL 80:20 acetonitrile:water. 40 μL of the resuspended liquid was then fractionated using an Agilent 1200 Series HPLC. Fractionation was done using a Luna 5 μm, 100 × 4.6 mm HILIC column with 200 Å pore size (Phenomenex 00D-4450-E0). Mobile phase A was 100 mM ammonium formate, pH 3.2. Mobile phase B was 100% HPLC grade acetonitrile (Sigma-Aldrich). The chromatographic gradient was: 0–3.5 minutes: hold at 90% mobile phase B; 3.5–11 minutes: linear gradient from 90% to 50% mobile phase B; 11–13.5 minutes: hold at 50% mobile phase B; 13.5–16 minutes: linear gradient from 50% mobile phase B to 90% mobile phase B. Flow rate was 1 mL/minute. Fractions were collected in increments of one minute. Each fraction was lyophilized with a Labconco FreeZone 2.5, then resuspended in 40 μL of 44 mM sodium bicarbonate at pH 7.4. Fractions were used directly in LC/MS experiments as described below, or supplemented with 10% FBS for use in cell viability assays with gemcitabine.
LC/MS
Dried media and cell extracts were resuspended in 100 μL HPLC grade water. LC/MS analysis was performed using a QExactive orbitrap mass spectrometer using an Ion Max source and heated electro- spray ionization (HESI) probe coupled to a Dionex Ultimate 3000 UPLC system (Thermofisher). External mass calibration was performed every 7 days. Samples were separated by chromatography by injecting 10 μL of sample on a SeQuant ZIC-pHILIC 2.1 mm x 150 mm (5 μm particle size) column. Flow rate was set to 150 mL/min. and temperatures were set to 25˚C for the column compartment and 4˚C for the autosampler tray. Mobile phase A was 20 mM ammonium carbonate, 0.1% ammonium hydroxide. Mobile phase B was 100% acetonitrile. The chromatographic gradient was: 0–20 min.: linear gradient from 80% to 20% mobile phase B; 20–20.5 min.: linear gradient from 20% to 80% mobile phase B; 20.5 to 28 min.: hold at 80% mobile phase B. The mass spectrometer was operated in full scan, polarity-switching mode and the spray voltage was set to 3.0 kV, the heated capillary held at 275˚C, and the HESI probe was held at 350˚C. The sheath gas flow rate was 40 units, the auxiliary gas flow was 15 units and the sweep gas flow was one unit. The MS data acquisition was performed in a range of 70–1000 m/z, with the resolution set at 70,000, the AGC target at 1×10⁶, and the maximum injection time at 20 msec. Relative quantitation of polar metabolites was performed with XCalibur QuanBrowser 2.2 (Thermo Fisher Scientific) using a 5 ppm mass tolerance and referencing an in-house library of chemical standards. For analysis of deoxynucleoside and dCTP concentrations in conditioned media, peak areas were compared to stable isotope labeled internal standard peak areas to calculate concentration. For analysis of intracellular metabolite concentrations, peak areas were normalized using 13C stable isotope labeled internal standards and intracellular concentrations were calculated using measurements of total cell volume made using a Coulter counter.
Statistical Analysis
Statistics were performed using GraphPad Prism 5 (GraphPad Software Inc). All error bars represent standard error of the mean.
Results
PSCs secrete a small molecule that protects PDAC cells from gemcitabine toxicity
To better understand tumor microenvironmental contributions to gemcitabine resistance in PDAC, we extracted activated PSCs via the outgrowth method as previously described (27, 28). We conditioned media (CM) in the presence of these PSCs (PSC2) for varying times and then examined gemcitabine dose responses on PDAC cells in the presence of varying dilutions of this CM (Fig. 1A). Media conditioned by PSC2s for 3 days conferred 11-fold increase in the dose of gemcitabine required to achieve 50% reduction in the growth rate of PDAC cells (GR50, a metric which takes into account cytostatic and cytotoxic effects of a perturbation) (33). Further, this protective effect was present even in highly diluted CM, with 5% CM conferring 2-fold increase in GR50 (Fig. 1B). The protective effect accumulated in the CM over time, conferring almost 100-fold increase in gemcitabine GR50 after 9 days of media conditioning (Fig. 1C). The CM also did not affect the proliferation of PDAC cells in the absence of gemcitabine except when the culturing media was composed entirely of conditioned media (Fig S1 A–E). Interestingly, the CM did protect cell lines isolated from several human PDAC tumors regardless of P53 status (Fig S1F). We also assessed the protective effect of the CM on a PDAC organoid model. We observed a trend toward protection by the CM, however the higher dose of gemcitabine required to kill the organoids likely overwhelmed the protective effect conferred by the CM (Fig S1G). To begin to characterize the activity in conditioned media that is responsible for the protective effect, we incubated the CM at 100°C for 1 hour, digested the CM with proteinase K, and tested the flow through of CM passed through a 3 kDa cutoff filter. The protective effect of the CM was retained even after boiling, proteinase K exposure, or passage through a filter to deplete high molecular weight material, implicating a small metabolite as the likely cause of the protective effect (Fig. 1D).
Fig. 1.

PSC2s secrete a small metabolite that causes PDAC resistance to gemcitabine. (A) Schematic of generating conditioned media and testing its effect on gemcitabine toxicity. (B) Gemcitabine dose response curves on PDAC cells supplemented with the indicated percentage of PSC2 CM harvested after 3 days in culture. Three biological replicates are shown. (C) Log2 of the gemcitabine GR50 fold change induced by supplementing the indicated percentage of PSC2 CM produced for the indicated number of days. Data show three biological replicates ± SEM. (D) Log2 fold changes of gemcitabine GR50s on PDAC cells supplemented with 3-day PSC2 CM treated as indicated. Data show three biological replicates ± SEM. ns – not significant (one-way ANOVA).
The protective small metabolite can be fractionated by HPLC
To identify the small metabolite secreted by PSC2s that causes resistance to gemcitabine, we fractionated PSC2 CM using HILIC HPLC chromatography. After buffer removal via lyophilization, we diluted each fraction 1:5 and tested the protective effect of the CM on cells treated with 0.02 μM gemcitabine. After three days at this dose, there are about half the number of live cells in the absence of conditioned media relative to untreated controls. In the presence of PSC2 CM diluted to match the amount found in each HPLC fraction, there are ~85% of the number of viable cells compared to untreated controls (Fig. 2A). The number of viable cells in fraction 4 of conditioned media was 79.1% relative to untreated controls, indicating the presence of the protective activity in fraction 4. To confirm that the fractionation isolated activity that was not resulting simply from byproducts of cell growth, we used the same protocol to fractionate 293T CM, which does not have any protective effect. Fractionated 293T CM had 60% or fewer viable cells compared to untreated controls in all fractions (Fig. 2A).
Fig. 2.

Deoxycytidine is present in PSC2 CM and is sufficient to protect PDAC cells from gemcitabine toxicity. (A) Viability of PDAC cells treated with 0.02 μM gemcitabine and the indicated HPLC fraction of regular media (RM), 3-day 293T CM, or 3-day PSC2 CM. (B) A scatterplot of ion counts of 150 metabolites in fraction 4 of RM vs. 3-day PSC2 CM (top) and 3-day 293T CM vs. 3-day PSC2 CM (bottom). (C) Quantification of deoxycytidine in RM, 3 day 293T CM, and 3-day PSC2 CM. Data show three biological replicates ± SEM. *, P ≤ 0.05, ***, P ≤ 0.001 (one-way ANOVA with Bonferroni post-tests) (D) Dose response curves with the indicated nucleosides without (solid lines) or with (dashed lines) 0.025 μM gemcitabine. The viability of 20% 3-day PSC2 CM is also shown. Data show three biological replicates.
Deoxycytidine accumulates in PSC2 conditioned media
To identify the activity responsible for the protective effect observed in HPLC fraction 4, we used liquid chromatography/mass spectrometry (LC/MS) to assess the abundance of 150 common plasma metabolites in HPLC fraction 4 from PSC2 CM, 293T CM, and regular non-conditioned media (RM). These metabolites were chosen on the basis of their previously documented presence in mouse serum, and our ability to easily detect them from spectra of labeled metabolites previously generated on our LC/MS (34). Of these metabolites, deoxycytidine (dC) and N-acetyl alanine were the only compounds present in higher quantities in fraction 4 of PSC2 CM compared to the equivalent fraction from 293T CM and RM (Fig. 2B). N-acetyl alanine was unable to protect PDAC cells from gemcitabine toxicity at doses up to 50 μM (Fig. S2A), so we focused our analysis on dC. Interestingly, after three days in culture, dC in PSC2 CM accumulated to 21.3 μM compared to 0.18 μM in RM and 6.4 μM in 293T CM (Fig. 2C), suggesting that PSC2s may be exporting deoxycytidine into the media.
Deoxycytidine is sufficient to protect PDAC cells from gemcitabine toxicity
To determine if dC or other nucleosides are sufficient to protect PDAC cells from gemcitabine toxicity, we conducted dose response curves with each nucleoside in the presence or absence of 0.025 μM gemcitabine, a dose that kills 100% of PDAC cells after 3 days in the absence of CM. Of all five nucleosides tested, only dC protected PDAC cells from gemcitabine toxicity, with a GR50 of 0.46 μM confirming the sufficiency of dC to cause the protective phenotype (Fig. 2D).
PSC2s do not produce substantial quantities of other nucleosides
While only dC protected PDAC cells from gemcitabine toxicity, we asked if PSC2s secrete other nucleosides as well. Using LC/MS, levels of thymidine, deoxyuridine, dC, deoxyguanosine, and dCTP were quantitated in 3-day PSC2 CM as well as in metabolite extracts of PSC2 cells. We confirmed high levels of dC secretion into the media, and also observed high levels of intracellular dC at 88 μM. PSC2s contained detectable levels of thymidine and deoxyuridine with some release into the media albeit at lower levels than dC. Deoxyguanosine (dG) was detected in cells, but not in the media. dCTP was also only detected in cells and not in the media (Fig. 3A,B).
Fig. 3.
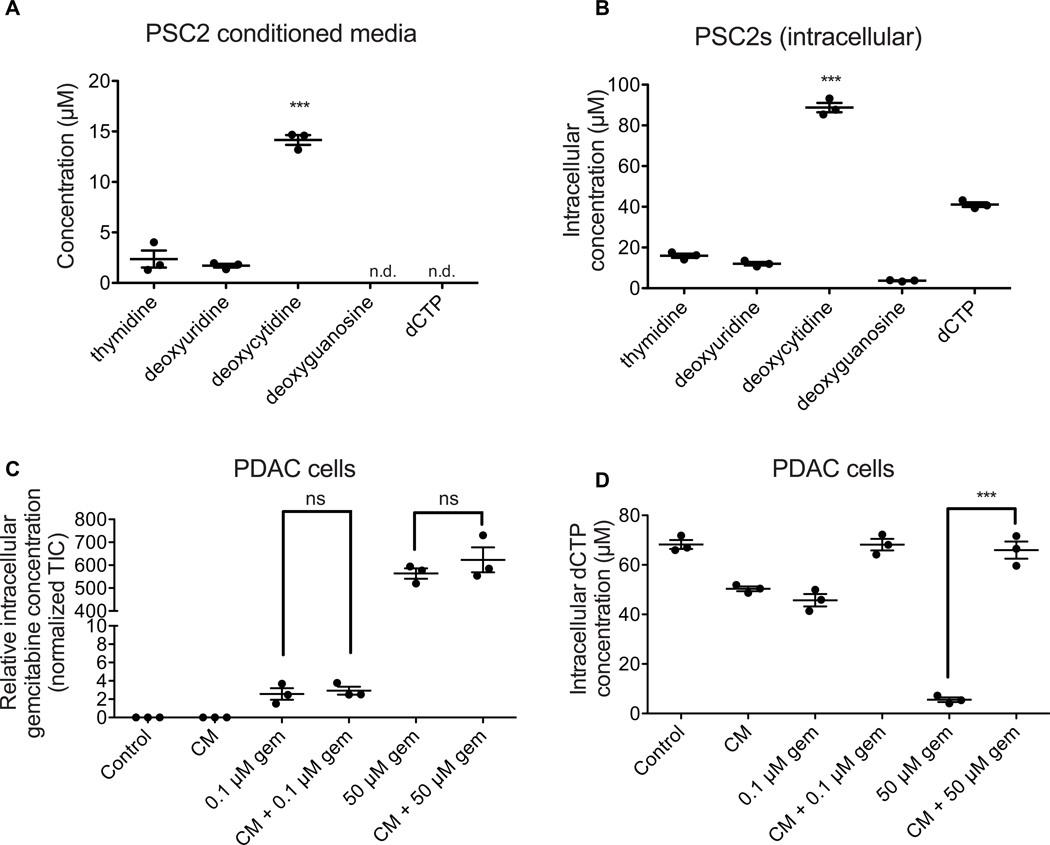
PSC2s produce and secrete deoxycytidine at higher levels than other nucleosides. (A) Absolute quantification of the indicated species in 3-day PSC2 CM. Data show 3 biological replicates ± SEM. Undetected species are indicated by “n.d.”. ***, P ≤ 0.001 (one-way ANOVA with Bonferroni post-tests) (B) Absolute quantification of the indicated species in PSC2 extracts after producing CM for 3 days. Data show 3 biological replicates ± SEM. ***, P ≤ 0.001 (one-way ANOVA with Bonferroni post-tests) (C) Relative quantification of gemcitabine within PDAC cells after the indicated treatment. Data show 3 biological replicates ± SEM. ns, not significant (one-way ANOVA with Bonferroni post-tests) (D) Absolute quantification of dCTP within PDAC cells after the indicated treatment. Data show 3 biological replicates ± SEM. ***, P ≤ 0.001 (two-sample T-test)
PSC2 conditioned media does not prevent gemcitabine from entering PDAC cells
Gemcitabine is transported into cells via the same nucleoside transporters that transport dC (25). Thus, we hypothesized that the dC present in the PSC2 CM may compete with gemcitabine for these transporters, blocking gemcitabine from entering the cell. We treated PDAC cells with 0.1 μM gemcitabine, 50 μM gemcitabine (representative of patient plasma concentration achieved after infusion (35)), and/or diluted PSC2 CM for two hours. We then quantified intracellular gemcitabine levels, as well as thymidine, deoxyuridine, dC, deoxyguanosine, and dCTP using LC/MS. Interestingly, treatment with PSC2 CM did not affect intracellular gemcitabine levels at either dose tested, suggesting that deoxycytidine competes with gemcitabine downstream of uptake via nucleoside transporters (Fig. 3C). Similarly, gemcitabine treatment did not affect import of dC or other nucleosides from PSC2 CM into PDAC cells (Fig. S2B–E). Treatment with PSC2 CM did rescue intracellular dCTP levels after treatment with 50 μM gemcitabine, suggesting that PSC2 CM is able to protect cells from gemcitabine toxicity even at this high physiologic dose (Fig. 3D).
Inhibiting equilibrative nucleoside transporters on PSC2s reduces deoxycytidine in conditioned media
We hypothesized that the PSC2s were secreting large quantities of dC through equilibrative nucleoside transporters (ENTs) which have previously been shown to transport dC (24). Indeed, when we treated PSC2s with a non-toxic dose of two different ENT inhibitors, dipyridamole and 8-MDP (Fig. S3A), the final concentration of deoxycytidine in the CM from these cells was reduced to a level similar to that in 293T CM (Fig. 4A, Fig. S3B). Treatment with ENT inhibitors did not affect levels of other nucleosides secreted by PSC2s (Fig. S3 C–D). Gemcitabine can be transported into PDAC cells through the same transporters and we were unable to inactivate ENT inhibitors by boiling the CM (Fig. S4), likely explaining why ENT inhibitor treatment did not completely abolish the ability of PSC2 CM to protect cancer cells from gemcitabine toxicity (Fig. 4B).
Fig. 4.

PSC2s secrete dC through ENTs. (A) The deoxycytidine concentration in 3-day CM from PSC2s treated with 6.67 μM of the indicated ENT inhibitors is shown. Data show 3 biological replicates ± SEM. **, P ≤ 0.01, ***, P ≤ 0.001 (one-way ANOVA with Bonferroni post-tests). (B) Gemcitabine dose response curves of PDAC cells supplemented with PSC2 conditioned media made in the presence of the indicated ENT inhibitor. Data show three biological replicates ± SEM. *, P ≤ 0.05, ***, P ≤ 0.001 (one-way ANOVA with Bonferroni post-tests).
Some other fibroblast cell types also secrete deoxycytidine
In order to determine if this protective effect is specific to PSC2s, we analyzed CM from several additional PSC cell lines isolated with different methodologies or from different mouse backgrounds (PSC1, PSC3, PSC6), mouse embryonic fibroblasts (MEFs), and hepatic stellate cells (HSCs). We found that CM from the additional PSC cell lines and MEFs did protect PDAC cells from gemcitabine toxicity to varying degrees. However, HSC CM did not protect PDACs from gemcitabine toxicity (Fig. 5A), suggesting secretion of deoxycytidine is not unique to PSC2s, but not all fibroblast cell types secrete deoxycytidine.
Fig. 5.
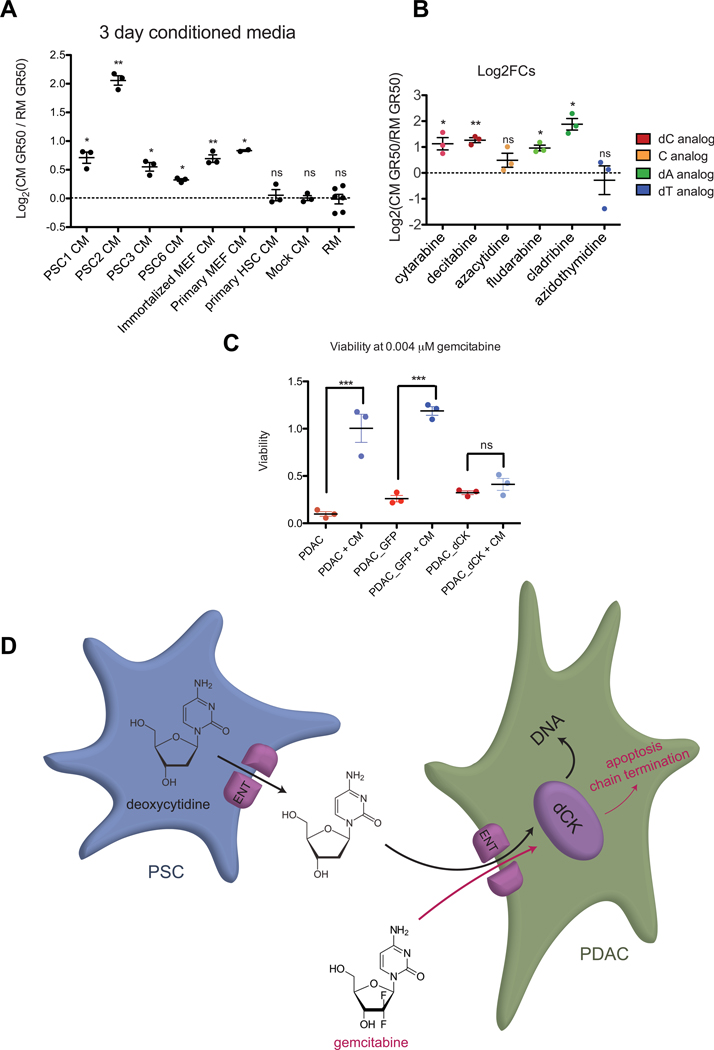
Other PSCs and MEFs protect PDACs from gemcitabine toxicity, and CM is active against other nucleoside analogs. (A) The log2 fold change in gemcitabine GR50 after treatment with 3-day CM from the indicated cell line is plotted. Data show at least three biological replicates ± SEM. *, P ≤ 0.05, **, P ≤ 0.01, ns, not significant (two-tailed one sample t-test). (B) Log2 fold changes of GR50s of the indicated nucleoside analog drugs supplemented with 3-day PSC2 CM. Data show three biological replicates ± SEM. *, P ≤ 0.05, **, P ≤ 0.01 (two-tailed one sample t-test). (C) Viability of the indicated cell lines at 0.004 μM gemcitabine with or without CM supplementation. Data show three biological replicates ± SEM. ***, P ≤ 0.001, ns, not significant (one-way ANOVA with Bonferroni post-tests). (D) Diagram of proposed model. PSCs produce and secrete deoxycytidine through ENTs. Gemcitabine and deoxycytidine are transported into PDACs through ENTs and compete for phosphorylation by dCK.
Media-conditioning PSC cell lines are heterogeneous
As reports have suggested that stromal fibroblasts can exhibit heterogeneity, we used immunofluorescence to study heterogeneity of fibroblast activation markers in several of the cell lines that we observed to condition media. PSC1s, PSC2s, and PSC6 cells showed marked variability in expression of αSMA, fibronectin, and PDGFRβ. All three cell lines had fairly similar distributions of αSMA and fibronectin expression, however PSC6s generally had lower PDGFRβ expression than PSC1s and PSC2s. Additionally, analysis of fluorescence intensity in the αSMA and PDGFRβ channels revealed no relationship between expression of these two markers in the PSC1 and PSC2 cell lines, but striking correlation between their expression in the PSC6 line. (Fig S5A–F).
PSC2 conditioned media protects PDACs from other nucleoside analog drug toxicity
Other nucleoside analogs are active chemotherapy agents, and we conducted dose response curves to determine if the PSC2 CM can protect against other nucleoside analog toxicity. As expected, diluted PSC2 CM provided 2-fold increase in GR50 to the deoxycytidine analogs cytarabine and decitabine. Interestingly, the CM also caused a 2-fold increase in GR50 to deoxyadenosine analogs fludarabine and cladribine. Toxicity of the cytidine analog azacytidine and the thymidine analog azidothymidine were not affected by the CM (Fig. 5B). These data suggest that production of dC by resident fibroblasts might contribute to cancer resistance to some nucleoside analog chemotherapies.
Overexpression of deoxycytidine kinase in PDAC cells reduces the magnitude of CM protection
To determine if deoxycytidine competes with gemcitabine for phosphorylation by deoxycytidine kinase, we overexpressed deoxycytidine kinase in PDAC cells. We determined that the addition of CM did not affect gemcitabine sensitivity in cells overexpressing deoxycytidine kinase. In contrast, cells containing a control plasmid expressing GFP and uninfected cells were significantly less sensitive to gemcitabine upon addition of CM (Fig 5C). This suggests that the conditioned media antagonizes gemcitabine efficacy by reducing the availability of deoxycytidine kinase for phosphorylation.
Discussion
Our results add deoxycytidine to the arsenal of molecules secreted by pancreatic stroma that contribute to chemotherapy resistance in PDAC. Deoxycytidine does not hinder gemcitabine entry into cells, suggesting competition for downstream processing enzymes such as deoxycytidine kinase. Deoxycytidine secretion may be a conserved phenotype of some types of fibroblasts, as MEF CM was able to protect PDAC cells from gemcitabine toxicity, albeit to a lesser extent. Recent work has shown that macrophages are also able to secrete deoxycytidine (36). However, the lack of dC secretion by hepatic stellate cells suggests that deoxycytidine secretion is not a property of all fibroblasts and other factors might influence whether these support cells produce this molecule. Furthermore, the heterogeneity in expression of fibroblast activation markers observed in several of the PSC lines suggests that dC secretion may be a phenotype of a subset of fibroblasts.
While PSC2 CM did not protect PDAC cells from azacytidine or azidothymidine toxicity, it did confer protection against cytarabine, decitabine, fludarabine, and cladribine. Neither azacytidine nor azidothymidine rely on deoxycytidine kinase for processing into their toxic forms, but cytarabine, decitabine, fludarabine, cladribine, and gemcitabine are all phosphorylated by deoxycytidine kinase into their toxic forms (37, 38). This distinction supports the hypothesis that nucleoside analog toxicity inhibition by deoxycytidine acts at the level of deoxycytidine kinase (Fig. 5D). This hypothesis is further supported by the fact that overexpressing deoxycytidine kinase in PDAC cells reduced the gemcitabine protection provided by the conditioned media.
We observed that the high levels of PSC2 nucleoside production and secretion were limited to specifically deoxycytidine. Although we were unable to measure deoxyadenosine levels, deoxyguanosine was at a low concentration in PSC2s, and was undetectable in PSC2 CM. This potential pyrimidine specificity suggests that the mechanism of deoxycytidine production is not due to general upregulation of nucleoside production. Deoxycytidine secretion is a known mechanism of maintaining intracellular dCTP pool sizes when too much is being produced (39–41). Therefore, the deoxycytidine production and secretion specificity also suggests that PSC2s may have increased levels of dCTP production perhaps as a biproduct of another metabolic process, and excess dCTP is converted into deoxycytidine and secreted.
The deoxycytidine specificity further suggests that the PDAC microenvironment may have a high level of deoxycytidine. At first glance this seems paradoxical – the microenvironment of PDAC is specifically protective against one of the only drugs effective for this tumor type, and which is one of only a small number of malignancies in which this drug is used (1, 35). We propose instead that the behavior and microenvironment of tumors in a tissue dictates the drugs that are effective for that tumor type. We have previously observed this when comparing the variable efficacy of two platinum-based chemotherapies, cisplatin and oxaliplatin, in different tumor types. Cisplatin, which kills cells by inducing DNA damage, is more effective in breast and non-small cell lung cancers, where inactivating mutations in ATM and CHK2 predispose cells to DNA damage. On the other hand, oxaliplatin, which kills cells by inducing ribosome biogenesis stress, is more effective in gastrointestinal tumors which have increased expression of translation machinery (42). In the pancreatic setting, PDAC cells may have a high need for deoxycytidine and therefore are optimized to import and utilize deoxycytidine and its analogs – explaining its efficacy in this tumor type. This may even suggest a high need for deoxycytidine in normal pancreatic ductal cell biology.
The high levels of deoxycytidine secreted by PSC2s raises the question of why the PSCs are producing and secreting large quantities of this nucleoside. One hypothesis is that PSCs produce deoxycytidine as part of wound healing response, potentially in response to PDAC derived factors produced as a result of stress (43–45). Regardless, these data motivate further understanding of nucleoside metabolism in fibroblasts and what drives dC secretion. Better understanding the mechanism of deoxycytidine production in PSCs could identify a way to increase the efficacy of nucleoside analog therapies in multiple cancer types.
Supplementary Material
Significance.
This study provides important new insight into mechanisms that contribute to gemcitabine resistance in PDAC and suggests new avenues for improving gemcitabine efficacy.
Acknowledgments:
We thank Linda Griffith, for donation of the HSC cells. We are grateful to Chris Nabel and Jackie Lees for helpful discussion and to Sonya Entova for assistance with HPLC buffer removal. This project was funded in part by the NIH (NCI U54-217377 and NCI R01-CA226898), the MIT Center for Precision Cancer Medicine, and by the Koch Institute Support (core) Grant P30-CA14051 from the National Cancer Institute. S.D. was supported by the David H. Koch Fellowship in Cancer Research. A.N.L is a Robert Black Fellow of the Damon Runyon Cancer Research Foundation (DRG-2241-15), and is supported by a NIH Pathway to Independence Award K99/R00, (1K99CA234221). M.T.H and M.G.V.H. acknowledge funding from the MIT Center for Precision Cancer Medicine and the Ludwig Center at MIT. M.G.V.H also acknowledges funding from the Lustgarten Foundation, SU2C, the NCI, and an HHMI Faculty Scholar award.
Footnotes
Competing interests: M.G.V.H. is a consultant and advisory board member for Agios Pharmaceuticals, Aeglea Biotherapeutics, and Auron Therapeutics.
References and Notes:
- 1.Kleeff J, Korc M, Apte M, La Vecchia C, Johnson CD, Biankin AV, et al. , Pancreatic cancer. Nat. Rev. Dis. Prim 2, 1–23 (2016). [DOI] [PubMed] [Google Scholar]
- 2.Rahib L, Smith BD, Aizenberg R, Rosenzweig AB, Fleshman JM, Matrisian LM, Projecting cancer incidence and deaths to 2030: The unexpected burden of thyroid, liver, and pancreas cancers in the united states. Cancer Res. 74, 2913–2921 (2014). [DOI] [PubMed] [Google Scholar]
- 3.Institute NC, Surveillance, Epidemiology, and End Results (SEER) Program Populations (1969–2015). DCCPS, Surveill. Res. Progr (2017), (available at https://seer.cancer.gov). [Google Scholar]
- 4.Jacobetz MA, Chan DS, Neesse A, Bapiro TE, Cook N, Frese KK, et al. , Hyaluronan impairs vascular function and drug delivery in a mouse model of pancreatic cancer. Gut. 62, 112–120 (2013). [DOI] [PMC free article] [PubMed] [Google Scholar]
- 5.Olive KP, a Jacobetz M, Davidson CJ, Gopinathan A, McIntyre D, Honess D, et al. , Inhibition of Hedgehog Signaling Enhances Delivery of Chemotherapy in a Mouse Model of Pancreatic Cancer. Science (80-. ). 324, 1457–1461 (2009). [DOI] [PMC free article] [PubMed] [Google Scholar]
- 6.Provenzano PP, Cuevas C, Chang AE, Goel VK, Von Hoff DD, Hingorani SR, Enzymatic Targeting of the Stroma Ablates Physical Barriers to Treatment of Pancreatic Ductal Adenocarcinoma. Cancer Cell. 21, 418–429 (2012). [DOI] [PMC free article] [PubMed] [Google Scholar]
- 7.Özdemir BC, Pentcheva-Hoang T, Carstens JL, Zheng X, Wu CC, Simpson TR, et al. , Depletion of carcinoma-associated fibroblasts and fibrosis induces immunosuppression and accelerates pancreas cancer with reduced survival. Cancer Cell. 25, 719–734 (2014). [DOI] [PMC free article] [PubMed] [Google Scholar]
- 8.Rhim AD, Oberstein PE, Thomas DH, Mirek ET, Palermo CF, Sastra SA, et al. , Stromal elements act to restrain, rather than support, pancreatic ductal adenocarcinoma. Cancer Cell. 25, 735–747 (2014). [DOI] [PMC free article] [PubMed] [Google Scholar]
- 9.Kota J, Hancock J, Kwon J, Korc M, Pancreatic cancer : Stroma and its current and emerging targeted therapies. Cancer Lett. 391, 38–49 (2017). [DOI] [PubMed] [Google Scholar]
- 10.Halbrook CJ, Pontious C, Lee H, Kovalenko I, Zhang Y, Lapienyte L, et al. , Macrophage Released Pyrimidines Inhibit Gemcitabine Therapy in Pancreatic Cancer. bioRxive (2018), doi: 10.1101/463125. [DOI] [PMC free article] [PubMed] [Google Scholar]
- 11.Kalluri R, The biology and function of fibroblasts in cancer. Nat. Publ. Gr 16, 582–598 (2016). [DOI] [PubMed] [Google Scholar]
- 12.Öhlund D, Handly-Santana A, Biffi G, Elyada E, Almeida AS, Ponz-Sarvise M, et al. , J. Exp. Med, in press, doi: 10.1084/jem.20162024. [DOI] [PMC free article] [PubMed] [Google Scholar]
- 13.xiang Zhan H, Zhou B, gang Cheng Y, wei Xu J, Wang L, yong Zhang G, et al. , Crosstalk between stromal cells and cancer cells in pancreatic cancer: New insights into stromal biology. Cancer Lett. 392, 83–93 (2017). [DOI] [PubMed] [Google Scholar]
- 14.Von Ahrens D, Bhagat TD, Nagrath D, Maitra A, Verma A, The role of stromal cancer-associated fibroblasts in pancreatic cancer. J. Hematol. Oncol 10, 1–8 (2017). [DOI] [PMC free article] [PubMed] [Google Scholar]
- 15.Liang C, Shi S, Meng Q, Liang D, Ji S, Zhang B, et al. , Complex roles of the stroma in the intrinsic resistance to gemcitabine in pancreatic cancer: Where we are and where we are going. Exp. Mol. Med 49 (2017), doi: 10.1038/emm.2017.255. [DOI] [PMC free article] [PubMed] [Google Scholar]
- 16.Tape CJ, Ling S, Dimitriadi M, McMahon KM, Worboys JD, Leong HS, et al. , Oncogenic KRAS Regulates Tumor Cell Signaling via Stromal Reciprocation. Cell. 165, 910–920 (2016). [DOI] [PMC free article] [PubMed] [Google Scholar]
- 17.Richards KE, Zeleniak AE, Fishel ML, Wu J, Littlepage LE, Hill R, Cancer-associated fibroblast exosomes regulate survival and proliferation of pancreatic cancer cells. Oncogene. 36, 1770–1778 (2017). [DOI] [PMC free article] [PubMed] [Google Scholar]
- 18.Mantoni TS, Lunardi S, Al-Assar O, Masamune A, Brunner TB, Pancreatic stellate cells radioprotect pancreatic cancer cells through β1-integrin signaling. Cancer Res. 71, 3453–3458 (2011). [DOI] [PMC free article] [PubMed] [Google Scholar]
- 19.Zhang H, Wu H, Guan J, Wang L, Ren X, Shi X, et al. , Paracrine SDF-1α signaling mediates the effects of PSCs on GEM chemoresistance through an IL-6 autocrine loop in pancreatic cancer cells. Oncotarget. 6, 3085–3097 (2015). [DOI] [PMC free article] [PubMed] [Google Scholar]
- 20.Ireland L, Santos A, Ahmed MS, Rainer C, Nielsen SR, Quaranta V, et al. , Chemoresistance in pancreatic cancer is driven by stroma-derived insulin-like growth factors. Cancer Res. 76, 6851–6863 (2016). [DOI] [PMC free article] [PubMed] [Google Scholar]
- 21.Miyamoto H, Murakami T, Tsuchida K, Sugino H, Miyake H, Tashiro S, Tumor-stroma interaction of human pancreatic cancer: acquired resistance to anticancer drugs and proliferation regulation is dependent on extracellular matrix proteins. Pancreas. 28, 38–44 (2004). [DOI] [PubMed] [Google Scholar]
- 22.Neesse A, Verbeke C, Hessmann E, Klein L, Richards FM, Gopinathan A, et al. , Fibroblast drug scavenging increases intratumoural gemcitabine accumulation in murine pancreas cancer. Gut. 67, 497–507 (2017). [DOI] [PMC free article] [PubMed] [Google Scholar]
- 23.Plunkett W, Huang P, Searcy CE, Gandhi V, Gemcitabine: preclinical pharmacology and mechanisms of action. Semin. Oncol 23, 3–15 (1996). [PubMed] [Google Scholar]
- 24.Young JD, Yao SYM, Baldwin JM, Cass CE, Baldwin SA, The human concentrative and equilibrative nucleoside transporter families, SLC28 and SLC29. Mol. Aspects Med. 34, 529–547 (2013). [DOI] [PubMed] [Google Scholar]
- 25.Mini E, Nobili S, Caciagli B, Landini I, Mazzei T, Cellular pharmacology of gemcitabine. Ann. Oncol 17, 7–12 (2006). [DOI] [PubMed] [Google Scholar]
- 26.Collisson EA, Sadanandam A, Olson P, Gibb WJ, Truitt M, Gu S, et al. , Subtypes of pancreatic ductal adenocarcinoma and their differing responses to therapy. Nat. Med 17, 500–503 (2011). [DOI] [PMC free article] [PubMed] [Google Scholar]
- 27.Knoop RF, Sparn M, Waldmann J, Plassmeier L, Bartsch DK, Lauth M, et al. , Chronic Pancreatitis and Systemic Inflammatory Response Syndrome Prevent Impact of Chemotherapy with Gemcitabine in a Genetically Engineered Mouse Model of Pancreatic Cancer. Neoplasia. 16, 463–470 (2014). [DOI] [PMC free article] [PubMed] [Google Scholar]
- 28.Bachem MG, Schneider E, Groß H, Weidenbach H, Schmid RM, Menke A, et al. , Identification, culture, and characterization of pancreatic stellate cells in rats and humans. Gastroenterology. 115, 421–432 (1998). [DOI] [PubMed] [Google Scholar]
- 29.Mews P, Phillips P, Fahmy R, Korsten M, Pirola R, Wilson J, et al. , Pancreatic stellate cells respond to inflammatory cytokines: potential role in chronic pancreatitis. Gut. 50, 535–541 (2002). [DOI] [PMC free article] [PubMed] [Google Scholar]
- 30.Lunt SY, Muralidhar V, Hosios AM, Israelsen WJ, Gui DY, Newhouse L, et al. , Article Pyruvate Kinase Isoform Expression Alters Nucleotide Synthesis to Impact Cell Proliferation, 95–107 (2015). [DOI] [PMC free article] [PubMed] [Google Scholar]
- 31.Bardeesy N, Aguirre AJ, Chu GC, Cheng K, V Lopez L, Hezel AF, et al. , Both p16Ink4a and p19arf-p53 pathway constrain progression of PDAC in mouse PNAS bardeesy.pdf. 103, 5947–5952 (2006). [DOI] [PMC free article] [PubMed] [Google Scholar]
- 32.Boj SF, Il Hwang C, Baker LA, Chio IIC, Engle DD, Corbo V, et al. , Organoid models of human and mouse ductal pancreatic cancer. Cell. 160, 324–338 (2015). [DOI] [PMC free article] [PubMed] [Google Scholar]
- 33.Hafner M, Niepel M, Chung M, Sorger PK, Growth rate inhibition metrics correct for confounders in measuring sensitivity to cancer drugs. Nat. Methods. 13, 1–11 (2016). [DOI] [PMC free article] [PubMed] [Google Scholar]
- 34.Sullivan MR, V Danai L, Lewis CA, Chan SH, Gui DY, Kunchok T, et al. , Quantification of microenvironmental metabolites in murine cancers reveals determinants of tumor nutrient availability, 1–27 (2019). [DOI] [PMC free article] [PubMed] [Google Scholar]
- 35.Ciccolini J, Serdjebi C, Peters GJ, Giovannetti E, Pharmacokinetics and pharmacogenetics of Gemcitabine as a mainstay in adult and pediatric oncology: an EORTC-PAMM perspective. Cancer Chemother. Pharmacol. 78, 1–12 (2016). [DOI] [PMC free article] [PubMed] [Google Scholar]
- 36.Halbrook CJ, Pontious C, Kovalenko I, Lapienyte L, Dreyer S, Lee HJ, et al. , Macrophage-Released Pyrimidines Inhibit Gemcitabine Therapy in Pancreatic Cancer. Cell Metab. 29, 1390–1399.e6 (2019). [DOI] [PMC free article] [PubMed] [Google Scholar]
- 37.Klanova M, Lorkova L, Vit O, Maswabi B, Molinsky J, Pospisilova J, et al. , Downregulation of deoxycytidine kinase in cytarabine-resistant mantle cell lymphoma cells confers cross-resistance to nucleoside analogs gemcitabine, fludarabine and cladribine, but not to other classes of anti-lymphoma agents. Mol. Cancer. 13, 1–14 (2014). [DOI] [PMC free article] [PubMed] [Google Scholar]
- 38.Qin T, Jelinek J, Si J, Shu J, Issa JPJ, Mechanisms of resistance to 5-aza-2’-deoxycytidine in human cancer cell lines. Blood. 113, 659–667 (2009). [DOI] [PMC free article] [PubMed] [Google Scholar]
- 39.Nicander B, Reichard P, Evidence for the involvement of substrate cycles in the regulation of deoxyribonucleoside triphosphate pools in 3T6 cells. J. Biol. Chem 260, 9216–9222 (1985). [PubMed] [Google Scholar]
- 40.Bianchi V, Pontis E, Reichard P, Interrelations between substrate cycles and de novo synthesis of pyrimidine deoxyribonucleoside triphosphates in 3T6 cells. Proc. Natl. Acad. Sci. U. S. A 83, 986–90 (1986). [DOI] [PMC free article] [PubMed] [Google Scholar]
- 41.Bianchi V, Pontis E, Reichard P, Regulation of pyrimidine deoxyribonucleotide metabolism by substrate cycles in dCMP deaminase-deficient V79 hamster cells. Mol Cell Biol. 7, 4218–4224 (1987). [DOI] [PMC free article] [PubMed] [Google Scholar]
- 42.Bruno PM, Liu Y, Park GY, Murai J, Koch CE, Eisen TJ, et al. , A subset of platinum-containing chemotherapeutic agents kills cells by inducing ribosome biogenesis stress. Nat. Med 23, 461–471 (2017). [DOI] [PMC free article] [PubMed] [Google Scholar]
- 43.Mccleary-Wheeler AL, Mcwilliams R, Fernandez-Zapico ME, Aberrant signaling pathways in pancreatic cancer: A two compartment view. Mol. Carcinog 51, 25–39 (2012). [DOI] [PMC free article] [PubMed] [Google Scholar]
- 44.Ottenhof NA, de Wilde RF, Maitra A, Hruban RH, Offerhaus GJA, Molecular Characteristics of Pancreatic Ductal Adenocarcinoma. Patholog. Res. Int 2011, 1–16 (2011). [DOI] [PMC free article] [PubMed] [Google Scholar]
- 45.Ryan DP, Hong TS, Bardeesy N, Pancreatic Adenocarcinoma. N. Engl. J. Med 371, 1039–1049 (2014). [DOI] [PubMed] [Google Scholar]
Associated Data
This section collects any data citations, data availability statements, or supplementary materials included in this article.