

Abstract
A quasi-experiment evaluated a food hub’s (FH) impact in a low-income/low-access (food desert) setting on fruit and vegetable (F&V) intake, diet quality, kilocalories, perceived food environment, BMI, and farmers’ market shopping versus a matched community (n = 265 FH, n = 262 Comparison). Comparison shoppers had better baseline perceptions of their food environment, but FH shoppers improved significantly more than Comparison shoppers. Comparison shoppers significantly increased F&V intake versus FH shoppers. Effects were not significant for other diet outcomes, BMI, or farmers’ market shopping. Factors besides spacial access to healthy food need consideration to address dietary intake and obesity in disadvantaged communities.
Keywords: Diet, Obesity, Food hub, Farmers’ market, Food desert, Food environment
1. Introduction
Interest in the local food environment’s impact on healthy food access and other social, economic, and sustainability issues has grown rapidly in the past decade. Reviews conclude that healthy food access in the United States (US) is unequally distributed by race and socioeconomic status. Communities of lower income and minority status have comparatively fewer supermarkets but more fast food outlets. Residents in these “food desert” neighborhoods tend to have relatively poorer diets and greater obesity prevalence; however, the expected associations between healthy food access and diet and obesity have not been uniformly supported (Black et al., 2015; Hilmers et al., 2012; Larson et al., 2009; Ver Ploeg et al., 2009; Walker et al., 2010). Methodological limitations have hindered definitive conclusions (Black et al., 2015; Walker et al., 2010). Other potential influences on dietary quality and obesity besides supermarket proximity warrant further investigation (Boone-Heinonen et al., 2011; Drewnowski et al., 2012; Ford and Dzewaltowski, 2011; Gailey and Bruckner, 2019; Heval et al., 2017; Ver Ploeg and Rahkovsky, 2016).
Large sums have been invested in enhancements to the food environment as a means to advance social, health, and economic benefits (US Office of the Administration for Children and Families, 2016), but, to date, the evidence for diet and health-related impacts is inconclusive. Bowen has noted that “research into the efficacy and effectiveness of intervention modalities that incorporate environmental strategies is falling behind associational research and … practice” (Bowen et al., 2015, p. 300). The introduction of new supermarkets and other food stores (Abeykoon et al., 2017; Cummins et al., 2014; Dubowitz et al., 2015a; Gosh-Dastidar et al., 2017; Pitts et al., 2018) and farmers’ markets in food deserts (Abusabha et al., 2011; Evans et al., 2012; Freedman et al., 2013; Jennings et al., 2012; Pitts et al., 2016) show mixed results for effects on fruit and vegetable (F&V) intake and weight.
A type of local food initiative, the Food Hub (FH), has been defined primarily as a business [or organization] that supports local and regional producers by managing the aggregation, distribution, and marketing of their products (Barham et al., 2012). Increasingly, FH missions have expanded (Horst et al., 2011; Blay-Palmer et al., 2013; Levkoe et al., 2018) to address improved access to healthy food, reduced health disparities through healthy food access, and improved community health (Colasanti et al., 2018), but the impacts in these areas are unknown.
This paper reports the findings from a quasi-experimental evaluation of a community-implemented FH in an economically disadvantaged area with low access to supermarkets and presumably, healthy food, in the southeastern US. The primary hypotheses were that the FH community participants would have greater improvements from baseline (T1) to post-tests at 6 and 18 months (T2 and T3) after the food hub’s opening than participants from a matched Comparison community on F&V intake, dietary quality, energy intake, body mass index (BMI), and perceived neighborhood food environment. Secondary hypotheses were the following: a) self-reported shopping at the FH’s onsite farmers’ market would increase significantly compared to the comparison farmers’ market from baseline to T2 and T3 post-tests; b) sales at the FH’s farmers’ market from Supplemental Nutrition Assistance Program (SNAP) payments would increase significantly from baseline to T2 and T3 post-tests; and c) shopping at the FH’s small grocery store would increase significantly from the stores’ opening at T2 and T3 post-tests.
2. Materials and methods
2.1. Food hub initiative
As one project within a comprehensive approach to community revitalization, a partnership including a community development group, local foundation, non-profit organizations, and local government entity obtained funds from local sources and the federal Healthy Food Financing Initiative (HFFI) (US Office of the Administration for Children and Families, 2019) to create a FH centrally located in neighborhoods of low income and low access to supermarkets (LILA) (i.e., urban food deserts) (Dutko et al., 2012). The HFFI grant awardee was a non-profit that created and managed the FH’s on-site culinary job training program (for unemployed and underemployed and formerly incarcerated participants, and those without consistent housing), catering service, café, and small grocery store. The grocery store’s hours of operation varied on weekdays. It was open from 8:00 a.m. to noon on Saturdays but closed between mid-December of 2014 and late March of 2015 and between November of 2015 and late January of 2016. A non-profit farmers’ market (a partner in the initiative) was located one half mile from the FH site. In operation since 2006, the farmers’ market moved its 8:00 a.m. to noon Saturday market to the newly opened FH site in November of 2014, while continuing its double-value incentives program for SNAP shoppers.1 The market was open from May to mid-December in 2013 and March through December of 2014 and 2015. The majority of vendors sold SNAP-eligible food items (2013 mean=18 SNAP vendors of mean=24 total vendors; 2014 mean=19 SNAP vendors of mean=23 total vendors; 2015 mean=23 SNAP vendors of mean=28 total vendors). A weekday mobile market made stops countywide, with a varying schedule. Farmers’ market staff persons and volunteers created a one-half acre urban farm at the FH site, which supplied produce to the mobile market. The FH partners provided occasional education to residents and growers, cooking classes and demonstrations, volunteer opportunities, and advice to school and community gardens.
The community’s HFFI grant proposal’s goal was to “foster community economic development in a poverty-stricken area.” Objectives addressed business development, job creation, community revitalization, and healthy food access through elimination of a food desert. As such, the FH’s goals were not focused specifically on dietary intake or obesity as outcomes, but the initiative created a natural experiment of change in the food environment.
2.2. Evaluation design
This study was an external evaluation. The researchers were not involved in planning or implementing the FH. The design was a quasiexperiment with a matched Comparison community. Data collection was planned to occur prior to the FH opening and at 12 and 24 months post-opening. FH construction delays postponed the opening, therefore the T2 and T3 post-test data collection began at 6 and 18 months post-opening (See Supplemental Table A for details of the study period). The literature on socio-ecological frameworks of obesity (e.g., Glanz et al., 2005; Gordon-Larsen and Popkin, 2011; Story et al., 2008) guided our selection of constructs and potential covariates for the evaluation. The study did not evaluate the FH’s economic development objectives.
2.3. Community matching and setting
We used the US Department of Agriculture (USDA) definition of an urban, LILA census tract2 as having ≥ 20% of the population below the federal poverty income level and ≥33% living >1 mile from a supermarket (US Department of Agriculture, 2017). The FH proposal named four contiguous census tracts (three were LILA) surrounding the site as the focal area for improving healthy food access.
Data did not exist for individual-level matching; therefore, we used county, city, and census tract data to select a Comparison site. In response to the funding announcement’s obesity focus (US National Institutes of Health, 2012), the combined county prevalence for overweight and obesity was the first matching criterion. Twenty-four of the state’s counties were within ±10% of the FH county’s prevalence of 57.7% at the time (South Carolina Department of Health and Environmental Control, 2011). To find the closest match, we compared cities of similar population size within these counties to the FH initiative’s city on race, poverty, female-headed households, car ownership, presence of LILA census tracts and county level F&V intake. The matched Comparison area comprised three contiguous urban LILA census tracts (US Department of Agriculture, 2017), which included a small farmers’ market. The FH and Comparison cities were 135 miles apart and 83 and 74 miles from the university, respectively.
2.4. Sample size determination and sampling
The study was powered to detect small effects in the main outcomes of F&V intake and weight/BMI, assuming α=.05 and power = .80. At least 200 participants per community was sufficient to detect a mean difference of 0.8 daily servings of F&Vs (d=.29) (Cohen, 1998), an effect comparable to behavioral interventions (Thompson and Ravia, 2011), and mean weight loss of 2 kg (d=.31). To accommodate attrition, the enrollment goal was increased by 40% to 280 per community.
2.5. Recruitment and retention
As the first step in recruitment, we mailed a flier by first-class mail to the “household food shopper” at 6136 residential addresses (n = 2203 FH, n = 3933 Comparison) in the seven focal tracts (95% of the 2010 US Census total), purchased from the market research firm Survey Sampling, inviting them to call for information about the “Food Access and Family Food Shopper” study. Only one percent of the envelopes with fliers were returned as undeliverable. We used this approach because random digit dialing (RDD) is not efficient where pre-paid mobile phone use is high (i.e., lower-income areas) (McGeeney, 2015; Pew Research Center, 2015), nor is sampling at the census tract level feasible, as telephone exchanges do not coincide with tract boundaries. Further, direct marketers report that the response to direct mailing to house address lists is 15 times that for email, social media, and online displays (Haskell, 2019).
Recruitment and enrollment focused in seven locally-named neighborhoods approximately bounded by the four contiguous FH and three contiguous Comparison census tracts occurred between November 2013 and May 2014. Because community members identify with and recruitment materials used neighborhood names rather than census tract numbers, geographic eligibility expanded to include portions of 12 adjacent tracts one mile past the original seven tracts’ boundaries, if a tract had ≥16% poverty (the state level).
Active and passive recruitment strategies were mass mailings, fliers and posters, electronic and televised notices, in-person information sessions, prize drawings, and word-of-mouth through local community outreach staff persons and community organizations. Recruitment materials described the study as focused on “food shopping, buying, and eating” to “help us understand what it is like to shop for and pay for food in households in your community,” thus the FH evaluation purpose was not revealed to participants.
Retention methods were identical in both communities. Participants received newsletters in the mail with prompts to report contact information changes, reminders from community-based partners, and phone calls. Retention calls occurred between data collection periods based on a protocol for multiple attempts and follow-up by US mail if necessary. A detailed description of recruitment and retention methods and community participation is available (Sharpe et al., 2020).
2.6. Inclusion criteria and informed consent
A standardized interview guide assessed eligibility by phone and at community locations. Inclusion/exclusion criteria were the following: ≥18 years old, does ≥ half of the food shopping (one per household), non-institutional residence (i.e., participant controls food purchases), resides within the study boundary (address verified via US Census website) ≥3 weeks per month, no plans to move out of the study area, no cognitive impairment, and telephone access.
The University’s Institutional Review Board approved the study protocol and waived signed informed consent (approval no. Pro00023844). Interviewers used a standardized informed consent script, provided a copy to participants, and documented participants’ verbal consent.
2.7. Procedures and measures
Data collection and timeline.
In-person interviews occurred at research field offices and community centers in both locations at all three time points. Community-based project coordinators, interviewers, outreach recruiters, were blind to the study’s main purpose of evaluating the FH. The questionnaire included sociodemographic, economic, attitudinal, behavioral, and health-related questions. At T1, participants received an in-person 20-min training in food portion size estimation and a paper food portion visual aid (Weber et al., 1997), with a refresher at T2 and T3 at the end of their in-person interview appointment.
Within two weeks after all three in-person interviews (T1-T3), dietitians conducted unannounced, multi-pass, telephone-based 24-h dietary recall interviews. Participants received $15 gift cards for the in-person and dietary recall interviews (total $30). At T2 and T3, they received $30 in cash, or if preferred, a gift card (total $60). For ethical reasons, interviewers provided a list of community services at each interview, including food assistance.
Dietary recall.
Registered dietitians trained in the University of Minnesota’s Nutrient Data System for Research (NDSR) (Nutrition Coordinating Center, 2014) conducted the interviews. Our protocol randomly assigned a day of the week (weekday and weekend days) to the participant for the 24-h dietary recall to achieve a sample of dietary intake from each community during the measurement period. Data were collected and analyzed with NDSR software (Nutrition Coordinating Center, 2014). A single, 24-h dietary recall is recommended to compare mean dietary intake between two groups (US National Cancer Institute, 2019).
Dietary outcomes were mean daily intake in cup equivalents (cups per 1000 kcals) of fruit, vegetables, and both combined (F& Vs); mean daily kilocalories; and Healthy Eating Index (HEI) 2010 score (Guenther et al., 2013; Guenther et al., 2014). The HEI 2010 score is comprised of 12 components, which includes nine adequacy components (total fruit, whole fruit, total vegetables, greens and beans, whole grains, dairy, total protein foods, seafood and plant proteins, and fatty acids) and three moderation components (refined grains, sodium, empty calories). For each component, as described in detail elsewhere (Guenther et al., 2013), participants receive a score depending on their dietary intake. Component scores are summed and can range from 0 to 100, with higher scores indicating a higher quality diet.
Weight and body mass index (BMI).
Staff persons used professionally calibrated electronic scales and stadiometers (Seca North America, Chino, California) to measure weight and height without shoes. BMI was computed as weight in kg/height in m.2
Participant and household characteristics.
Participants self-reported their own and their households’ characteristics of age; race and Hispanic ethnicity; marital status; education; self-rated health (5, excellent to 1, poor); household income from all sources; SNAP benefits; number of people in the home for whom participant shopped; and presence of children in the home.
Household food security.
A valid and reliable 18-item questionnaire provided categories of high, marginal, low, and very low food security in the past 12 months (Bickel et al., 2000).
Self-efficacy for eating F& Vs was the summed score of four items (Watters et al., 2007). Cronbach’s alpha = .75.
Social support for healthy eating was the summed score of four items (Watters et al., 2007). Cronbach’s alpha = .80.
Physical activity was a single item: In the past week, on how many days have you done a total of 30 min or more of physical activity which was enough to raise your breathing rate? The item has good classification agreement (kappa = .63) and concurrent validity (Milton et al., 2011).
Fast food was a single item: During the past 7 days, how many times did you eat a meal or snack from a fast food place? None, 1 or 2 times, 3 or 4 times, 5 or more times. (Adapted from US Department of Education, 2004).
Perceived neighborhood food environment was the mean of three items (Mujahid et al., 2007) (large selection of fresh F&Vs available, F&Vs are high quality, large selection of low-fat products available) rated from 1 = strongly disagree to 5 = strongly agree. It has good test-retest reliability (ICC=.71) (Ma et al., 2013). Cronbach’s alpha was .84.
Heard of the food hub was a single item: Before today, had you heard about the [Food Hub name]? Yes, No.
Impression of the food hub.
[If yes above] What is your overall impression of the [Food Hub name]? Positive, neutral, negative, or don’t know much about it.
FH Farmers’ market shopping and grocery store shopping. Self-reported shopping in the previous calendar year (none versus one or more times) and usual number of times per month.
The food environment
Food environment data were collected to confirm comparability between the two communities across the study period. Participants’ addresses were geocoded and a ground truthing procedure verified the location of all food retail outlets and fast food (limited service) restaurants within a one-mile buffer around the participants’ addresses (Environmental Systems Research Institute , 2016). Staff persons recorded the Global Positioning System coordinates, name, type of store or restaurant, and address of each outlet during May–June of 2014, 2015, and 2016. Procedural and validation details have been published (Liese et al., 2017). We computed the combined mean number of grocery stores (including supermarkets, smaller grocery stores, supercenters, and warehouse clubs) and the mean number of fast food outlets within the buffer.
Food store types most frequented by participants.
At the T1-T3 interviews, participants named the food stores they had shopped first, second, and third most often during the previous year. Staff persons identified the store type. We rank ordered the primary, secondary, and tertiary stores combined for each year for each type to identify the top three store types.
Foods sold at the FH grocery store.
We conducted food audits in February 2015 and April 2016. A trained staff person used a standardized audit form to record the numbers of products by type sold at the FH grocery store (i.e., fruits and vegetables, meats, eggs, dairy, soft drinks, grains and beans).
SNAP sales.
We tracked SNAP sales and transactions (i.e., SNAP customers) at the FH’s farmers’ market as a proxy measure of the market’s reach to low-income customers over the study period. To quantify SNAP sales and transactions before and after the farmers’ market’s move to the FH site in November of 2014, we obtained monthly electronic reports from the SNAP payment processing company for 2013–2016. We could not identify study participants; therefore, the analysis included all SNAP customers. In the Comparison community, the market manager reported SNAP sales as annual totals.
The FH’s small grocery store provided internal records of SNAP sales from December 2015 to December 2016. There was no comparable store in the Comparison community.
2.8. Data analysis
Data management and analyses used SAS software v9.4 (Copyright SAS Institute, Cary, NC, 2017). We estimated descriptive statistics to examine sample characteristics and data distribution and chi-squared, Fisher’s exact, and t tests to compare characteristics by community group. We computed t-tests to compare the communities on food stores and fast food outlets at T1 with the Saitherwaite-approximate t statistic and used General Linear Models to obtain least-squares means of food stores and fast food outlets in the 2 communities at T2 and T3, adjusted for T1.
Participants with baseline data for a given outcome and complete data on all included control variables were included in the outcomes models. Pregnant women (n = 5) were excluded from energy intake, weight, and BMI models. We estimated linear growth models to examine changes in the primary outcomes of dietary quality (HEI 2010), F&V consumption (combined and separately), energy intake, weight, BMI, and perceived neighborhood food environment by community group. Unlike traditional methods for analyzing longitudinal data (e.g., multiple regression or repeated measures ANCOVA), growth models do not require complete data and can accommodate variability across participants on the amount of time between data collection points. Rather than examine change between time points (i.e., difference scores), growth models examine change as a continuous process over time (Hox, 2010; Luhman and Eid, 2013; Luke, 2004). Within each model, the focus was the time by community interaction, which reflects whether changes over time differed between community groups. The significance level for the interaction term was set at p < .05. We calculated effect size as Cohen’s d (Cohen, 1998). We also performed a sensitivity analysis to compare growth model results to results from equivalent difference-in-difference models.
We also examined changes in self-reported shopping at participants’ local farmers’ market (FH or Comparison area) (none versus ≥1 time in the previous calendar year), via generalized linear growth models, also focused on the time by community interaction. We also examined change in the FH group only for shopping at the mobile market and FH grocery store, and in the Comparison group only, change in shopping at a farmers’ market outside of the study area. Shopping models were adjusted for age.
The analysis approach for the primary outcomes models included steps to reduce error and control for effects related to group nonequivalence (Reichardt, 1979). While disciplines differ regarding control variables to rule out alternative explanations, only alternatives with “serious empirical or experiential support” should be considered (Shadish et al., 2002, pp.16–17). Our approach was to measure variables with theoretical or empirical support in the literature for associations with our outcomes, to assess those potential control variables’ association with each study outcome, to use community-level matching to achieve similar settings, and to measure each outcome at baseline.
We computed correlation coefficients and multiple regression models to assess potential control variables prior to the estimation of linear growth models. To minimize redundancy among control variables while adjusting for group non-equivalence, we used 3 inclusion criteria: the groups must differ significantly at T1 on the variable, the variable must be associated with the dependent variable(s) at r ≥ 0.20, and there must be lack of multicollinearity among the set of potential control variables. Variance inflation factors ≤2 from adjusted preliminary multiple regression models indicated no multicollinearity concerns.
Only age met the criteria in relation to some of the outcomes and was included in some of the final models. The control variables included in each model are shown in the notes below the tables. For the readers’ information, we also show results from the fully adjusted models in a supplemental table, which include control variables that did not meet our final inclusion criteria.
In addition to participant-level outcomes, we examined changes in the FH farmers’ market SNAP sales and transactions. We compared sales only for market months common to all four years of data. We first estimated an interrupted time series model. Because the data did not reveal significant levels of autocorrelation, we then examined yearly differences in SNAP sales and transactions using one-way ANOVA.
3. Results
3.1. Enrollment and retention
The baseline sample was 527 (265 FH, 262 Comparison). Participants from the expanded study area accounted for 15.5% of the FH and 14.1% of the Comparison groups. Relative to T1, there was 82.6% and 84.0% retention at T2 and 75.5% and 79.4% retention at T3 for the FH and Comparison groups, respectively (totals of 83.3% of T1 retained at T2, n = 439, and 77.4% of T1 retained at T3, n = 408); thus the final sample size goal of n ≥ 200 per group was achieved. See Fig. 1 for details of enrollment and retention and reasons for attrition.
Fig. 1.


Eligibility, enrollment and retention in the evaluation of a food hub.
3.2. Participant characteristics and group comparability
Participants lived in highly disadvantaged circumstances. Overall the groups were very similar, and group differences were small. As shown in Table 1, the FH group had slightly lower fruit intake, but the groups were not significantly different on any other dietary outcome or BMI. There were some small, significant differences: the FH group was younger, included a lower proportion of African-Americans and people living in a LILA tract. They had slightly higher social support for healthy eating, a less positive food environment perception, and a participating shopper who shopped for slightly more people.
Table 1.
Characteristics of Food Hub and Comparison Community Participants and their Households at Baseline (n = 527).
| Participant characteristics | Food hub (n = 265) |
Comparison (n = 262) |
Test statistic |
|||
|---|---|---|---|---|---|---|
| n | % | n | % | χ2(df) | p | |
| Gender: Women Education | 201 | 77.0 | 215 | 82.1 | 2.09 (1) | .15 |
| <High school diploma | 90 | 34.0 | 73 | 27.9 | 6.97 (3) | .07 |
| High school/GED | 101 | 38.1 | 100 | 38.2 | ||
| Some college | 66 | 24.9 | 69 | 26.3 | ||
| College ≥4 years | 8 | 3.0 | 20 | 7.6 | ||
| Marital status | ||||||
| Married or unmarried couple living together | 51 | 19.3 | 38 | 14.5 | 2.17 (1) | .14 |
| Divorced, widowed, separated, never married | 213 | 80.7 | 224 | 85.5 | ||
| Self-rated health | ||||||
| Excellent | 23 | 8.7 | 19 | 7.28 | 8.5 (4) | .07 |
| Very Good | 31 | 11.7 | 46 | 17.62 | ||
| Good | 84 | 31.7 | 98 | 37.55 | ||
| Fair | 102 | 38.5 | 82 | 31.42 | ||
| Poor | 25 | 9.4 | 16 | 6.13 | ||
| Fisher’s exact testa | p | |||||
| Raceb | ||||||
| African American/Black | 236 | 89.1 | 251 | 95.8 | .02 | |
| White | 20 | 7.6 | 7 | 2.7 | ||
| > 1 race and all others | 9 | 3.4 | 4 | 1.5 | ||
| BMI weight category | ||||||
| Underweight (<18.5) | 4 | 1.5 | 5 | 1.9 | .16 | |
| Recommended (18.5–24.9) | 62 | 23.8 | 42 | 16.1 | ||
| Overweight (25.0–29.9) | 57 | 21.8 | 68 | 26.1 | ||
| Obese (≥30.0) | 138 | 52.9 | 145 | 55.9 | ||
| Participant characteristics | Food hub (n = 265) |
Comparison (n = 262) |
Test statistic |
|||
| n |
M SD |
n |
M SD |
t | p | |
| Age, years | 265 | 50.5 | 261 | 54.1 | −2.8 | <.01 |
| 14.9 | 13.6 | |||||
| Self-efficacy for eating F&V (0–40) | 265 | 30.4 | 262 | 30.8 | −0.6 | .58 |
| 8.4 | 8.8 | |||||
| Social support for healthy eating (4–12) | 265 | 7.8 | 262 | 7.1 | 3.3 | <.01 |
| 2.5 | 2.1 | |||||
| F&V ½-c. servings/day | 241 | 3.7 | 229 | 3.8 | −0.4 | .70 |
| 3.3 | 2.9 | |||||
| cup equivalents/day | 1.1 | 1.2 | −0.9 | .37 | ||
| 1.2 | 1.0 | |||||
| Fruits ½-c. servings/day | 241 | 1.1 | 229 | 1.5 | −2.0 | .04 |
| 1.9 | 2.0 | |||||
| cup equivalents/day | 0.4 | 0.5 | −2.4 | .02 | ||
| 0.6 | 0.7 | |||||
| Vegetables ½-c. servings/day | 241 | 2.5 | 229 | 2.3 | 1.2 | .22 |
| 2.4 | 2.0 | |||||
| cup equivalents/day | 0.7 | 0.7 | 0.8 | .43 | ||
| 0.8 | 0.6 | |||||
| Healthy Eating Index-2010 (max = 100) | 241 | 47.7 | 229 | 49.7 | −1.7 | .10 |
| 12.7 | 13.4 | |||||
| Energy, kcals per day | 241 | 1850.5 | 229 | 1765.7 | 1.0 | .33 |
| 998.5 | 874.2 | |||||
| Weight, lbs. | 261 | 196.1 | 261 | 196.1 | −0.0 | 1.00 |
| 57.9 | 52.6 | |||||
| Participant characteristics | Food hub (n = 265) |
Comparison (n = 262) |
Test statistic |
|||
| n |
M SD |
n |
M SD |
t | p | |
| Body mass index (kg/m2) | 261 | 32.5 | 261 | 32.4 | 0.1 | .93 |
| 9.3 | 8.6 | |||||
| Physical activity (days in past week, ≥ 30 min) | 265 | 3.5 | 262 | 3.2 | 1.4 | .16 |
| 2.6 | 2.5 | |||||
| Perceived neighborhood food environmentc | 265 | 2.4 | 262 | 2.8 | −5.0 | <.001 |
| 0.9 | 1.0 | |||||
| Household characteristics | Food hub (n = 265) | Comparison (n = 262) | Test statistic | |||
| n | % | n | % | χ2(df) | p | |
| Household food security, past 12 months | ||||||
| High | 37 | 14.0 | 51 | 19.5 | 4.2 (3) | .24 |
| Marginal | 59 | 22.3 | 52 | 19.9 | ||
| Low | 82 | 30.9 | 87 | 33.2 | ||
| Participant characteristics | Food hub (n = 265) |
Comparison (n = 262) |
Test statistic |
|||
| n |
M SD |
n |
M SD |
t | p | |
| Very low | 87 | 32.8 | 72 | 27.5 | ||
| Anyone in home received | ||||||
| SNAP in the past 12 mo. | 168 | 63.9 | 175 | 66.8 | 0.5 (1) | .49 |
| Income, past year (USD) | ||||||
| $0 to $9999 | 120 | 47.4 | 120 | 46.2 | 5.1 (2) | .08 |
| $10,000 to $19,999 | 88 | 34.8 | 74 | 28.5 | ||
| ≥$20,000 | 45 | 17.8 | 66 | 25.4 | ||
| Lives in a low-income, low access census tractd | 203 | 76.6 | 232 | 88.5 | 13.1 (1) | <.001 |
| Household characteristics | Food hub (n = 265) |
Comparison (n = 262) |
Test statistic |
|||
| n | % | n | % | χ2 (df) | p | |
| Transportation to primary food store | ||||||
| Own vehicle | 99 | 40.7 | 122 | 48.6 | 3.1 (1) | .08 |
| Other modes of transporte | 144 | 59.3 | 129 | 51.4 | ||
| n | M SD | n | M SD | t | P | |
| No. people in home for whom participant shops | 265 | 2.4 | 262 | 2.1 | 2.4 | .02 |
| 1.5 | 1.2 | |||||
| 1.3 | 1.2 | |||||
Abbreviations: F&V = fruits and vegetables, GED = general education diploma, BMI = body mass index, SNAP = Supplemental Nutrition Assistance Program, FH=Food Hub.
Notes. Unadjusted data. Columns of percentages may not sum to 100 because of rounding. Columns showing frequencies may not sum to 265 (food hub) and 262 (comparison) because of small amounts of missing data or skip patterns in the questions that excluded some participants.
A cup equivalent is the number of cups per 1000 kcals of energy intake.
When any cell size was less than 5, a Fisher’s exact test of independence was used.
Among FH participants, two reported American Indian/Alaska Native and seven reported and more than one race; among Comparison, four reported more than one race. Two FH and three Comparison participants reported Hispanic ethnicity.
Higher mean score (1–5) means greater agreement with healthy food environment items.
Low income/low access (LILA), i.e., an urban “food desert,” is defined here as census tracts with ≥20% of the population below the federal poverty level and ≥33% living >1 mile from a supermarket.
Other modes of transport were riding with someone else, walking, riding a bicycle, taking a bus, or taking a taxi.
Data from the study participants (see Table 1) showed similarity to the census tract populations in the two recruitment areas on individual and household characteristics. Similar to the participants, the population characteristics were majority African Americans (72.5% FH, 94.5% Comparison), with large percentages of households living below poverty (52.2% FH, 41.2% Comparison) and having no vehicle (43.4% FH, 33.2% Comparison). The majority of participants were women and not living with a spouse or partner; similarly, single-female-headed households were the majority in both communities overall (FH 80.5%, Comparison 69.1%) (US Census Bureau, 2011). The majority of study participants were overweight or obese. County-level estimates showed that the majority of residents in both counties were overweight or obese (FH 57.7%, 95% CI = 44.1–71.4% and Comparison 67.6%, 95% CI = 53.5–81.6%) (South Carolina Department of Health and Environmental Control, 2011).
A comparison of study participants retained and not retained at T2 and at T3 found that at neither time did they differ significantly (p < .05) on education, gender, marital status, SNAP benefits, household food security, household income, or BMI. Regarding race at T2, 87.5% of participants not retained versus 93.4% of those retained were African American (p = .02). Those not retained at T2 were younger (mean = 44.8 years, SD = 14.6) on average than those retained (mean = 53.8 years, SD = 13.8) (p < .001). Participants not retained were less likely to have no children in the household (58.0%) than retained participants (69.0%) (p = .04).
At T3, those not retained and those retained remained similar on race (86.6% and 94.1% African American, respectively, p < .001). Participants not retained at T3 were younger (mean = 47.2 years, SD = 15.6) on average than those retained (mean = 53.8 years, SD = 13.6) (p < .001).
3.3. Comparability of the community food environment and the most frequented food stores
At T3, two Comparison tracts had changed status: one became LILA while one was no longer LILA (US Department of Agriculture, 2017), but these changes affected only six participants. Analysis of geocoded data on grocery stores and fast food locations within a 1-mile buffer around participants’ homes revealed close comparability between communities and constancy across time. There was no difference at T1 on mean grocery stores within a mile (FH, M = 0.24, se = 0.03; Comparison, M=.18, se = 0.03; t = 1.33, p = 0.19). Least squares (LS) means for grocery stores within a mile, adjusted for T1, were not significantly different at T2 (FH M = 0.29, se = 0.03; Comparison M = 0.23, se = 0.03; t = −1.31, p = 0.19) or T3 (FH M = 0.19, se = 0.03; Comparison M = 0.18, se = 0.02; t = −0.35, p = 0.72). As expected in mainly LILA census tracts, means were <1.
There was no difference between communities on mean fast food outlets within a mile at T1 (FH M = 4.22, se = 0.20; Comparison M = 4.36, se = 0.23; t = −0.46, p = 0.65). LS means for fast food, adjusted for T1, were different at T2 (FH M = 4.50, se = 0.17; Comparison M = 4.96, se = 0.16; t = 2.00, p = 0.05) and T3 (FH M = 3.88, se = 0.18; Comparison M = 4.38, se = 0.17; t = 4.20, p = 0.04); however, the difference was small, about 0.5 fast food outlet. Further, the percentage of participants who self-reported eating fast food one or more times in the past seven days (both groups ≥60%) did not differ significantly during any year, p values ≥ .08.
The top three types of grocery stores most frequented did not change throughout the study period. Primary, secondary, and tertiary stores combined included a combination of supermarkets, a supercenter, and a smaller grocery store in both communities. At T3, few participants reported a farmers’ market as their primary (n = 1 FH), secondary (n = 2 FH), or tertiary (n = 2 FH, n = 2 Comparison) store, while none did so at T1 or T2.
3.4. Primary outcomes
Table 2 shows the results of the final linear growth models. There were small, significant differences (time by community interaction) between the 2 groups over time for F&V intake (b = −0.14, se = 0.07, p = .04, d = −0.23) and perceived neighborhood food environment (b = 0.13, se = 0.05, p = .01, d = 0.25) only.
Table 2.
Linear growth models examining change over time by community for food hub evaluation outcomes.
| Final models |
Healthy Eating Indexa (n = 526) |
Fruits and vegetablesb (cup equivalent) (n = 527) |
Fruitsb (cup equivalent) (n = 527) |
Vegetableb (cup equivalent) (n = 527) |
Energya intake, kcals (n = 517) |
Weight, lbsc (n = 517) |
BMIc (n = 517) |
Perceived neighbor-hood food environ-mentd (n = 527) |
|---|---|---|---|---|---|---|---|---|
| Fixed effects | ||||||||
| Intercept | ||||||||
| b | 50.38 | 1.21 | 0.52 | 0.69 | 1772.75 | 196.14 | 32.42 | 2.82 |
| se (b) | 0.79 | 0.07 | 0.05 | 0.05 | 60.01 | 3.44 | 0.55 | 0.06 |
| 95% CI | 48.83, 51.93 | 1.06, 1.35 | 0.43, 0.61 | 0.58, 0.79 | 1654.46, 1890.04 | 189.38, 202.90 | 31.33, 33.51 | 2.70, 2.94 |
| p value | <.001 | <.001 | <.001 | <.001 | <.001 | <.001 | <.001 | <.001 |
| Time | ||||||||
| b | 0.21 | 0.13 | 0.10 | 0.03 | −16.35 | 0.13 | −0.01 | 0.08 |
| se (b) | 0.53 | 0.05 | 0.03 | 0.04 | 34.88 | 0.55 | 0.09 | 0.04 |
| 95% CI | −0.83, 1.24 | 0.03, 0.22 | 0.04, 0.17 | −0.04, 0.10 | −84.83, 52.13 | −0.94, 1.20 | −0.18, 0.17 | 0.002, 0.15 |
| p value | .70 | .01 | .001 | .45 | .64 | .81 | .94 | .04 |
| Community | ||||||||
| b | −1.94 | −0.05 | −0.15 | 0.09 | 53.11 | −2.40 | −0.33 | −0.43 |
| se (b) | 1.11 | 0.10 | 0.06 | 0.07 | 84.77 | 4.89 | 0.79 | 0.08 |
| 95% CI | −4.13, 0.24 | −0.25, 0.15 | −0.27, −0.02 | −0.05, 0.24 | −113.29, 219.50 | −12.01, 7.22 | −1.88, 1.23 | −0.60, −0.26 |
| p value | .08 | .60 | .02 | .20 | .53 | .62 | .68 | <.001 |
| Time*Community | ||||||||
| b | −0.07 | −0.14 | −0.06 | −0.08 | 13.71 | 0.88 | 0.16 | 0.13 |
| se (b) | 0.74 | 0.07 | 0.05 | 0.05 | 49.37 | 0.72 | 0.12 | 0.05 |
| 95% CI | −1.53, 1.39 | −0.28, −0.01 | −0.15, 0.03 | −0.19, 0.02 | −83.18, 110.61 | −0.54, 2.31 | −0.08, 0.39 | 0.03, 0.24 |
| p value | .92 | .04 | .18 | .12 | .78 | .22 | .19 | .01 |
| effect size: d | −0.01 | −0.23 | −0.16 | −0.18 | 0.03 | 0.02 | 0.03 | 0.25 |
| Random effects | ||||||||
| Intercept | ||||||||
| Variance | 48.35 | 0.41 | 0.12 | 0.14 | 399,257 | 2939.47 | 76.30 | 0.41 |
| se | 6.36 | 0.05 | 0.02 | 0.02 | 39,804 | 186.92 | 4.87 | 0.04 |
| p value | <.001 | <.001 | <.001 | <.001 | <.001 | <.001 | <.001 | <.001 |
Models adjusted for age. Fruit and vegetable intake is in cup equivalents, mean daily cups eaten per 1000 kcals of dietary intake. Energy intake is mean kcals per day. Body mass index is mean weight in kg divided by height in meters2. Perceived neighborhood food environment has a possible mean score of 1 to 5, with higher mean score representing a more positive perception.
Sample sizes for each model include participants with complete data on all covariates included in the model and/or with data for at least one time point. Pregnant women (n = 5) were excluded from energy intake, weight, and body mass index models.
The effect size for Time*Community interaction shown is Cohen’s d, interpreted as the standardized difference between intervention means. If d is < 0.20 standard deviations, the effect is not considered meaningful even if the p value is < .05. (<0.2 is considered small, 0.5 medium, and 0.8 large). Negative effect sizes shown above indicate that the difference was the opposite of the hypothesis that the FH group’s improvement would exceed that of the comparison group.
Comparison participants showed a small increase in F&V intake (0.25 cup equivalent), while FH participants remained relatively unchanged (see Fig. 2). Comparison participants had a higher perceived neighborhood food environment score at T1, but the FH participants’ score increased significantly more (i.e., increased positive impression) (see Fig. 3). Fruit consumption increased in both groups, but the nonsignificant time by community interaction indicated no difference in the change between the two groups (b = −0.06, se = 0.05, p = .18, d = −0.16). There were no significant effects for any other primary outcome – effect sizes were near zero.
Fig. 2.
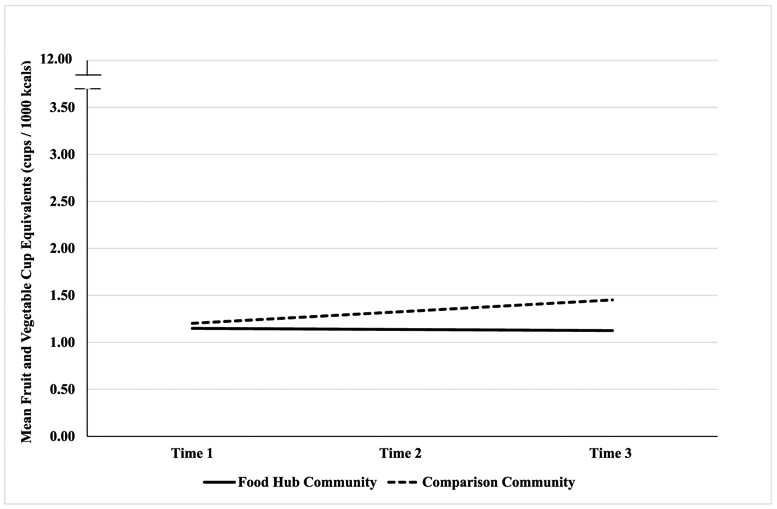
Group by time interaction for fruit and vegetable intake from a growth model analysis.
Fig. 3.

Group by time interaction for perceived food environment from a growth model analysis.
Results from the difference-in-difference models mirrored those from the growth model analyses, indicating that the results were not sensitive to the choice of model parameterization.
Results of the fully adjusted linear growth models are shown in Supplemental Table B. There were minimal differences between the final models and the fully adjusted models.
3.5. Secondary outcomes
3.5.1. Shopping at the food hub and comparison sites’ farmers’ markets
FH participants reported if they had shopped at the FH farmers’ market and Comparison participants at their local farmers’ market. Unadjusted percentages of those who reported shopping at least once in the previous years (calendar years 2013–2015) were 24%, 29% and 36% for Food Hub versus 15%, 17% and 22% for Comparison. Among these shoppers, the majority had shopped at their farmers’ market less than once a month. While both groups increased over time, the time by community interaction was not significant (b = 0.06, se = 0.20, p = 0.77, 95% CI = 0.71, 1.57).
At the time of their T3 interviews, the FH farmers’ market had been open since January of 2016 (4 to 7 months’ exposure depending interview date), and 23% reported they had shopped there at least once since January. The Comparison farmers’ market did not open in 2016; however, it merged with another farmers’ market located 0.5 miles away. At T3, (one to four months’ market exposure), 6% of participants reported shopping at least once there since April.
3.5.2. Shopping at the food Hub’s mobile market
The mobile market made the following number of stops (dates the truck was at the locations) in the indicated number of census tracts from among twelve total tracts within the study area: 2013, 18 stops in four tracts; 2014, 43 stops in seven tracts; and 2015, 63 stops in five tracts. While stops more than doubled in 2014 and tripled in 2015 from 2013, few FH study participants had ever shopped at the mobile market (≤13% during all three years). There was no significant change over time in shopping (b = −0.24, se = 0.25, p = 0.34, 95% CI = −0.72, 0.25). There was no mobile market in the Comparison community.
3.5.3. Shopping at the food hub grocery store
The small grocery store sold only food products. The number of items offered changed between audits in February 2015 and April 2016, offering twice the varieties of fruits and vegetables, as follows: fresh fruit and vegetables: 18, 40 varieties; fresh and frozen meat, eggs, and cheese: 8, 16 products; grains and beans: 0, 5 products; sugar sweetened drinks: 2, 1 products; bottled water: 1, 2 products.
Unlike the farmers’ market, which existed prior to the FH’s opening, the small grocery store did not exist until November 2014; therefore, there were two data points, T2 (shopping during 2014, 41 days open), and T3 (shopping during 2015, 279 days open). Unadjusted participant frequencies for shopping at least once were 17.8% and 31.5%, respectively. The increase was significant (b = 3.68, se = 0.94, p = 0.0001, 95% CI = 1.82, 5.54).
3.5.4. SNAP transactions and sales at the food Hub’s farmers’ market
Total SNAP transactions (i.e., customers) and sales during May–December, market months that were common to all four years, were the following: 2013, n = 194, $3917; 2014, n = 397, $8070; 2015, n = 666, $13,985; and 2016, n = 791, $15,824. All SNAP transactions and sales for all months in which markets were held in each year, were as follows: 2013, n = 194, $3917; 2014, n = 418, $8500; 2015, n = 724, $15,186; and 2016, n = 927, $18,351.
Mean monthly SNAP sales and transactions for May–December of 2013–2016 are shown in Fig. 4. SNAP sales and transactions for November and December of 2014 were treated as post-food hub opening values in the interrupted time series model, which did not reveal significant differences in sales or transactions over time. The slope of the trend line after the FH opening, when the market moved to the FH site, did not exceed what would be expected based on natural growth, given the sales and transactions prior to the relocation.
Fig. 4.
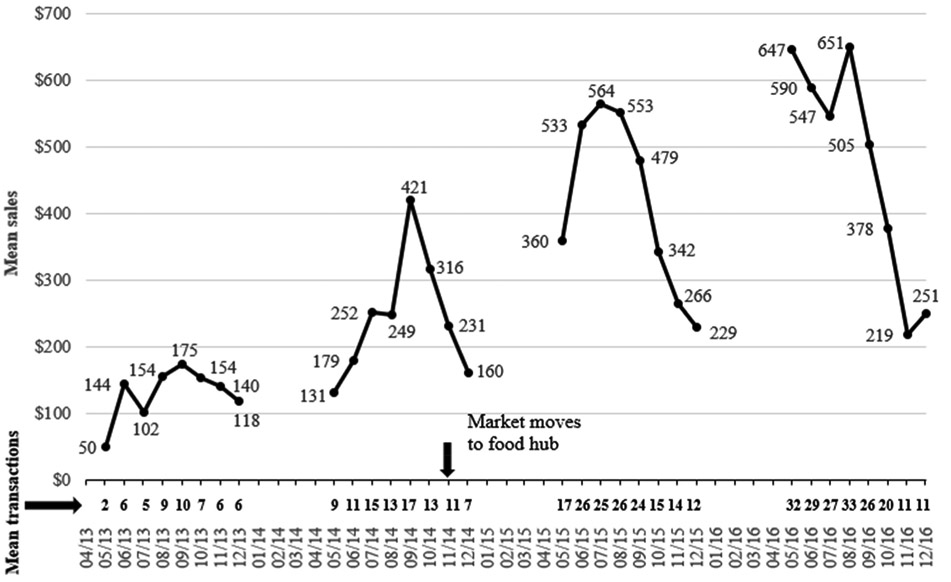
Mean monthly SNAP sales and transactions at the farmers’ market in the food hub community across four years.
Notes. SNAP is the Supplemental Nutrition Assistance Program. Includes Saturday morning sales for market months common to all four years, in US dollars.
Results from a one-way ANOVA across years revealed significant differences in mean monthly sales (Welch’s F = 19.77 (3, 13.45), p = .0001) and mean monthly transactions (Welch’s F = 19.85 (3, 14.43), p = .0001) between years. Specifically, Tukey’s Studentized Range (HSD) Tests compared SNAP sales during each of the post-opening years of 2015 (M = $415.67) and 2016 (M = $473.43) to sales during each of the pre-opening years of 2013 (M = $129.52) and 2014 (M = $242.22). All comparisons were significant. The same pattern was found for transactions. The 2015 (M = 19.84) and 2016 (M = 23.59) transaction means were both significantly greater than those in 2013 (M = 6.32) and 2014 (M = 11.89). Thus, transactions and sales did significantly increase, but the increase cannot be attributed to the farmers’ market’s move to the FH location. The Comparison community’s farmers’ market manager provided the following total annual SNAP sales: 2013, $49; 2014, $0; and 2015, missing.
3.5.5. SNAP transactions and sales at the small grocery store
USDA approval to accept SNAP payments took longer than anticipated. SNAP payment acceptance began on December 18, 2015. Because of insufficient data points we did not perform a time series analysis. Between December 18, 2015 through December 21, 2016, there were 303 transactions and $3790 in SNAP sales, with mean transactions per month of 23.3 (SD = 15.4) and mean sales per month of $291.6 (SD = $15.4).
3.6. Other potential influences on study outcomes
3.6.1. Awareness and impressions of the food hub
At T2 (6 months after the opening) and T3 (18 months after the opening), 75% and 90% reported they had heard of the FH, respectively. At T2 and T3 respectively, 56% and 54% had an overall positive impression, 6% and 8% were neutral, 3% and 2% negative, while 35% and 36% “didn’t know much” about the FH.
3.6.2. SNAP incentive programs
The FH’s farmers’ market provided a SNAP incentive program in 2013 and added a second one in 2014 (Sharpe et al., 2015). Incentive levels varied over time, but overall, purchasing power doubled.
3.6.3. A farmers’ market outside of the comparison study area
There was a Monday-Saturday year-round farmers’ market outside of the Comparison study area, four miles from the farmers’ market located in the study area and unaffiliated with it (both the Comparison site’s small market within the study area and FH’s market were open only a half-day per week). The majority of participants reported shopping there at least once (53%, 64%, and 62%, unadjusted) in 2013–2015. Increases over time were significant (b = 0.30, se = 0.13, p = 0.03, 95% CI = 0.03, 0.56); however, among those who had shopped there at least once, half or more shopped less than once a month in each year. At the T3 interviews (May-August, 2016), 21% had shopped there “so far” in 2016.
Open since 1983, the market made no recent changes that we could identify that would explain the increase in participants’ self-reported shopping over the study period nor can we link the small increase in participants’ F&V intake to this market, but it cannot be eliminated as a potential confounder.
3.6.4. Other services and programs
Using online searches, phone calls, and in-person interviews during 2014–2016, we created an inventory in both communities of programs and services that could affect weight or dietary intake. Few programs recruited specifically from the study areas. There were 14 sources of food, nutrition education, or exercise in the FH community and 4 in the Comparison community. Participation numbers were not available. Based on the numbers of programs alone, any effect on diet or BMI likely would have favored the FH participants.
3.7. Summary of results
There were no significant changes in the FH group in diet quality, energy intake, weight or BMI compared to a matched comparison group - food hub effects were near zero for these outcomes – although the FH group’s perception of the food environment improved significantly relative to the Comparison group. Self-reported farmers’ market shopping at least once in the previous year increased for both groups but remained relatively low across all years. Mobile market stops in the FH study area increased, but self-reported mobile market shopping did not. The proportion of participants who had shopped at least once at the FH grocery store increased significantly from 2014 to 2015; however, because the store opened in November 2014, the opportunities for shopping were much greater in 2015.
SNAP transactions and sales among all SNAP customers at the FH farmers’ market increased significantly in the two years following the market’s move to the FH, suggesting that the market was succeeding in reaching customers of low income; however, the time series analysis did not show that the increase resulted from the relocation to the FH site. Farmers’ market SNAP sales have consistently increased from $67 in 2009 to $18,351 in 2016. The introduction of SNAP incentives programs in 2013 and 2014 may have boosted sales during the study period (Sharpe et al., 2015).
4. Discussion
We evaluated the effects of a change in the community food environment in a LILA community. This study has limitations common to non-randomized designs and behavioral self-report data; however, the methodology benefitted from careful consideration of challenges particular to the evaluation of food environment changes (Taillie et al., 2017). Neither random selection nor random assignment were possible, so selection bias is a potential issue; however, community-level matching produced participant samples that were closely comparable to each other and to their respective communities on characteristics that could differentially affect outcomes.
Delays in both the FH’s opening and the grocery store’s approval to accept SNAP payments may have affected outcomes, as these delays decreased the participants’ potential FH exposure period. We assessed and rejected several other potential influences on outcomes (see section 3.6) and could not rule out the potential influence of a farmers’ market located outside of the comparison study area on the comparison group’s small, but significant, increase in F&Vs.
While a food hub initiative with the goal of community economic development would not necessarily be expected to improve dietary intake and decrease obesity, the elimination of a food desert was one of the initiative’s four objectives, and the project did expand spatial access to and availability of fresh fruits and vegetables. The farmers’ market continued its history of growth in SNAP sales, even though this could not be attributed to relocation to the food hub. SNAP incentive programs greatly increased recipients’ buying power.
Besides supporting access to healthy food, food hubs in the US have reported growth in creating local jobs, providing markets to small and mid-sized local food producers, and promoting sustainable agricultural practices (Colasanti et al., 2018). While the FH study’s focus did not include the initiative’s objectives of business development, job creation and training, and community revitalization, these actions may also affect community well-being.
This study contributes to a small body of food environment intervention studies that have not found the hypothesized effects on diet and BMI. For example, studies of new supermarkets in urban LILA neighborhoods have also found improved food accessibility perceptions but no effects on F&V intake or BMI (Cummins et al., 2014; Dubowitz et al., 2015a). Lack of changes in diet and weight in this and other food environment initiatives challenge the assumption that improving proximity (i.e., geographic/spatial access) to healthy food alone will lead to better diet quality and less obesity. This idea has been the impetus for healthy food access projects, but it warrants reconsideration given that the evidence for eliminating food deserts to improve diet and obesity remains relatively weak. Based on several studies, it appears incorrect to assume that consumers, including residents of food deserts, choose to shop for food in their neighborhood or at the closest supermarket (Drewnowski et al., 2012; Hillier et al., 2011; Dubowitz et al., 2015bDubowitz et al., 2015; LeDoux and Vojnovic, 2013; Sohi et al., 2014). The FH study participants traveled 2.5 miles on average to their primary grocery store, yet the closest supermarket was 1.5 miles away (Liese et al., 2017). Further, the T1 data show that residence in a LILA census tract was not associated with BMI (Liese et al., 2017) or diet (Wilcox et al., 2018), and distances to the participant’s primary and nearest supermarket were not associated with BMI (Liese et al., 2017).
Various studies suggest that social and economic factors may be more or equally as important as spatial access to healthy food in their effects on diet and obesity, though these associations require ongoing study and clarification. In a statewide study of low-income women in Kansas, US, Ford and Dzewaltowski (2011) found that the presence of supermarkets or other food stores did not mediate the association between census tract-level economic deprivation and BMI. In a large study of non-Hispanic black women in California, Gailey and Bruckner (2019) found that an association between low food access and obesity was stronger in neighborhoods of high poverty with high composition of black residents compared low black residents. Drewnowski et al. (2012) found in The Seattle Obesity Study that obesity risk was not associated with distances to the primary or nearest supermarket but was associated with the supermarket prices for a standard market basket.
A study of closures of new grocery stores in North American urban areas with high poverty and few or no grocery stores found that stores had difficulty attracting and retaining a high volume of local consumers (Engler-Stringer et al., 2019). The authors noted that, from an economic perspective, the focus on grocery store proximity is a supply-side approach that does not adequately address demand-side factors (Donald, 2013), such as the food’s affordability and the shoppers’ needs and preferences.
Block and Subramanian (2015) note that “While a variety of factors contribute to income disparities in dietary quality, considerable attention has been focused on poor physical access to healthy foods”p.1. Physical access to healthy food is but one part of the context. Systems and socio-ecological models of obesity recognize the complexity of multiple levels of influence on race- and socioeconomic-based disparities in dietary quality, physical activity, and obesity (Gordon-Larsen and Popkin, 2011). Eliminating food deserts may be one part of the solution, but the most effective mix of population-based approaches to improve diet quality in economically disadvantaged and minority communities is yet to be determined.
Supplementary Material
Acknowledgements
The authors appreciate the contributions from the university-based and local project staff and students and assistance from the Hub City Farmers’ Market, Butterfly Foundation, Northside Development Group, Via College of Osteopathic Medicine, the Soulfully Fit Committee, and partners from many community-based and governmental organizations.
Funding
This work was supported by the National Cancer Institute of the US National Institutes of Health, award number R01CA180336. The content is solely the responsibility of the authors and does not necessarily represent the official views or policies of the National Cancer Institute or the National Institutes of Health.
Footnotes
Declaration of competing interest
None.
Appendix A. Supplementary data
Supplementary data to this article can be found online at https://doi.org/10.1016/j.healthplace.2020.102341.
The Supplemental Nutrition Assistance Program (SNAP) provides nutrition assistance to eligible, low-income US individuals and families, https://www.nutrition.gov/subject/food-assistance-programs/snap SNAP incentives programs increase SNAP recipients’ buying power to encourage purchases at farmers’ markets, https://farmersmarketlegaltoolkit.org/snap/legal-topics/incentives/.
United States census tracts are geographical subdivisions of a county with population of 1200–8000. https://www.census.gov/geo/reference/gtc/gtc_ct.html.
References
- Abeykoon AMH, Engler-Stringer R, Muhajarine N, 2017. Health-related outcomes of new grocery store interventions: a systematic review. Publ. Health Nutr 20, 2236–2248. 10.1017/S1368980017000933. [DOI] [PMC free article] [PubMed] [Google Scholar]
- Abusabha R, Namjoshi D, Klein A, 2011. Increasing access and affordability of produce improves perceived consumption of vegetables in low-income seniors. J. Acad. Nutr. Diet 111, 1549–1555. https://doi.Org/10.1016/j.jada.2011.07.003. [DOI] [PubMed] [Google Scholar]
- Barham J, Tropp D, Enterline K, Farbman J, Fisk J, Kiraly S, 2012. Regional Food Hub Resource Guide (No. 145227). US Department of Agriculture, Agricultural Marketing Service. https://www.ams.usda.gov/sites/default/files/media/Regional%20Food%20Hub%20Resource%20Guide.pdf (Accessed 29 July 2019). [Google Scholar]
- Bickel G, Nord M, Price C, Hamilton W, Cook J, 2000. Guide to Measuring Household Food Security, Revised 2000. US Department of Agriculture, Food and Nutrition Service. https://fhs-prod.azureedge.net/sites/default/files/FSGuide.pdf (Accessed 29 July 2019). [Google Scholar]
- Black C, Moon G, Baird J, 2015. Dietary inequalities:What is the evidence for the effect of the neighbourhood food environment? Health Place 27, 229–242. 10.1016/j.healthplace.2013.09.015. [DOI] [PMC free article] [PubMed] [Google Scholar]
- Blay-Palmer A, Laurier W, Knezevic I, Hayhurst R, 2013. EDITORIAL: constructing resilient, transformative communities through sustainable “food hubs”. Local Environ. 18, 521–528. 10.1080/13549839.2013.797156. [DOI] [Google Scholar]
- Block JP, Subramanian SV, 2015. Moving beyond “food deserts”: reorienting United States policies to reduce disparities in diet quality. PLoS Med. 12 (12), e1001914 10.1371/journal.pmed.1001914. [DOI] [PMC free article] [PubMed] [Google Scholar]
- Boone-Heinonen J, Gordon-Larsen P, Kiefe K, Shikany J, Lewis C, Popkin B, 2011. Fast food restaurants and food stores longitudinal associations with diet in young to middle-aged adults: the CARDIA Study. Arch. Intern. Med 171, 1162–1170. 10.1001/archinternmed.2011.283 (Accessed 23 April 2019). [DOI] [PMC free article] [PubMed] [Google Scholar]
- Bowen DJ, Barrington WE, Beresford SAA, 2015. Identifying the effects of environmental and policy change interventions on healthy eating. Annu. Rev. Publ. Health 36, 289–306. 10.1146/annurev-publhealth-032013-182516. [DOI] [PMC free article] [PubMed] [Google Scholar]
- Cohen RD, 1998. Statistical Power Analysis for the Behavioral Sciences Lawrence Erlbaum Associates, Mahwah, N.J. [Google Scholar]
- Colasanti K, Hardy J, Farbman J, Pirog R, Fisk J, Hamm MW, 2018. Findings of the 2017 National Food Hub Survey East Lansing, MI: Michigan State University Center for Regional Food Systems & The Wallace Center at Winrock International. https://www.canr.msu.edu/resources/2017-food-hub-survey (Accessed 29 July 2019). [Google Scholar]
- Cummins S, Flint E, Matthews SA, 2014. New neighborhood grocery store increased awareness of food access but did not alter dietary habits or obesity. Health Aff. 33, 283–291. 10.1377/hlthaff.2013.0512. [DOI] [PMC free article] [PubMed] [Google Scholar]
- Donald B, 2013. Food retail and access after the crash: rethinking the food desert problem. J. Econ. Geogr 13, 231–237. 10.1093/jeg/lbs064. [DOI] [Google Scholar]
- Drewnowski A, Aggarwal A, Hurvitz PM, Monsivais P, Moudon AV, 2012. Obesity and supermarket access: proximity or price? Am. J. Publ. Health 102, e74–e80. 10.2105/AJPH.2012.300660. [DOI] [PMC free article] [PubMed] [Google Scholar]
- Dubowitz T, Ghosh-Dastidar M, Cohen DA, Beckman R, Steiner ED, Hunter GP, et al. , 2015a. Diet and perceptions change with supermarket introduction in a food desert, but not because of supermaket use. Health Aff. 34, 1858–1868. 10.1377/hlthaff.2015.0667. [DOI] [PMC free article] [PubMed] [Google Scholar]
- Dubowitz T, Zenk SN, Ghosh-Dastidar B, Cohen DA, Beckman R, Hunter G, et al. , 2015b. Healthy food access for urban food desert residents: examination of the food environment, food purchasing practices, diet and BMI. Publ. Health Nutr 18, 2220–2230. 10.1017/S1368980014002742. [DOI] [PMC free article] [PubMed] [Google Scholar]
- Dutko P, Ploeg MV, Farrigan T, 2012. Characteristics and Influential Factors of Food Deserts, ERR-140. US Department of Agriculture, Economic Research Service, https://www.ers.usda.gov/webdocs/publications/45014/30940_err140.pdf?v=41156 (Accessed 29 July 2019). [Google Scholar]
- Engler-Stringer R, Fuller D, Abeykoon AMH, Olauson C, Muhajarine N, 2019. An examination of failed grocery store interventions in former food deserts. Health Educ. Behav 46, 749–754. 10.1177/1090198119853009. [DOI] [PubMed] [Google Scholar]
- Environmental Systems Research Institute (ESRI), 2016. ArcGIS for Desktop, version10.3.1 Computer program, Redlands, CA, USA. [Google Scholar]
- Evans AE, Jennings R, Smiley AW, Medina JL, Sharma SV, Rutledge R, et al. , 2012. Introduction of farm stands in low income communities increases F&V among community residents. Health Place 18, 1137–1143. https://doi.Org/10.1016/j.healthplace.2012.04.007. [DOI] [PubMed] [Google Scholar]
- Ford PB, Dzewaltowski DA, 2011. Neighborhood deprivation, supermarket availability, and BMI in low-income women: a multilevel analysis. J. Community Health 36, 785–796. https://link.springer.com/article/10.1007%2Fs10900-011-9377-3. [DOI] [PubMed] [Google Scholar]
- Freedman DA, Choi SK, Hurley T, Anadu E, Hebert JR, 2013. A farmers’ market at a federally qualified health center improves fruit and vegetable intake among low-income diabetics. Prev. Med 56, 288–292. 10.1016/j.ypmed.2013.01.018. [DOI] [PMC free article] [PubMed] [Google Scholar]
- Gailey S, Bruckner TA, 2019. Obesity among black women in food deserts: an “omnibus” test of differential risk. SSM – Population Health 7, 1–7. 10.1016/j.ssmph.2019.100363. [DOI] [PMC free article] [PubMed] [Google Scholar]
- Glanz K, Sallis J, Saelens B, Frank L, 2005. Healthy nutrition environments: concepts and measures. Am. J. Health Promot 19, 330–333. 10.4278/0890-1171-19.5.330. [DOI] [PubMed] [Google Scholar]
- Gordon-Larsen P, Popkin B, 2011. Understanding socioeconomic and racial/ethnic status disparities in diet, exercise, and weight: underlying contextual factors and pathways. J. Am. Diet Assoc 111, 1816–1819. 10.1016/j.jada.2011.09.017. [DOI] [PMC free article] [PubMed] [Google Scholar]
- Gosh-Dastidar M, Hunter G, Collins RL, Zenk SN, Cummins S, Beckman R, et al. , 2017. Does opening a supermarket in a food desert change the food environment? Health Place 46, 249–256. https://doi.Org/10.1016/j.healthplace.2017.06.002. [DOI] [PMC free article] [PubMed] [Google Scholar]
- Guenther PM, Casavale KO, Reedy J, Kirkpatrick SI, Hiza HA, Kuczynski KJ, et al. , 2013. Update of the healthy eating index: HEI-2010. J. Acad. Nutr. Diet 113, 569–580. 10.1016/j.jand.2012.12.016. [DOI] [PMC free article] [PubMed] [Google Scholar]
- Guenther PM, Kirkpatrick SI, Reedy J, Krebs-Smith SM, Buckman DW, Dodd KW, et al. , 2014. The Healthy Eating Index-2010 is a valid and reliable measure of diet quality according to the 2010 Dietary Guidelines for Americans. J. Nutr 144, 399–407. 10.3945/jn.113.183079. [DOI] [PMC free article] [PubMed] [Google Scholar]
- Haskell D, 2019. The latest direct mail response rate data from DMA will leave you speechless. Direct Marketing Trends, Strategy and Analysis. IWCO Direct Web log post, January 16 https://www.iwco.com/blog/2019/01/16/direct-mail-response-rates-dominate-other-channels/ (Accessed 29 July 2019). [Google Scholar]
- Heval MK, Hammadah M, Ahmed H, Ko Y-A, Topel M, Samman-Tahhan A, Awad M, Patel K, Mohammed K, Sperling LS, Pemu P, Vaccarino V, Lewis T, Taylor H, Martin G, Gibbons GH, Quyyumi AA, 2017. Association between living in food deserts and cardiovascular risk. Circulation: Cardiovascular Quality and Outcomes 10. 10.1161/CIRCOUTCOMES.116.003532 e003532, 1–11. [DOI] [PMC free article] [PubMed] [Google Scholar]
- Hillier A, Cannuscio CC, Karpyn A, McLaughlin J, Chilton M, Glanz K, 2011. How far do low-income parents travel to shop for food? Empirical evidence from two urban neighborhoods. Urban Geogr. 32, 712–729. 10.2747/0272-3638.32.5.712. [DOI] [Google Scholar]
- Hilmers A, Hilmers DC, Dave J, 2012. Neighborhood disparities in access to healthy foods and their effects on environmental justice. Am. J. Publ. Health 102, 1644–1654. 10.2105/AJPH.2012.300865. [DOI] [PMC free article] [PubMed] [Google Scholar]
- Horst M, Ringstrom E, Tyman S, Ward MK, Werner V, Born B, 2011. Toward a more expansive understanding of food hubs. Journal of Agriculture, Food Systems, and Community Development 2, 209–225. 10.5304/jafscd.2011.021.017. [DOI] [Google Scholar]
- Hox JJ, 2010. Multilevel Analysis: Techniques and Applications, second ed. Routledge/ Taylor & Francis Group, New York, NY. [Google Scholar]
- Jennings A, Cassidy A, Winters T, Barnes S, Lipp A, Holland R, Welch A, 2012. Positive effect of a targeted intervention to improve access and availability of fruit and vegetables in an area of deprivation. Health Place 18, 1074–1078. 10.1016/j.healthplace.2012.05.001. [DOI] [PubMed] [Google Scholar]
- Larson N, Story N, Nelson M, 2009. Neighborhood environments: disparities in access to healthy foods in the US. Am. J. Prev. Med 36, 74–81. 10.1016/j.amepre.2008.09.025 e10. [DOI] [PubMed] [Google Scholar]
- LeDoux TF, Vojnovic I, 2013. Going outside the neighborhood: the shopping patterns and adaptations of disadvantaged consumers living in the lower eastside neighborhoods of Detroit, Michigan. Health Place 19, 1–14. 10.1016/j.healthplace.2012.09.010. [DOI] [PubMed] [Google Scholar]
- Levkoe CZ, Hammelman C, Craven L, Dandy G, Farbman J, Harrison J, Mount P, 2018. Building sustainable food systems through food hubs: practitioner and academic perspectives. Journal of Agriculture, Food Systems, and Community Development 8, 107–122. 10.5304/jafscd.2018.082.008. [DOI] [Google Scholar]
- Liese AD, Ma X, Hutto B, Sharpe PA, Bell BA, Wilcox S, 2017. Food shopping and acquisition behaviors in relation to BMI among residents of low income communities in South Carolina. International Journal of Environmental Research and Public Health 14, 1075 10.3390/ijerph14091075. [DOI] [PMC free article] [PubMed] [Google Scholar]
- Luhman M, Eid M, 2013. Studying reaction to repeated life events with discontinuous change models using HLM In: Garson GD (Ed.), Hierarchical Linear Modeling; Guide and Applications. Sage Publications, Inc., Thousands Oaks, CA, pp. 273–290. [Google Scholar]
- Luke DA, 2004. Multilevel Modeling. Sage Publications, Inc, Thousand Oaks, CA. [Google Scholar]
- Ma X, Barnes TL, Freedman DA, Bell BA, Colabianchi N, Liese AD, 2013. Test-retest reliability of a questionnaire measuring perceptions of neighborhood food environment. Health Place 21, 65–69. 10.1016/j.healthplace.2013.01.008. [DOI] [PMC free article] [PubMed] [Google Scholar]
- McGeeney K, 2015. Appending a prepaid phone flag to the cell phone sample. Survey Practice 8, 4 https://www.surveypractice.org/article/2837-appending-a-prepaid-phone-flag-to-the-cell-phone-sample (Accessed 29 July 2019). [Google Scholar]
- Milton K, Bull F, Bauman A, 2011. Reliability and validity testing of a single-item physical activity measure. Br. J. Sports Med 45, 203–208. 10.1136/bjsm.2009.068395. [DOI] [PubMed] [Google Scholar]
- Mujahid M, Diez-Roux A, Morenoff J, Raghunathan T, 2007. Assessing the measurement properties of neighborhood scales: from psychometrics to ecometrics. Am. J. Epidemiol 165, 858–867. 10.1093/aje/kwm040. [DOI] [PubMed] [Google Scholar]
- Nutrition Coordinating Center, 2014. Nutrition Data System for Research 2014 User Manual (Online Manual). University of Minnesota, Minneapolis, MN: Retrieved from. https://drive.google.com/file/d/0B4snm2Q3-ffQbkdHejJ2MWZNWjQ/view (Accessed 22 April 2019). [Google Scholar]
- Pew Research Center, 2015. Advances in telephone survey sampling. Retrieved from. http://www.pewresearch.org/2015/11/18/advances-in-telephone-survey-sampling/ (Accessed 20 April 2019).
- Pitts SBJ, McGuirt JT, Wu Q, Rushing J, Uslan D, Stanley KK, et al. , 2016. Assessing preliminary impact of the North Carolina Community Transformation Grant Project farmers’ market initiatives among rural residents. J. Nutr. Educ. Behav 48, 343–349. 10.1016/j.jneb.2016.03.001. [DOI] [PubMed] [Google Scholar]
- Pitts SBJ, Wu Q, McGuirt JT, Sharpe PA, Rafferty AP, 2018. Impact on dietary choices after a discount supermarket opens in low-income community. J. Nutr. Educ. Behav 50, 729–735. 10.1016/j.jneb.2018.03.002. [DOI] [PubMed] [Google Scholar]
- Reichardt CS, 1979. The statistical analysis of data from nonequivalent group designs, Chapter 4 In: Cook TD, Campbell DT (Eds.), Quasi-Experimentation, Design & Analysis Issues for Field Settings. Houghton Mifflin Company, Boston, pp. 147–206. [Google Scholar]
- Shadish WR, Cook TD, Campbell DT, 2002. Experimental and Quasi-Experimental Designs for Generalized Causal Inference. Houghton Mifflin Company, Boston. [Google Scholar]
- Sharpe PA, Bell BA, Liese AD, Stucker J. SNAP incentives and SNAP purchases at a farmers’ market in a low-access community. American Public Health Association’s, https://apha.confex.com/apha/143am/webprogram/Paper330070.html. [Google Scholar]
- Sohi I, Bell BA, Liu JH, Battersby SE, Liese AD, 2014. Differences in food environment perceptions and spatial attributes of food shopping between residents of low and high food access areas. J. Nutr. Educ. Behav 46, 241–249. 10.1016/j.jneb.2013.12.006. [DOI] [PMC free article] [PubMed] [Google Scholar]
- South Carolina Department of Health and Environmental Control. http://eatsmartmovemoresc.org/pdf/Documents_Reports/Obesity-Burden-Report-2011.pdf.
- Story M, Kaphingst KM, Robinson-O’Brien R, Glanz K, 2008. Creating healthy food and eating environments: policy and environmental approaches. Annu. Rev. Publ. Health 29, 253–272. 10.1146/annurev.publhealth.29.020907.090926. [DOI] [PubMed] [Google Scholar]
- Taillie LS, Grummon AH, Fleischhacker S, Grigsby-Toussanit DS, Leone L, Caspi CE, 2017. Best practices for using natural experiments to evaluate retail food and beverage policies and interventions. Nutr. Rev 75 (12), 971–989. 10.1093/nutrit/nux051. [DOI] [PMC free article] [PubMed] [Google Scholar]
- Thompson CA, Ravia J, 2011. A systematic review of behavioral interventions to promote intake of fruit and vegetables. J. Am. Diet Assoc 111, 1523–1535. 10.1016/j.jada.2011.07.013. [DOI] [PubMed] [Google Scholar]
- US Census Bureau, 2011. 2006-2010 American community survey, 5-year estimates 2011. http://factfinder2.census.gov (Accessed 22 May 2019).
- US Department of Agriculture, 2017. Economic research service. Food access research atlas [2011 archived and 2015 versions]. Last updated May 18, 2017. https://www.ers.usda.gov/data-products/food-access-research-atlas/download-the-data/ (Accessed 29 July 2019).
- US Department of Education, 2004. National center for education statistics. Early childhood longitudinal study. Child food consumption questionnaire. Retrieved. https://nces.ed.gov/ecls/pdf/fifthgrade/childfoodconsumption.pdf (Accessed 8 July 2019). [Google Scholar]
- US National Institutes of Health, 2012. Time-sensitive obesity policy and program evaluation (R01). Funding Opportunity Announcement PAR-12–257. http://grants.nih.gov/grants/guide/pa-files/PAR-12-257.html (Accessed 17 May 2019). [Google Scholar]
- US Office of the Administration for Children and Families, 2016. Office of community services, community economic development-healthy food financing initiative. Last reviewed June 20, 2019. https://www.acf.hhs.gov/ocs/programs/community-economic-development/healthy-food-financing. (Accessed 29 July 2019). [Google Scholar]
- US National Cancer Institute. Dietary assessment primer. Choosing an approach for dietary assessment. Summary tables: recommendations on potential approaches to dietary assessment for different research objectives requiring group-level estimates . National Institutes of health. https://dietassessmentprimer.cancer.gov/ (Accessed 30 July 2019). [Google Scholar]
- Ver Ploeg M, Breneman V, Farrigan T, Hamrick K, Hopkins D, Kaufman P, 2009. Access to Affordable and Nutritious Food—Measuring and Understanding Food Deserts and Their Consequences: Report to Congress. US Department of Agriculture, Economic Research Service, https://www.ers.usda.gov/webdocs/publications/42711/12716_ap036_1_.pdf?v=0 (Accessed 30 April 2019). [Google Scholar]
- Ver Ploeg M, Rahkovsky I, May 2, 2016. Recent evidence on the effects of food store access on food choice and diet quality. US Department of Agriculture, Economic Research Service, Amber Waves. https://www.ers.usda.gov/amber-waves/2016/may/recent-evidence-on-the-effects-of-food-store-access-on-food-choice-and-diet-quality/ (Accessed 30 April 2019). [Google Scholar]
- Walker RE, Keane CR, Burke JG, 2010. Disparities and access to healthy food in the UnitedStates: a review of food deserts literature. Health Place 16, 876–884. 10.1016/j.healthplace.2010.04.013. [DOI] [PubMed] [Google Scholar]
- Watters J, Satia J, Galanko J, 2007. Associations of psychosocial factors with fruit and vegetable intake among African-Americans. Publ. Health Nutr 10, 701–711. 10.1017/S1368980007662284. [DOI] [PubMed] [Google Scholar]
- Weber JL, Tinsley AM, Houtkooper LB, Lohman TG, 1997. Multimethod training increases portion-size estimation accuracy. J. Am. Diet Assoc 97, 176–179. 10.1016/S0002-8223(97)00046-1. [DOI] [PubMed] [Google Scholar]
- Wilcox S, Sharpe PA, Liese AD, Dunn CG, Hutto B, 2018. Socioeconomic factors associated with diet quality and meeting dietary guidelines in disadvantaged neighborhoods in the Southeast United States. Ethn Health 1–17. 10.1080/13557858.2018.1493434. [DOI] [PMC free article] [PubMed] [Google Scholar]
- Sharpe PA, Stucker J, Wilcox S, Liese AD, Bell BA (2020) Recruitment and retention for the evaluation of a healthy food initiative in economically disadvantaged, majority African American communities Family and Community Health. Article in press. [DOI] [PMC free article] [PubMed] [Google Scholar]
Associated Data
This section collects any data citations, data availability statements, or supplementary materials included in this article.