

Abstract
Aim:
Recent findings suggest that family-focused therapy (FFT) is effective for individuals at clinical high-risk for psychosis (CHR-P). As outcomes of CHR-P individuals are quite varied, certain psychosocial interventions may be differentially effective in subgroups. The present study examined change in positive symptoms for CHR-P individuals at different levels of predicted risk for conversion to psychosis who received either FFT, a brief form of family education termed enhanced care (EC) or treatment as usual.
Methods:
Participants were drawn from the North American Prodromal Longitudinal Study (NAPLS2). A subset of NAPLS2 participants completed a randomized study involving FFT or EC. The present study includes participants from the FFT-CHR sub- study and non-randomized NAPLS2 participants. Predicted risk of conversion was calculated using the Individualized Risk Calculator for Psychosis. Robust linear regressions evaluated whether the association between predicted risk of conversion and positive symptom change differed across intervention groups.
Results:
A total of 94 participants from the FFT-CHR sub-study (FFT-CHR n = 50, EC n = 44) and 401 non-randomized NAPLS2 participants were included in this study. There was a treatment group by predicted risk of conversion interaction that predicted positive symptom improvement: higher risk individuals improved more with FFT-CHR than EC or the non-randomized NAPLS group, whereas lower-risk individuals did not differ in positive symptom improvement across treatment groups (FFT-CHR vs EC: P = .03, β = 20.27; FFT-CHR vs NAPLS2: P < .001, β = 28.40).
Conclusions:
Intensive treatments such as FFT-CHR may be most appropriate for individuals at the highest levels of clinical risk for psychosis.
Keywords: early intervention, family therapy, linear models, psychotic disorders, risk
1 |. INTRODUCTION
The clinical high-risk state preceding the onset of psychosis (CHR-P) is a prime opportunity for early intervention to delay or prevent conversion to psychosis (Fusar-Poli, Carpenter, Woods, & McGlashan, 2014). Such individuals are distressed (Woods, Miller, & McGlashan, 2001) and treatment seeking (Preda et al., 2002; Woods, Walsh, Saksa, & McGlashan, 2010). Although on average, CHR-P individuals who do not convert to psychosis show improvement in positive symptoms during the first 6 to 12 months following initial ascertainment (Addington et al., 2011), it has been shown that specialized early intervention services outperform treatment as usual in improving positive symptoms, justifying the allocation of research resources toward developing early interventions (Correll et al., 2018). In recent years, several studies have examined the effects of both psychosocial and pharmacological interventions to improve symptoms and reduce conversion rates in the CHR population (Marshall & Rathbone, 2011). Multiple meta-analyses have shown modest but promising evidence for interventions such as cognitive behavioural therapy (CBT), familybased interventions, antipsychotic medications, and omega-3 fatty acids (Addington, Devoe, et al., 2019).
Despite an increased effort to identify effective interventions for CHR-P individuals, it remains to be seen which intervention(s) may be the most widely beneficial (Davies et al., 2018). The heterogeneous nature of the CHR-P state may account for the mixed results in these studies thus far (Cross, Scott, Hermens, & Hickie, 2018; Fusar-Poli et al., 2016). CHR-P individuals exhibit varying levels of symptom severity and less than 30% of CHR individuals eventually convert to psychosis, suggesting that a stepped-care or staging model may better address a variety of needs during the at-risk period (Addington, Liu, et al., 2019; Addington et al., 2019; Cannon et al., 2008; Francey et al., 2010). In order to maximize a staged or stepped-care approach, risk factors that differentially predict outcomes and responses to interventions will need to be better understood.
One method of using multiple baseline risk factors in combination to assess risk is by using an individualized risk calculator. Cannon and colleagues (Cannon et al., 2016) developed an individualized risk calculator which uses an individual’s baseline positive symptoms, social functioning, neurocognitive functioning, family history, and trauma history to estimate the likelihood that a given individual will convert to psychosis within 2 years. All of the variables needed for the risk calculator can be assessed at baseline, before treatment is initiated. If an individual’s predicted risk of conversion at baseline is systematically related to his/her response to particular treatments, risk calculators could be invaluable for informing treatment decisions. In particular, individuals with higher predicted risks of conversion are likely to require more intensive interventions, while those with lower predicted risks of conversion may respond to less intensive therapies.
In the present study, we examine the predictive power of an individual’s baseline risk score on treatment outcomes in a clinical trial involving family-focused therapy for individuals at clinical high-risk for psychosis (FFT-CHR) as compared to enhanced care (EC) (Miklowitz et al., 2014). FFT is a therapy that was initially established and found to be effective in bipolar I and II disorder as well as in the at-risk state preceding the onset of bipolar disorder (Miklowitz et al., 2008; Miklowitz et al., 2013; Miklowitz & Scott, 2009). It was then adapted for use with CHR-P individuals (Miklowitz et al., 2014). The therapy focuses on reducing stressors that may exacerbate a CHR-P individual’s symptoms by providing psychoeducation, enhancing coping, and teaching communication and problem-solving skills in the family system (Miklowitz et al., 2014). EC is a treatment-as-usual comparison condition that incorporates three structured sessions of family psychoeducation.
We have previously shown that while patients randomized to receive FFT-CHR and EC both improve in positive symptoms from pre- to post-treatment, those receiving FFT-CHR improve to a significantly greater degree compared with those receiving EC (Miklowitz et al., 2014). In the present study, an unplanned secondary analysis of the original data, we sought to incorporate individualized predicted risk into the analysis of symptom outcome in this trial. We hypothesized that predicted risk of conversion to psychosis at baseline would moderate the differential effect of FFT-CHR vs EC on positive symptom outcome, such that higher-risk individuals would have better outcomes at 6 months with the more intensive FFT intervention as compared to EC.
2 |. METHODS
2.1 |. Participants
The participants were drawn from the second phase of the North American Prodromal Longitudinal Study (NAPLS2) (Addington et al., 2012). NAPLS2 is an 8-site observational consortium study that aims to study predictors and mechanisms related to conversion from the clinical high-risk state to psychosis. Participants were individuals aged 12–35 who met criteria for a prodromal risk syndrome as determined by the Criteria of Prodromal States (McGlashan, Walsh, & Woods, 2010) and as measured by the Structured Interview for Psychosis-risk Syndromes (SIPS) (McGlashan, Walsh, & Woods, 2001; Miller et al., 2002). Clinical assessments including the SIPS and the Scale of Prodromal Symptoms (SOPS) (Hawkins et al., 2004)—which is contained within the SIPS—were administered at 6-month intervals or at the time of conversion to psychosis during the 2-year study. Exclusion criteria included any previous diagnosis of a psychotic disorder as assessed by the diagnostic and statistical manual of mental disorders (Castillo et al., 2007) diagnosis of a psychotic disorder, any pervasive developmental disorder, current drug or alcohol dependence, or the presence of a neurological disorder. A subset of NAPLS2 participants were invited to participate in a randomized study involving family-focused therapy for individuals at clinical high-risk for psychosis (FFT-CHR) (Miklowitz et al., 2014). The methods for both the overall NAPLS2 study and the FFT-CHR sub-study have been described in detail previously (Addington et al., 2012; Miklowitz et al., 2014).
NAPLS2 participants were invited to participate in the FFT-CHR sub-study if they lived with or were in frequent contact with a family member or significant other. Participants were randomized into two groups to receive either 18 1-hour sessions of FFT-CHR given weekly and then biweekly over 6 months, or 3 weekly sessions of a brief family intervention involving psychoeducation (EC). Sessions 1–6 of FFT-CHR involved psychoeducation and coping strategies, sessions 7–12 involved communication enhancement training, and sessions 13–18 involved problem-solving skill enhancement training. EC, by contrast, involved only psychoeducation and coping strategies, which was also included in the FFT-CHR curriculum (Miklowitz et al., 2014). Participants completed the SIPS/SOPS at baseline and 6-months.
Though the hypotheses and analyses focus on individuals who were randomly assigned to treatments in the FFT-CHR sub-study, we also included as a separate group of non-randomized NAPLS2 subjects who did not participate in the FFT-CHR sub-study but who completed baseline and 6-month clinical assessments and had baseline data for calculating risk of conversion to psychosis. The latter subjects were receiving treatments in the community and were being monitored for psychosis risk as part of their participation in NAPLS2 (eg, in addition to being assessed during regularly-scheduled study visits every 6 months, parents were asked to notify the study team and study psychiatrists if a subject’s symptoms worsened or if the subject was hospitalized due to symptoms worsening). Given that they were not randomly assigned to a treatment condition, their inclusion here is primarily to provide context for the expected level of improvement associated with community-based, nonspecialty psychological treatments and psychosis monitoring.
The protocols for the NAPLS2 study and the FFT-CHR sub-study were approved by Institutional Review Boards at all sites (Emory University, Harvard University, University of Calgary, University of California Los Angeles, University of California San Diego, University of North Carolina, Yale University and Zucker Hillside Hospital), and all participants provided informed consent or assent (and parental informed consent) for minors.
2.2 |. Primary outcome measure
For both the FFT-CHR sub-study and the larger NAPLS2 study, trained raters performed the clinical assessments at each time point. Raters received training to ensure a minimum criterion for interrater reliability of kappa = 0.80 across sites (Addington et al., 2007). In the FFT-CHR study, raters administering clinical assessments were blind to treatment condition (Addington et al., 2012).
Prodromal symptoms were rated at baseline and 6 months using the SOPS. The SOPS consists of four subscales: positive, negative, disorganized and general symptoms. For the purpose of the present study, only the positive symptom subscale was used to assess symptom change, as that is the only domain in which a general treatment effect was observed in the original study. The positive symptom subscale contains five items that are rated on a scale from 0 (absent) to 6 (severe and psychotic) and contain detailed anchors for rating purposes (Miller et al., 1999). The positive symptom composite score consists of the sum of all items in the positive symptom subscale. Interrater reliability of the positive symptom composite has been excellent: a recent review reported that the median reliability coefficient across 21 published CHR-P samples was 0.88 (Woods, Walsh, Powers III, & McGlashan, 2019). In the NAPLS2 sample specifically, cross-site reliability for positive symptoms based on the SOPS ranged from 0.92 to 0.96 (Addington et al., 2015). Change in positive symptoms was the primary outcome of interest and was measured by subtracting the 6-month composite positive symptom score from the baseline composite positive symptom score. A participant was considered to have “improved” if the change score was greater than 0.
2.3 |. Calculated risk of conversion
Predicted risk of conversion to psychosis was derived using a calculator based on the NAPLS2 sample (Cannon et al., 2016) which has been validated in external samples (Carrión et al., 2016; Zhang et al., 2018). This tool integrates age; positive symptom severity on SIPS items P1 and P2 (eg, unusual thought content and suspiciousness); score on the Brief Assessment of Cognition in Schizophrenia symbol coding test (Keefe et al., 2008); score on the Hopkins Verbal Learning Test-Revised (Benedict, Schretlen, Groninger, & Brandt, 1998); decline in social functioning during the prior year as measured by the Global Functioning Social scale (Cornblatt et al., 2007); stressful life events as measured by the Research Interview Life Events Scale (Dohrenwend, Askenasy, Krasnoff, & Dohrenwend, 1978); childhood traumas as measured by the Childhood Trauma and Abuse Scale (Janssen et al., 2004); and family history of psychotic disorder in a first-degree relative to determine an individual’s probability of converting to psychosis over a 2-year period. When the risk calculator was first published, risk scores of 0.20 or higher showed a higher proportion of converters to non-converters (Cannon et al., 2016). In the present analysis, individuals with a risk score of 0.20 or higher were considered to be at higher risk of conversion that individuals with a risk score below 0.20.
2.4 |. Statistical analysis
Statistical analyses were performed using R (R Core Team, 2018) and SPSS software version 25.0 (IBM Corp., 2017). In order to evaluate the relationship between predicted risk of conversion and change in positive symptom score, multivariate linear regression analyses were performed. Due to the non-normal nature of the predicted risk score distribution, a robust regression method was used to ensure that outliers did not carry any undue influence on the outcome variable. Linear models were performed within treatment groups (eg, within the FFT-CHR group, within the EC group, and within the non-randomized NAPLS2 group) to identify the unique role of predicted risk on change in positive symptom score across groups. A linear model was also performed to examine the effect of the treatment group by calculated risk score interaction term on improvement in positive symptoms. One-way ANOVAs and χ2 tests of independence were used to compare baseline variables across groups.
3 |. RESULTS
A total of 129 participants were recruited from the NAPLS2 study to participate in the FFT-CHR sub-study. Of these, 94 completed assessments at both baseline and the 6-month follow-up and had data available for calculating predicted risk of conversion (FFT-CHR n = 50, EC n = 44). A total of 635 participants were recruited for NAPLS2 who were not randomized into the FFT-CHR sub-study but were receiving psychological treatments in the community such as supportive therapy, school counselling, cognitive behavioural therapy and case management. Of these participants, 401 participants completed assessments at both baseline and the 6-month follow-up and had data available to calculate predicted risk of conversion. Figure 1 shows the flow of participants and Table 1 summarizes descriptive statistics for all participants who completed baseline clinical assessments, 6-month clinical assessments, and baseline assessments of risk scores. Baseline characteristics including age, gender, baseline positive symptom score, baseline medication use, psychosocial treatment and predicted risk of conversion did not significantly differ between the FFT-CHR, EC and remaining non-randomized NAPLS2 groups. At the 6-month timepoint, a lower percentage of non-randomized NAPLS2 participants were engaged with specialty or community services as compared to both the FFT-CHR and EC treatment groups. Within the clinical trial sample, the number of sessions of individual and group psychotherapy that patients received outside of the clinical trial was tracked and did not differ between treatment groups (t = 0.94, P = .34). Patients in the EC group received an average of 7.5 (SD = 12) sessions of outside psychosocial therapy and patients in the FFT-CHR group received an average of 5.97 (SD = 7.8) sessions of outside psychosocial therapy.
FIGURE 1.
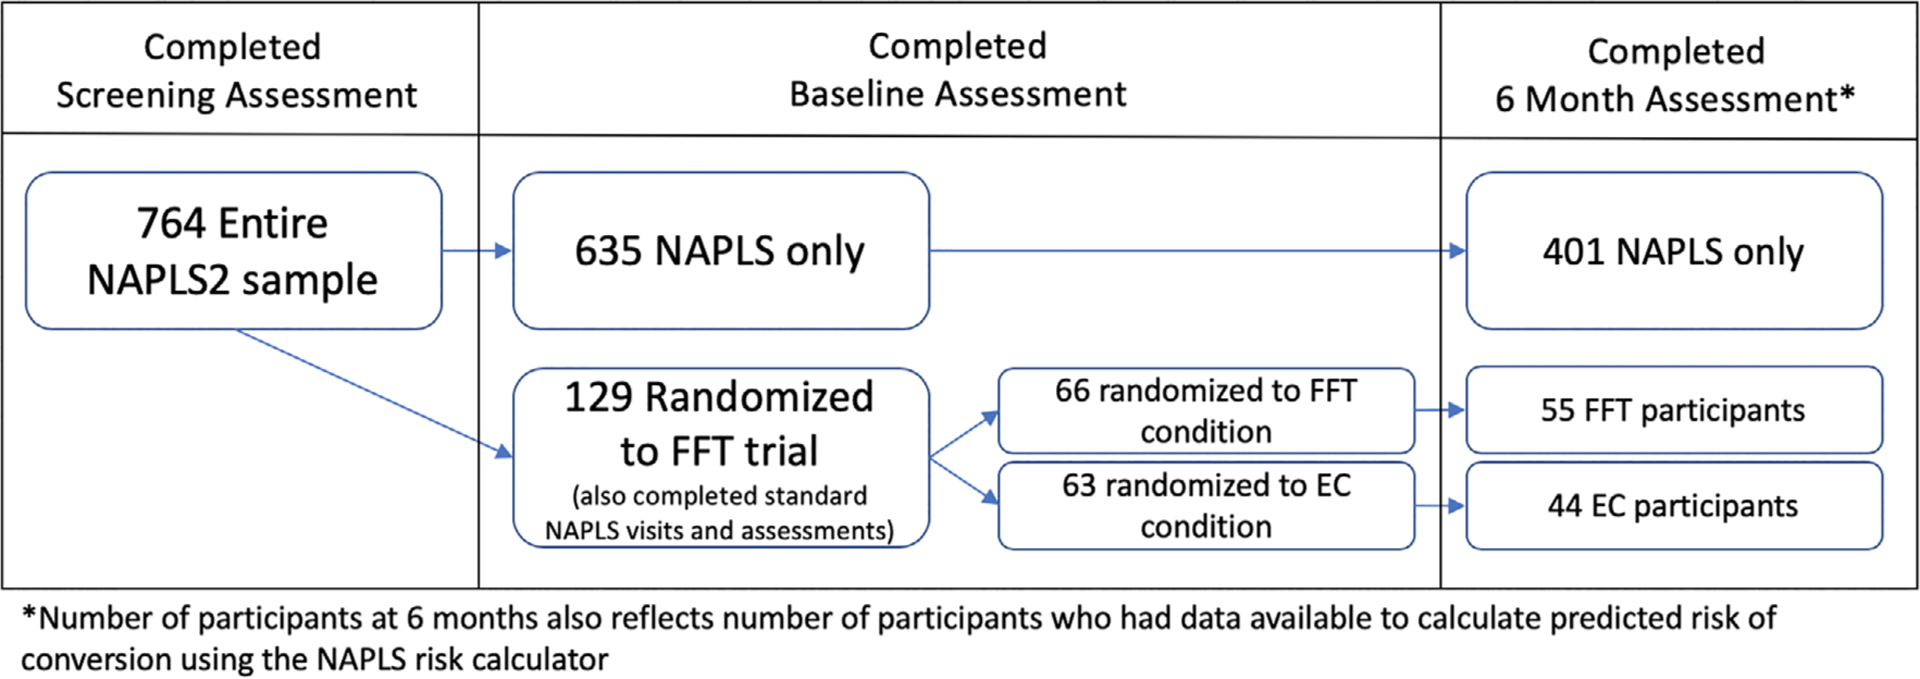
Participant flow chart
TABLE 1.
Baseline characteristics for FFT-CHR, EC and non-randomized NAPLS2 groups
| FFT Group | EC Group | NAPLS2 Group | Test statistic | P value | ||||
|---|---|---|---|---|---|---|---|---|
| n | Mean (SD) | n | Mean (SD) | n | Mean (SD) | χ 2/F (df) | ||
| Age | 50 | 17.86 (4.28) | 44 | 17.83 (3.91) | 401 | 18.78 (4.35) | F(2) = 1.754 | .17 |
| Female, No. (%) | 50 | 18 (36%) | 44 | 19 (43.2%) | 401 | 170 (42.4%) | χ 2(2) = .95 | .68 |
| Baseline antipsychotic use, No. (%) | 50 | 9 (18%) | 44 | 8 (14.1%) | 401 | 67 (16.7%) | χ 2(2) = .95 | .76 |
| Baseline positive symptoms | 50 | 11.84 (3.61) | 44 | 11.23 (3.06) | 401 | 11.67 (3.99) | F(2) = 0.324 | .72 |
| 6-month positive symptoms | 50 | 8.42 (3.90) | 44 | 9.2 (4.58) | 401 | 8.49 (4.53) | F(2) = .532 | .59 |
| Improvement in positive symptoms from baseline to 6 months | 50 | 3.42 (5.37) | 44 | 2.02 (5.10) | 401 | 3.18 (4.22) | F(2) = 1.496 | .22 |
| Predicted risk of conversion | 50 | .18 (.10) | 44 | .16 (.08) | 401 | .17 (.11) | F(2) = .451 | .64 |
| Received psychosocial treatment prior to baseline, No. (%) | 50 | 26 (52%) | 44 | 25 (57%) | 399 | 202 (51%) | χ 2(2) = .62 | .73 |
| Received psychosocial treatment at 6 months, No. (%) | 49 | 37 (75.5%) | 38 | 32 (84%) | 398 | 238 (60%) | χ2(2) = 12.40 | .002 |
Abbreviations: EC, enhanced care; CHR, clinical high-risk; FFT, family-focused therapy; NAPSL2, North American Prodromal Longitudinal Study.
As noted previously, subjects in the FFT-CHR condition showed significantly greater improvement in positive symptoms compared with those in the EC condition (Miklowitz et al., 2014). Critically, as shown in Figure 2, there was a differential association between predicted risk of conversion to psychosis and positive symptom change by treatment group (FFT-CHR vs EC: P = .03, β = 20.27, SE = 10.67; FFT-CHR vs non-randomized NAPLS2: P < .001, β = 28.40, SE = 6.37; EC vs non-randomized NAPLS2: P = .18, β = 8.13, SE = 9.01). The nature of this interaction effect was such that among cases with higher predicted risks of conversion, FFT-CHR was associated with significantly greater improvement in positive symptoms than EC (or non-randomized community treatment), whereas at lower levels of predicted risk, the two treatments were associated with an equivalent degree of improvement in positive symptoms, and neither was associated with more improvement than community treatment.
FIGURE 2.
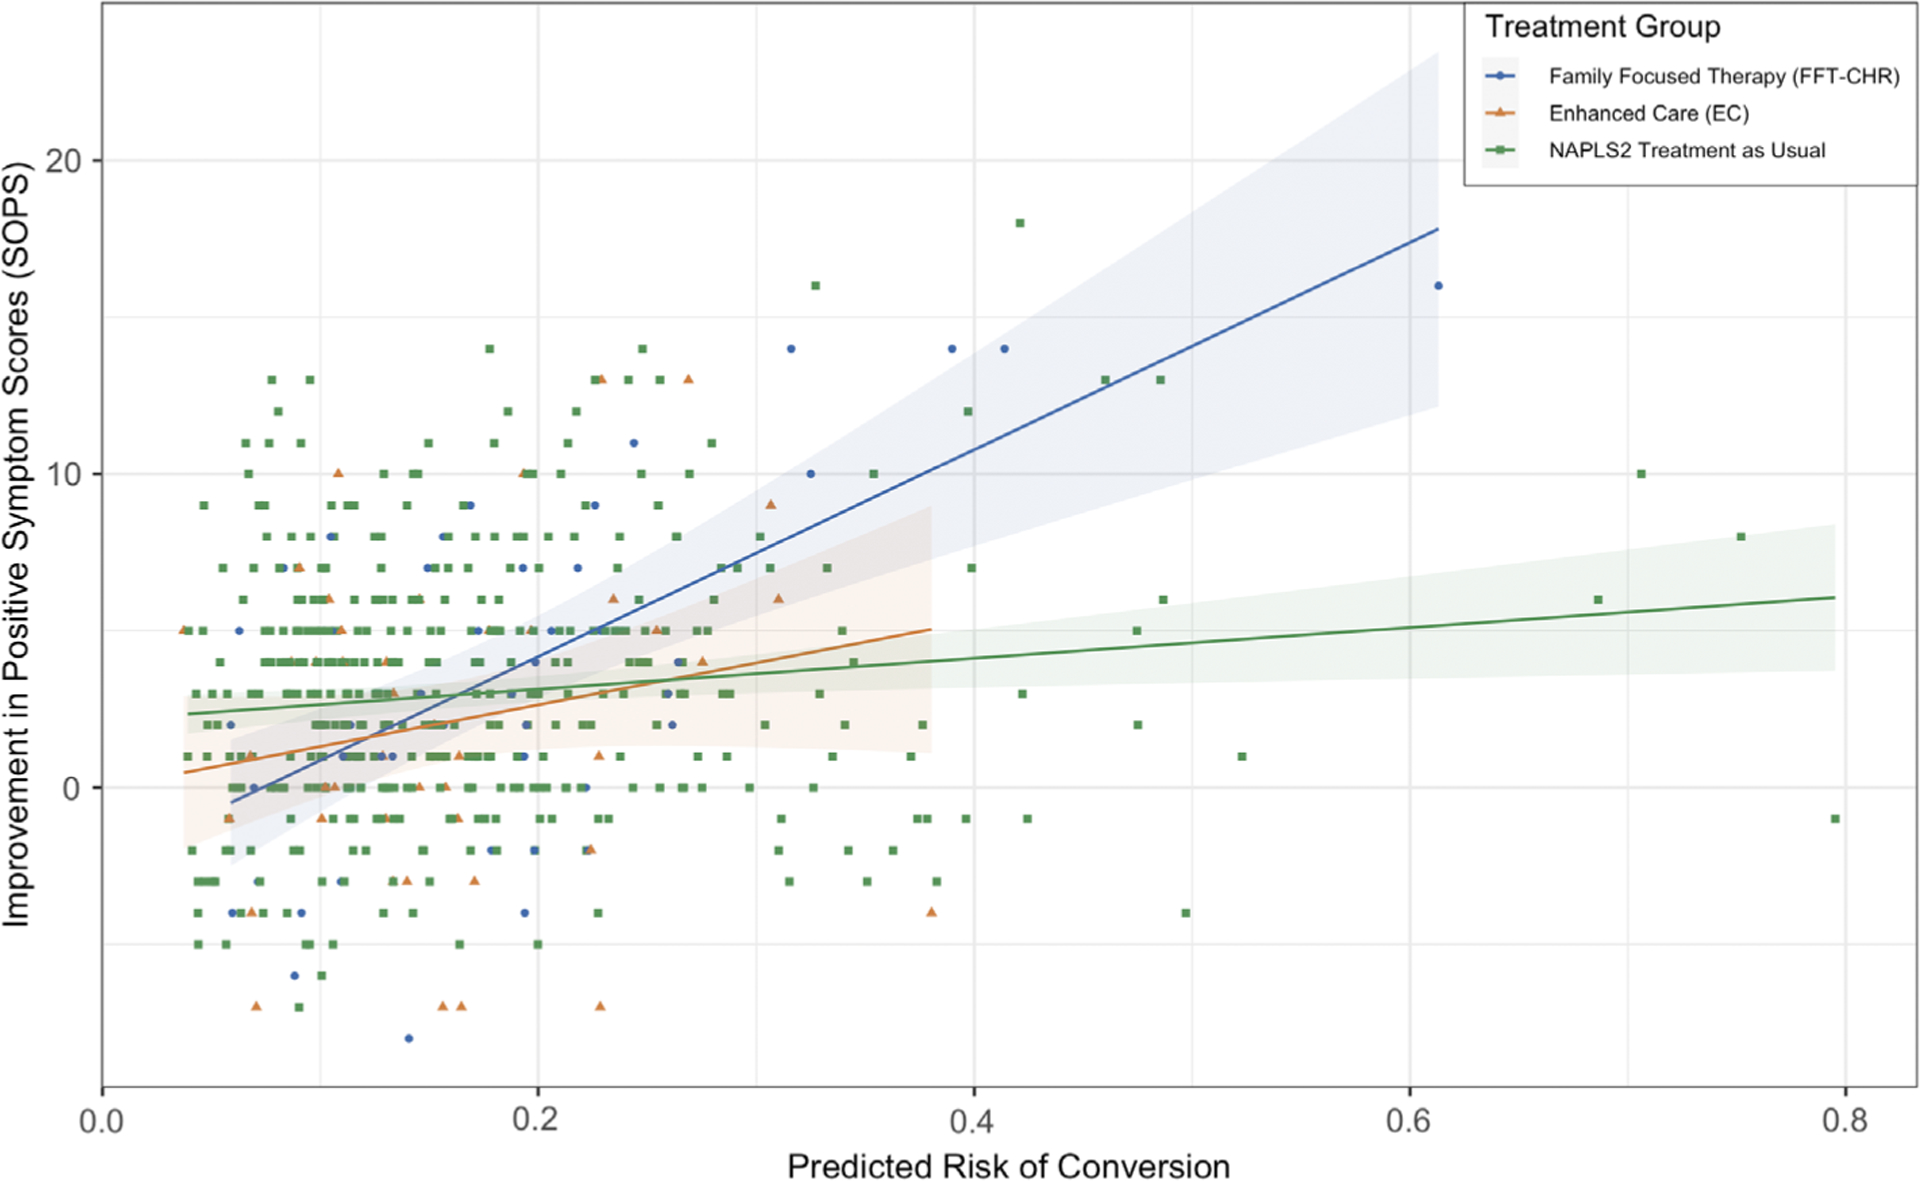
Association of calculated risk score with improvement in positive symptoms as measured by the Scale of Positive Symptoms (SOPS) by treatment group
These findings were further probed using a robust linear regression model controlling for age, gender and baseline medication status. Among the FFT-CHR group, predicted risk of conversion was significantly associated with change in positive symptom score such that a higher risk score predicted greater improvement in positive symptom scores (P < .001, β = 33.68, SE = 6.69). Conversely, predicted risk of conversion was not associated with change in positive symptom score in the EC group (P = .18, β = 14.84, SE = 10.96). In the non-randomized NAPLS2 group, predicted risk score was modestly but significantly associated with improvement in positive symptoms (P = .004, β = 5.82, SE = 2.02).
Given that the FFT-CHR and EC groups did not differ on baseline positive symptom severity, it is unlikely that the differential improvement in positive symptoms among higher predicted risk cases in the FFT-CHR condition reflects a “regression to the mean” phenomenon. Nevertheless, to account for the potential covariation of baseline positive symptom score with change in positive symptom score, baseline positive symptom score was added to the robust linear regression model described above. In these analyses, level of positive symptoms at baseline was significantly associated with improvement in positive symptoms in the EC (P = .02, β = .69, SE = .29), FFT-CHR (P < .001, β = .70, SE = .19) and non-randomized NAPLS2 participants (P < .001, β = .42, SE = .06). After accounting for baseline positive symptom score, the differential improvement in positive symptoms associated with higher predicted risk cases receiving FFT-CHR was confirmed. Further, calculated risk of conversion still significantly predicted change in positive symptoms in the FFT-CHR group (P = .015, β = 16.82, SE = 6.67). In the EC group, there continued to be no association between predicted risk and change in positive symptoms when baseline positive symptoms were covaried (P = .83, β = 2.52, SE = 11.88). In the non-randomized NAPLS2 group, predicted risk score no longer significantly predicted change in positive symptoms after accounting for baseline positive symptoms (P = .26, β = −2.56, SE = 2.27). As shown in Figure 3, the above effects were also replicated using repeated measures analyses of variance and stratifying each treatment group according to low (<0.20) vs high (≥0.20) predicted risk).
FIGURE 3.
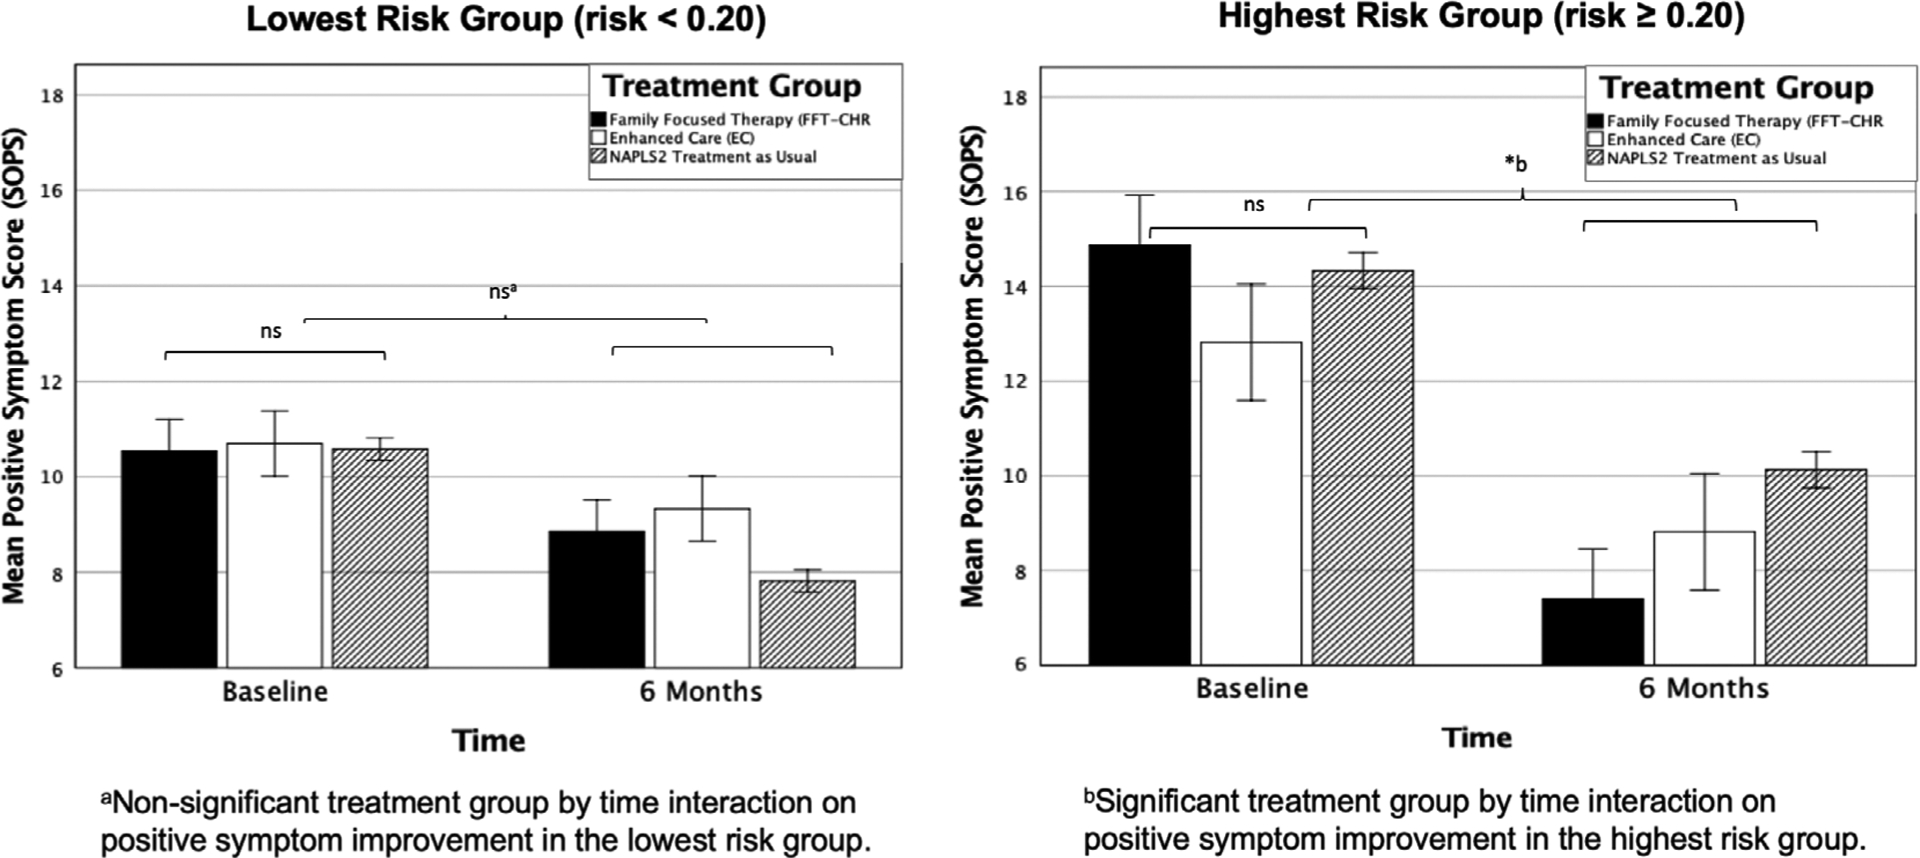
Positive symptom change as measured by the Scale of Positive Symptoms (SOPS) from baseline to 6 months within the highest-(risk ≥0.20) and lowest-risk (risk <0.20) levels across treatment groups
4 |. DISCUSSION
To the best of our knowledge, this is the first study to show evidence for a potential moderator of early intervention efficacy in the CHR-P population. Predicted risk of conversion to psychosis was shown to be a significant moderator of positive symptom improvement. Individuals with a higher risk score had a greater reduction in positive symptoms with FFT-CHR than EC or individuals who received specialty services and treatment in the community. Individuals with a lower conversion risk score did not show a differential improvement in positive symptom scores across treatment groups. This interaction was significant even after accounting for baseline positive symptoms. Thus, CHR-P individuals with higher predicted risks may benefit from a more intensive, family-focused treatment such as FFT-CHR, whereas CHR-P individuals with lower predicted risks may benefit from less intensive psychoeducational treatments such as EC or from psychological services not specifically developed for the CHR-P population.
This finding supports a stepped-care approach to early intervention wherein individual risk factors are considered when making and tailoring treatment decisions (Addington et al., 2019; Addington et al., 2019). The ability to use clinical tools such as the assessments that comprise the individualized risk calculator used in this study (Cannon et al., 2016) is advantageous from an economic and feasibility perspective. Although trained raters are required to administer the SIPS/SOPS and the neurocognitive assessments included in the risk calculator, these measures circumvent the necessity of expensive and invasive assay and imaging techniques that have also been used to understand risk factors for psychosis. The amount of time required to administer the conversion risk assessments is minimal compared to the potential benefit of this metric to inform individual treatment recommendations.
Family engagement in treatment for individuals in the CHR-P population may be an essential consideration in decreasing contextual stress that may exacerbate symptoms and increasing support to cope with and manage symptoms (Thompson et al., 2019). The results from this study suggest that enhancing family communication and support may be especially important for the highest-risk CHR-P individuals; however, the mechanisms underlying this improvement need to be further elucidated. It is not yet clear whether differential improvement in the highest-risk individuals receiving FFT as opposed to EC or treatment as usual stems from differing baseline family dynamics, biological factors that may predispose certain families and individuals to improvement with FFT, or simply the length of treatment (18 sessions of FFT as compared to 3 sessions of EC). As discussed in the original study findings (Miklowitz et al., 2014), in addition to targeting the mechanisms of improvement, treatment duration should be directly matched in future studies to account for the potential that longer, more intensive treatment result in improvement in the highest risk individuals due to non-specific factors (eg, attention from a caring professional) as opposed to the unique components of FFT.
One limitation of this study is that the number of individuals in the highest-risk range was less than the number of individuals in the lowest-risk range. In the NAPLS2 sample, the proportion of converters to non-converters is higher starting at a risk score of 0.20 (Cannon et al., 2016). In the FFT subsample, 28% of participants (26 out of 94) had risk scores of 0.20 or above. In the entire sample including non-randomized NAPLS2 participants, 29% of participants (142 out of 495) had risk scores of 0.20 or above. Due to the low number of individuals with risk scores of 0.20 or above, the effect found in this study should first be replicated in a larger sample to ensure clinical validity. In addition, future research should take into consideration the lower base rate of individuals with risk scores above 0.20. Investigators may consider risk scores when planning recruitment for future CHR-P intervention studies to better understand how this risk factor may interact with either FFT or other types of interventions.
This study is an important first step toward understanding moderators of treatment response in the CHR-P population. Future studies may be able to determine whether the risk calculator score is a useful moderator of other types of interventions for CHR-P, such as CBT. Further, a replication study incorporating a larger number of the highest-risk individuals, and randomized stratification on risk scores to FFT-CHR or an equally or more intensive psychosocial intervention, may allow for a better mechanistic understanding of the factors that influence symptom and functional improvement in individuals at risk for psychosis.
ACKNOWLEDGEMENTS
This work was supported by the National Institutes of Health (U01 MH081902 to T.D.C.; 1RC1 MH088546 to T.D.C. and D.J.M.; R01 MH093676 to D.J.M., MH066286 and BBRF (NARSAD) grants to C.E.B.; U01 MH081857 to B.A.C., U01 MH82022 to S.W.W., U01 MH066134 to J.A., U01 MH081944 to K.S.C., R01, U01 MH066069 to D.O.P., R01 MH076989 to D.H.M., U01 MH081928 to L.J.S., U01 MH081988 to E.F.W.) and a grant from the International Mental Health Research Organization (T.D.C.). The authors wish to thank Danielle Schlosser, Kristin Candan, Catherine Marshall, Isabel Domingues, Barbara Walsh, Jamie Zinberg, Sandra De Silva, and Michelle Friedman-Yakoobian for their contributions to the original FFT-CHR clinical trial.
Funding information
International Mental Health Research Organization; National Institutes of Health, Grant/Award Numbers: 1RC1 MH088546, BBRF (NARSAD), MH066286, R01 MH066069, R01 MH076989, R01 MH093676, U01 MH066069, U01 MH066134, U01 MH081857, U01 MH081902, U01 MH081928, U01 MH081944, U01 MH081988, U01 MH82022
Footnotes
DATA AVAILABILITY STATEMENT
Data sharing is not applicable to this article as no new data were created or analyzed in this study.
REFERENCES
- Addington J, Cadenhead KS, Cannon TD, Cornblatt B, McGlashan TH, Perkins DO, … Woods SW (2007). North American Prodrome Longitudinal Study: A collaborative multisite approach to prodromal schizophrenia research. Schizophrenia Bulletin, 33(3), 665–672. [DOI] [PMC free article] [PubMed] [Google Scholar]
- Addington J, Cadenhead KS, Cornblatt BA, Mathalon DH, McGlashan TH, Perkins DO, … Woods SW (2012). North American prodrome longitudinal study (NAPLS 2): Overview and recruitment. Schizophrenia Research, 142(1–3), 77–82. [DOI] [PMC free article] [PubMed] [Google Scholar]
- Addington J, Cornblatt BA, Cadenhead KS, Cannon TD, McGlashan TH, Perkins DO, … Woods SW (2011). At clinical high risk for psychosis: Outcome for nonconverters. American Journal of Psychiatry, 168(8), 800–805. [DOI] [PMC free article] [PubMed] [Google Scholar]
- Addington J, Devoe DJ, & Santesteban-Echarri O (2019). Multidisciplinary treatment for individuals at clinical high risk of developing psychosis. Current Treatment Options in Psychiatry, 6(1), 1–16. [DOI] [PMC free article] [PubMed] [Google Scholar]
- Addington J, Liu L, Buchy L, Cadenhead KS, Cannon TD, Cornblatt BA, … Walker EF (2015). North American prodrome longitudinal study (NAPLS 2): The prodromal symptoms. Journal of Nervous and Mental Disease, 203(5), 328–335. [DOI] [PMC free article] [PubMed] [Google Scholar]
- Addington J, Liu L, Goldstein BI, Wang J, Kennedy SH, Bray S, … MacQueen G (2019). Clinical staging for youth at-risk for serious mental illness. Early Intervention in Psychiatry, 13(6), 1416–1423. 10.1111/eip.12786 [DOI] [PubMed] [Google Scholar]
- Benedict RH, Schretlen D, Groninger L, & Brandt J (1998). Hopkins verbal learning test–revised: Normative data and analysis of inter-form and test-retest reliability. The Clinical Neuropsychologist, 12(1), 43–55. [Google Scholar]
- Cannon TD, Cadenhead K, Cornblatt B, Woods SW, Addington J, Walker E, … McGlashan T (2008). Prediction of psychosis in youth at high clinical risk: A multisite longitudinal study in North America. Archives of General Psychiatry, 65(1), 28–37. [DOI] [PMC free article] [PubMed] [Google Scholar]
- Cannon TD, Yu C, Addington J, Bearden CE, Cadenhead KS, Cornblatt BA, … McGlashan TH (2016). An individualized risk calculator for research in prodromal psychosis. The American Journal of Psychiatry, 173(10), 980–988. [DOI] [PMC free article] [PubMed] [Google Scholar]
- Carrión RE, Cornblatt BA, Burton CZ, Tso IF, Auther AM, Adelsheim S, … Sale TG (2016). Personalized prediction of psychosis: External validation of the NAPLS-2 psychosis risk calculator with the EDIPPP project. The American Journal of Psychiatry, 173(10), 989–996. [DOI] [PMC free article] [PubMed] [Google Scholar]
- Castillo R, Carlat D, Millon T, Millon C, Meagher S, Grossman S, … Association AP (2007). Diagnostic and statistical manual of mental disorders. Washington, DC: American Psychiatric Association Press. [Google Scholar]
- Cornblatt BA, Auther AM, Niendam T, Smith CW, Zinberg J, Bearden CE, & Cannon TD (2007). Preliminary findings for two new measures of social and role functioning in the prodromal phase of schizophrenia. Schizophrenia Bulletin, 33(3), 688–702. [DOI] [PMC free article] [PubMed] [Google Scholar]
- Correll CU, Galling B, Pawar A, Krivko A, Bonetto C, Ruggeri M, … Guloksuz S (2018). Comparison of early intervention services vs treatment as usual for early-phase psychosis: A systematic review, meta-analysis, and meta-regression. JAMA Psychiatry, 75(6), 555–565. [DOI] [PMC free article] [PubMed] [Google Scholar]
- Cross SP, Scott JL, Hermens DF, & Hickie IB (2018). Variability in clinical outcomes for youths treated for subthreshold severe mental disorders at an early intervention service. Psychiatric Services, 69(5), 555–561. [DOI] [PubMed] [Google Scholar]
- Davies C, Radua J, Cipriani A, Stahl D, Provenzani U, McGuire P, & Fusar-Poli P (2018). Efficacy and acceptability of interventions for attenuated positive psychotic symptoms in individuals at clinical high risk of psychosis: A network meta-analysis. Frontiers in Psychiatry, 9, 187. [DOI] [PMC free article] [PubMed] [Google Scholar]
- Dohrenwend BS, Askenasy AR, Krasnoff L, & Dohrenwend BP (1978). Exemplification of a method for scaling life events: The PERI life events scale. Journal of Health and Social Behavior, 19, 205–229. [PubMed] [Google Scholar]
- Francey S, Nelson B, Thompson A, Parker A, Kerr M, Macneil C, … Harrigan S (2010). Who needs antipsychotic medication in the earliest stages of psychosis? A reconsideration of benefits, risks, neurobiology and ethics in the era of early intervention. Schizophrenia Research, 119(1–3), 1–10. [DOI] [PubMed] [Google Scholar]
- Fusar-Poli P, Cappucciati M, Borgwardt S, Woods SW, Addington J, Nelson B, … Riecher-Rössler A (2016). Heterogeneity of psychosis risk within individuals at clinical high risk: A meta-analytical stratification. JAMA Psychiatry, 73(2), 113–120. [DOI] [PubMed] [Google Scholar]
- Fusar-Poli P, Carpenter W, Woods S, & McGlashan T (2014). Attenuated psychosis syndrome: Ready for DSM-5.1? Annual Review of Clinical Psychology, 10, 155–192. [DOI] [PubMed] [Google Scholar]
- Hawkins K, McGlashan T, Quinlan D, Miller T, Perkins D, Zipursky R, … Woods S (2004). Factorial structure of the scale of prodromal symptoms. Schizophrenia Research, 68(2–3), 339–347. [DOI] [PubMed] [Google Scholar]
- IBM Corp. (2017). IBM SPSS Statistics for Windows, Version 25.0. Armonk,NY: IBM Corp. [Google Scholar]
- Janssen I, Krabbendam L, Bak M, Hanssen M, Vollebergh W, de Graaf R, & van Os J (2004). Childhood abuse as a risk factor for psychotic experiences. Acta Psychiatrica Scandinavica, 109(1), 38–45. [DOI] [PubMed] [Google Scholar]
- Keefe RS, Harvey PD, Goldberg TE, Gold JM, Walker TM, Kennel C, & Hawkins K (2008). Norms and standardization of the brief assessment of cognition in schizophrenia (BACS). Schizophrenia Research, 102(1–3), 108–115. [DOI] [PubMed] [Google Scholar]
- Marshall M, & Rathbone J (2011). Early intervention for psychosis. Schizophrenia Bulletin, 37(6), 1111–1114. [DOI] [PMC free article] [PubMed] [Google Scholar]
- McGlashan T, Walsh B, & Woods S (2010). The psychosis-risk syndrome: Handbook for diagnosis and follow-up. New York, NY: Oxford University Press. [Google Scholar]
- McGlashan TH, Walsh BC, & Woods SW (2001). Structured interview for psychosis-risk syndromes. New Haven, CT: Yale School of Medicine. [Google Scholar]
- Miklowitz DJ, Axelson DA, Birmaher B, George EL, Taylor DO, Schneck CD, … Brent DA (2008). Family-focused treatment for adolescents with bipolar disorder: Results of a 2-year randomized trial. Archives of General Psychiatry, 65(9), 1053–1061. [DOI] [PMC free article] [PubMed] [Google Scholar]
- Miklowitz DJ, O’Brien MP, Schlosser DA, Addington J, Candan KA, Marshall C, … De Silva SD (2014). Family-focused treatment for adolescents and young adults at high risk for psychosis: Results of a randomized trial. Journal of the American Academy of Child and Adolescent Psychiatry, 53(8), 848–858. [DOI] [PMC free article] [PubMed] [Google Scholar]
- Miklowitz DJ, Schneck CD, Singh MK, Taylor DO, George EL, Cosgrove VE, … Chang KD (2013). Early intervention for symptomatic youth at risk for bipolar disorder: A randomized trial of family-focused therapy. Journal of the American Academy of Child and Adolescent Psychiatry, 52(2), 121–131. [DOI] [PMC free article] [PubMed] [Google Scholar]
- Miklowitz DJ, & Scott J (2009). Psychosocial treatments for bipolar disorder: Cost-effectiveness, mediating mechanisms, and future directions. Bipolar Disorders, 11, 110–122. [DOI] [PubMed] [Google Scholar]
- Miller TJ, McGlashan TH, Rosen JL, Somjee L, Markovich PJ, Stein K, & Woods SW (2002). Prospective diagnosis of the initial prodrome for schizophrenia based on the structured interview for prodromal syndromes: Preliminary evidence of interrater reliability and predictive validity. The American Journal of Psychiatry, 159(5), 863–865. [DOI] [PubMed] [Google Scholar]
- Miller TJ, McGlashan TH, Woods SW, Stein K, Driesen N, Corcoran CM, … Davidson L (1999). Symptom assessment in schizophrenic prodromal states. Psychiatric Quarterly, 70(4), 273–287. [DOI] [PubMed] [Google Scholar]
- Preda A, Miller TJ, Rosen JL, Somjee L, McGlashan TH, & Woods SW (2002). Treatment histories of patients with a syndrome putatively prodromal to schizophrenia. Psychiatric Services, 53(3), 342–344. [DOI] [PubMed] [Google Scholar]
- R Core Team. (2018). R: A language and environment for statistical computing. Vienna, Austria: R Foundation for Statistical Computing; Retrieved from https://www.R-project.org/. [Google Scholar]
- Thompson E, Rakhshan P, Pitts SC, Demro C, Millman ZB, Bussell K, … Schiffman J (2019). Family functioning moderates the impact of psychosis-risk symptoms on social and role functioning. Schizophrenia Research, 204, 337–342. 10.1016/j.schres.2018.08.035 [DOI] [PMC free article] [PubMed] [Google Scholar]
- Woods S, Walsh B, Powers A III, & McGlashan T (2019). Reliability, validity, epidemiology, and cultural variation of the structured interview for psychosis-risk syndromes (SIPS) and the scale of psychosis-risk symptoms (SOPS) In Li H, Shapiro D, & Seidman LJ (Eds.), International handbook of attenuated psychosis syndrome in youth and young adults: Early identification and intervention across cultures. New York, NY: Springer. [Google Scholar]
- Woods SW, Miller TJ, & McGlashan TH (2001). The “prodromal” patient: Both symptomatic and at-risk. CNS Spectrums, 6(3), 223–232. [DOI] [PubMed] [Google Scholar]
- Woods SW, Walsh BC, Saksa JR, & McGlashan TH (2010). The case for including attenuated psychotic symptoms syndrome in DSM-5 as a psychosis risk syndrome. Schizophrenia Research, 123(2–3), 199–207. [DOI] [PMC free article] [PubMed] [Google Scholar]
- Zhang T, Li H, Tang Y, Niznikiewicz MA, Shenton ME, Keshavan MS, … Wang J (2018). Validating the predictive accuracy of the NAPLS-2 psychosis risk calculator in a clinical high-risk sample from the SHARP (Shanghai At Risk for Psychosis) Program. The American Journal of Psychiatry, 175(9), 906–908. [DOI] [PubMed] [Google Scholar]