Abstract
Background:
Characterizing the flow characteristics of the Fontan circuit, and correlating these characteristics with the development of complications, is an important clinical challenge. Past work has analyzed the flow characteristics of Fontan circulation on a component-by-component basis. Four-dimensional (4D) flow magnetic resonance imaging (MRI) with radial projections allows for large volumetric coverage, and therefore can be used to analyze the flow through many co-dependent cardiovascular components in a single imaging session.
Purpose:
The purpose of this study is to describe flow characteristics across the entire Fontan circuit and to compare these with the flow characteristics in healthy volunteers.
Study Type:
Prospective
Subjects:
Eleven (11) single ventricle patients with a Fontan connection and fifteen (15) healthy controls.
Sequence:
Phase Contrast with Vastly undersampled Isotropic Projection Reconstruction (PC-VIPR) at a field strength of 3T.
Assessment:
Cavopulmonary and ventricular flow distributions, blood flow kinetic energy, vorticities, efficiency indices, and other flow parameters were analyzed using Ensight and Matlab.
Statistical Tests:
Results were compared across Fontan subjects, between respiratory phases, and between Fontan subjects and healthy volunteers using a Student’s t-test for unequal sample sizes and linear regression.
Results:
Cava-specific pulmonary flow distributions of Fontan patients varied significantly between respiratory phases (p<0.05). Ventricular kinetic energy (KE) was significantly higher in Fontan patients than it was in healthy controls, leading to a lower cardiac efficiency metric in the Fontan group. A significant diastolic KE time-shift was also observed in the Fontan patient group. Peak diastolic KE was significantly (p<0.05) higher in the single ventricle of patients with right ventricle morphology than it was in left ventricle morphology patients.
Conclusion:
Radial 4D flow MRI can be used for comprehensive analysis of Fontan flow characteristics.
Keywords: Fontan, Kinetic Energy, Cardiac Efficiency, 4D Flow MRI, Flow
INTRODUCTION
Approximately 8% of congenital heart diseases (CHD) result in single ventricle physiology(1). These defects are often treated through a series of procedures that alter the configuration of the patient cardiac anatomy in a way that allows for passive pulmonary circulation and reliance on only one functioning ventricle. The final intervention in the surgical series, which is known as the Fontan procedure, completes the connections between the vena cava and pulmonary arteries. Initial survival rates for this procedure are high, however, long term complications are prevalent(2).
Non-invasive hemodynamic evaluation of the single ventricle patients with Fontan physiology has been an important clinical challenge. Currently, medical imaging techniques, such as doppler ultrasound and two-dimensional phase contrast (2D PC) magnetic resonance imaging (MRI), remain the standard for assessing flow dynamics in such altered anatomy. However, the development of more advanced phase contrast imaging techniques, such as Four-dimensional (4D) flow MRI with radial projections, has opened opportunities for improved analyses of complex cardiovascular conditions by providing three-dimensional hemodynamic information in a large anatomic region of interest from a single data set. Therefore, multiple cardiovascular components of heart disease patients, such as those with complex single ventricle physiology, can be analyzed with a single imaging session.
Complications of Fontan patients are often co-dependent. Therefore, analysis of the full cardiovascular system is needed to understand the full implications and causes of each individual complication. For example, many patients develop unilateral pulmonary arteriovenous malformations (AVMs) after the Fontan operation. The AVMs result in profound cyanosis. The development of AVMS is thought to be related to the lack of hepatic blood flow in the affected lung due to unbalanced flow distribution to the pulmonary arteries from the hepatic veins(3). The quantification of flow imbalance in Fontan connections can be confounded by many physiological factors, such as the dynamics of the cardiac and respiratory cycles. The dynamics of the respiratory cycle, in particular, play a role in the maintenance of blood circulation through Fontan geometry by inducing intrathoracic pressure changes(4). Furthermore, respiratory dynamics have been shown to influence quantitative results on venous return and stroke volume in Fontan patients, leading to a difference in clinical results obtained between measurements made during inspiration and expiration(4–6). Development of a non-invasive monitoring program for Fontan patients may lead to a better understanding of the development of these differences that predict future complications. This may lead to more immediate clinical intervention, and therefore improve the long term performance of the Fontan operation.
Another major factor in the development of Fontan patient complications is altered single ventricle performance. The highly altered single ventricle configuration has major implications on cardiovascular system health as a whole. However, the underlying flow dynamics in the single ventricle, and their effects on the Fontan circulation, have not been fully characterized due to the inherent difficulties of imaging this population (insert reference - “Role of imaging in the evaluation of single ventricle with the Fontan palliation” ). 4D flow MRI derived hemodynamic metrics based on cardiac work and energy dissipation may offer further information to evaluate cardiac function through the analysis of blood velocity and flow patterns in the heart. For example, one study found decreased diastolic kinetic energy (KE) in patients with Fontan circulation compared to controls(7). However, further study is needed because multiple studies have shown that KE is often higher in the ventricle or atria of patients with heart disease than in healthy controls. In these studies, higher KE metrics have been found in patients with pulmonary arterial hypertension, left ventricular heart failure, conduction abnormalities, tetralogy of Fallot, mitral valve regurgitation, and nonischemic cardiomyopathy, when compared with healthy controls (8–16). The literature also suggests that a healthy heart will remain efficient by minimizing the dissipation of KE through the formation of large vortex cores (8–10). The vortex rings can store and facilitate efficient transmission of energy from the heart chamber to the systemic or pulmonary flow (9,17). Yet, when the ventricle is overloaded and dilated, as is often the case in single ventricle defect anatomy, vortex development may be altered. The anatomical coverage provided by 4D flow MRI allows for data analysis that can offer valuable insight on such three-dimensional cardiac flow patterns.
The purpose of this study was to demonstrate the usefulness of radial 4D flow MRI for comprehensive analysis of the Fontan circulation.
METHODS
Human Subjects:
In this Institutional Review Board approved and Health Insurance Portability and Accountability Act – compliant study, eleven single ventricle patients with a Fontan connection (age 26.2 ± 7.9 years; Table 1) and fifteen healthy volunteers (age 26.6 ± 3 years) were recruited prospectively. Nine of the Fontan subjects had an extracardiac or lateral tunnel total cavopulmonary connection (TCPC). The remaining two patients had an atriopulmonary connection. Written informed consent was obtained, and each healthy subject underwent a health screening for cardiovascular disease before enrollment.
Table 1.
Demographic information for eleven subjects with a Fontan connection. BMI=Body Mass Index, BSA=Body Surface Area, SV=Stroke Volume, ESV=End-Systolic Volume, EDV=End-Diastolic Volume
| Subject | Type of CHD | Repair | Age of Repair (yrs) | Age at MRI (yrs) | BSA (m2) | Type of Contrast | Amount of Contrast (mL) | Single Ventricle SV Index (mL/m2) | Ejection Fraction | ESV Index (ml/m2) | EDV Index (ml/m2) |
|---|---|---|---|---|---|---|---|---|---|---|---|
| 1 | Double inlet left ventricle | Intracardiac Fontan (atriopulmonary connection) | 2 | 32 | 1.62 | Gadofosveset trisodium | 6.8 | 59.8 | 70% | 26.1 | 87.2 |
| 2 | Pulmonary atresia | Intracardiac Fontan (atriopulmonary connection) | 11 | 32 | 1.73 | Gadobenate dimeglumine | 15 | 31.8 | 56% | 24.2 | 55.6 |
| 3 | Hypoplastic left heart syndrome, double outlet right ventricle, mitral atresia, aorta coarctation | Lateral tunnel Fontan with fenestration | 3 | 21 | 1.75 | Gadobenate dimeglumine | 20 | 24.6 | 45% | 34 | 62 |
| 4 | Unbalanced atrioventricular canal, double outlet right ventricle, transposition great arteries, pulmonary stenosis | Lateral tunnel Fontan with fenestration | 9 | 30 | 1.70 | Gadofosveset trisodium | 10 | 82.4 | 38% | 135.4 | 214.7 |
| 5 | Double inlet left ventricle, transposition great arteries | Lateral tunnel Fontan with fenestration | 3 | 24 | 1.71 | Gadobenate dimeglumine | 12 | 34.9 | 67% | 17.7 | 53.1 |
| 6 | Hypoplastic left heart syndrome, double outlet right ventricle, mitral atresia, situs inversus, azygous continuation of inferior vena cava | Extracardiac Fontan | 5 | 23 | 1.77 | Gadofosveset trisodium | 8 | 65.8 | 56% | 52.4 | 118.8 |
| 7 | Hypoplastic left heart syndrome, aorta atresia, mitral atresia, aortic coarctation | Extracardiac Fontan | 13 | 15 | 1.723 | Gadofosveset trisodium | 15 | 61.3 | 64% | 60.7 | 166.4 |
| 8 | Double outlet right ventricle, Ebstein, Ventricular septal defect, Pulmonary stenosis | Lateral tunnel Fontan with fenestration | 2 | 19 | 1.691 | Gadobenate dimeglumine | 15 | 30.2 | 63% | 18 | 48 |
| 9 | Hypoplastic left heart syndrome, Aortic stenosis, Mitral stenosis | Extracardiac Fontan | 2 | 14 | 1.54 | Gadobenate dimeglumine | 15 | 36.4 | 29% | 91 | 128 |
| 10 | Pulmonary atresia with intact septum | Lateral tunnel | 4 | 26 | 1.87 | Gadobenate dimeglumine | 20 | 45.9 | 58% | 34.1 | 80.3 |
| 11 | Triscuspid Atresia with Dilated right atrium | Intracardiac Fontan (atriopulmonary connection) | 6 | 40 | 1.74 | Gadobenate dimeglumine | 20 | 37.9 | 42% | 53 | 90 |
4D Flow MRI Analysis:
Acquisition
The subjects were imaged on a 3.0T clinical imaging system (MR750, GE Healthcare) using an investigational radial acquisition 4D Flow MRI sequence known as Phase Contrast with Vastly undersampled Isotropic Projection Reconstruction (PC-VIPR)(18). 4D Flow MRI parameters were: 1.3mm isotropic spatial resolution, 260 to 320mm field of view, 3.7 to 6.2 ms repetition time, 40–400 cm/s velocity encoding, 9 to 17 minute scan time, and respiratory and cardiac gating(19). Velocity encoding was set for each subject by running a short 2D PC protocol at locations within the aorta for determination of the velocity range that must be captured by the 4D flow sequence. Contrast was administered in each patient, as defined in Table 1. Based on recent work, a scheme was used that allows for double gating to the electrocardiograph and respiratory cycles based on the bellows signal to provide a cardiac series of flow data for separate respiratory phases during a single free-breathing scan (19). A moving average filter was applied to the respiratory waveform to subdivide data into two 4D flow MRI datasets: above (inspiration) and below (expiration) the moving average bellows signal. Subsequently, a 40% acceptance threshold above and below the moving average for each respiratory cycle was applied to mitigate potential motion during active respiration. This window was chosen to mimic the standard prospective expiration respiratory gating in which data is only acquired during the lower 40–50% of the bellows signal.
Due to patient-specific regional image quality limitations, one Fontan patient was not analyzed for Fontan connection flow, and two Fontan patients were not analyzed for ventricular flow. Therefore, Fontan flow analysis was performed on ten of the eleven patients, and single ventricle flow analysis was performed on nine out of the eleven patients.
4D Flow Analysis
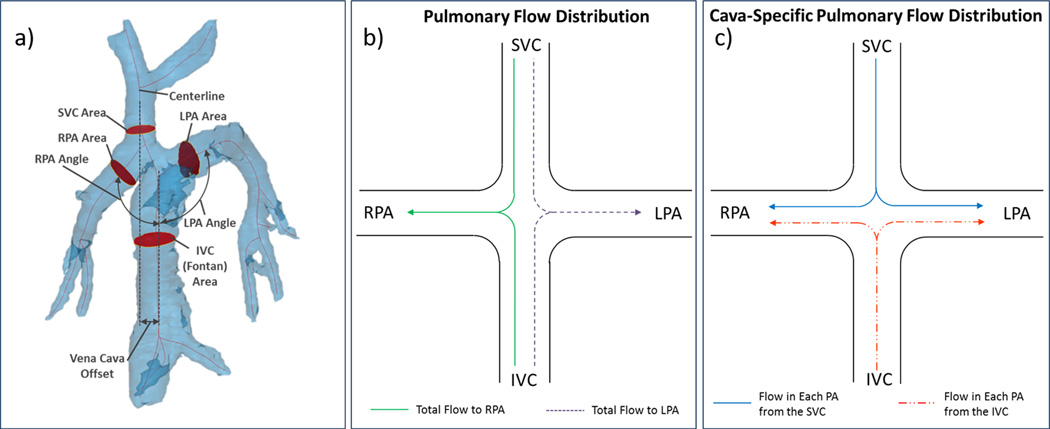
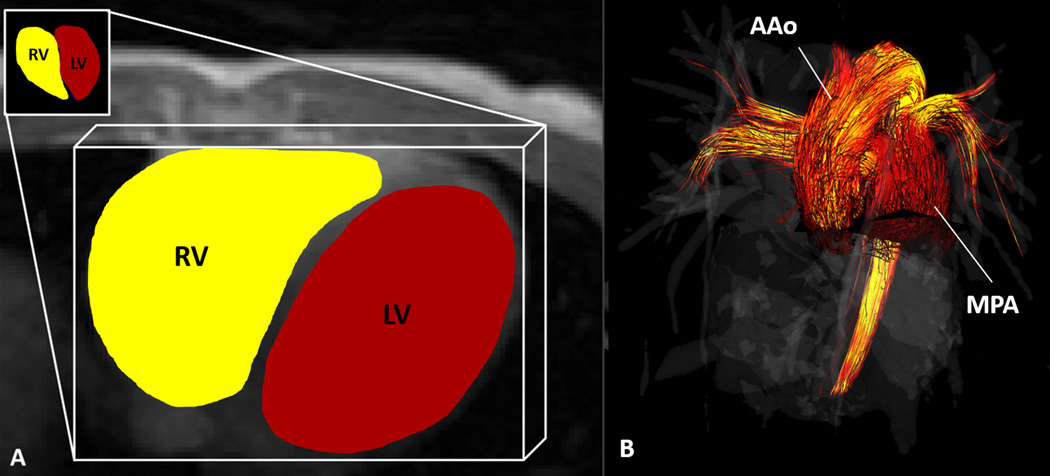
Time-resolved 4D Flow MRI data from both inspiration and expiration data sets were reconstructed into 14 time frames per cardiac cycle. Phase offsets for Maxwell terms and eddy currents were corrected automatically during reconstruction based on a pre-defined tissue threshold level (20,21). Thresholding was verified after reconstruction with a Matlab (Mathworks, Natick, MA) – based tool, giving an option for further correction when necessary. Velocity-weighted angiograms were calculated from the final velocity and magnitude data for all 14 time frames (18). The two image sets (inspiration and expiration) from 4D flow MRI data were then exported to an advanced visualization software package (EnSight, CEI). The masks generated from the Fontan anatomy segmentation (see Figure 1a and 2a for details) were applied to aid in definition of the fluid boundaries of each geometry. Cut planes were placed orthogonal to the ascending aorta (AAo) and main pulmonary artery (MPA) in healthy volunteers and in the AAo of single ventricle patients. Planes were also placed perpendicular to the vessel flow path in the superior vena cava (SVC), inferior vena cava (IVC), left pulmonary artery (LPA), and right pulmonary artery (RPA) of each Fontan model (Figure 1a), and velocity vectors were generated. Metrics of flow (mL/min) and average kinetic energy (KE= ½ mv2 [mJ]) were computed from the velocity vectors and cross-sectional areas at each plane. The same analysis was performed for both expiration and inspiration data-sets.
Figure 1.
4D MRI data can be used for geometric parameterization of TCPC flow paths and quantification of pulmonary flow distribution. a) Vena cava offset, cava-to-pulmonary angle, and vessel cross-sectional area measurement locations are shown on the patient 5 model b) Pulmonary flow distribution and c) Cava-specific flow distribution, as described in the text
Figure 2.
4D Flow MRI was used to calculate (A) kinetic energy in the right (RV) and left (LV) ventricles of healthy volunteers and in the single ventricles of Fontan patients. (B) flow through the main pulmonary artery (MPA) and ascending aorta (AAo) in healthy volunteers and the AAo in single ventricle patients.
Pulmonary Distribution Determination
To analyze the variation in flow distribution from the SVC and IVC to the RPA and LPA during expiration and inspiration, two distribution parameters were defined, as represented in Figure 1b and 1c. Pulmonary flow distribution describes the amount of flow that distributes to either the RPA or the LPA relative to total caval flow (SVC flow + IVC flow). This was quantified by calculating the percentage of total outflow that reached the left and right pulmonary artery. Cava-specific pulmonary flow distribution represents the amount of flow from the IVC and SVC, separately, that distributes to the RPA and the LPA. To quantify cava-specific pulmonary flow distribution, particles were emitted in Ensight from the IVC and SVC cut planes to produce streamlines throughout the model. Data were averaged over each respiratory phase, therefore flow was analyzed as “steady,” and streamlines were representative of the fluid particle paths. A streamline analyzer tool was then used to count the number of particles that flowed through each plane of the model. The number of particles passing through each pulmonary branch were recorded and categorized based on their origin (IVC or SVC), and cava-specific streamline distributions were calculated. This process was performed for both inspiration and expiration data sets for each patient.
Ventricular Kinetic Energy:
The KE within each ventricle was quantified through analysis of the MR image data files and segmented ventricular volumes using Matlab (Mathworks, Natick, MA). This calculation was made with the standard KE equation, as noted in the 4D flow Analysis section above. The mass of blood, m, was calculated by multiplying the density of blood (ρ = 1060 kg/m3) by the volume of each voxel within the ventricle. The velocity, v, of each voxel was obtained throughout the cardiac cycle from the 4D Flow MRI data. The KE from each voxel within the ventricular volume was then summed to obtain the total KE in both the RV (KERV) and LV (KELV) of each healthy subject and in the single ventricle (KESV) of each Fontan patient during all time points of the cardiac cycle. Additionally, QMPA and QAAo were normalized to KERV and KELV (or KESV), respectively, as an index of cardiac efficiency. Lastly, the Reynolds number and vorticity were calculated in the great vessels and ventricles, respectively, of each patient and healthy volunteer.
Reynolds Number:
The Reynolds number (Re) is a dimensionless quantity that can indicate the type of flow patterns that may develop in a fluid. In this study, the Reynolds number was calculated to examine its relationship to other hemodynamic parameters in states of health and disease. Reynolds number was calculated in the great vessels of each patient and subject using the equation,
where Q represents the blood flow rate through the great vessel cross section of area A and hydraulic diameter DH with kinematic viscosity . Hydraulic diameter was determined by first measuring the minimum and maximum vessel radii from the MR image segmentation, and then using the equation,
where , R1 is the largest radius of the vessel cross-section, and R2 is the smallest radius of the vessel cross-section.
Vorticity:
Vorticity represents the magnitude of the three components of flow rotation,
where x, y, and z represent the three coordinate directions. The degree of vortex formation may indicate the level of energy conservation in the ventricular flow. Using 4D Flow MRI data, the components of flow rotation were computed within each voxel of the segmented ventricular volumes. The magnitudes of the three components of vorticity were computed and summed throughout each ventricle. This time-averaged calculation was performed for each subject in Ensight (CEI, Apex, NC).
Stroke Volume Indexing:
Aortic flow, ventricular kinetic energy, and ventricular vorticity parameters were indexed to the stroke volume of each healthy volunteer and Fontan patient. This was done to provide a normalized parameter that accounts for the total work capacity of each individual ventricle.
Single Ventricle Morphology:
The ventricular morphology denotes whether the right or left ventricle was used as the systemic ventricle in the Fontan patients and surgical palliation. As a separate analysis from the healthy/Fontan comparison, the cardiac flow dynamics of the single ventricle patients were analyzed based on their ventricular morphology. Five of the Fontan patients that were analyzed for ventricular flow had left ventricle morphology and four had right ventricle morphology. Flow index, kinetic energy, and efficiency index were compared between these two groups. Right and left ventricular morphologies were not compared to corresponding healthy volunteer right and left ventricles due to the confounding factor that all single ventricles are used as a the systemic ventricle in Fontan circulation. Therefore, when comparing healthy and Fontan ventricular flow dynamics, the left (systemic) ventricle of each healthy volunteer was used for analyses.
Statistical Analysis:
Hemodynamic parameters measured from healthy volunteer and single ventricle patient data were compared using a Student’s t-test for unequal sample sizes. Linear regression analyses were also performed to determine the strength of correlations between measured parameters.
RESULTS
Fontan Connection Flow
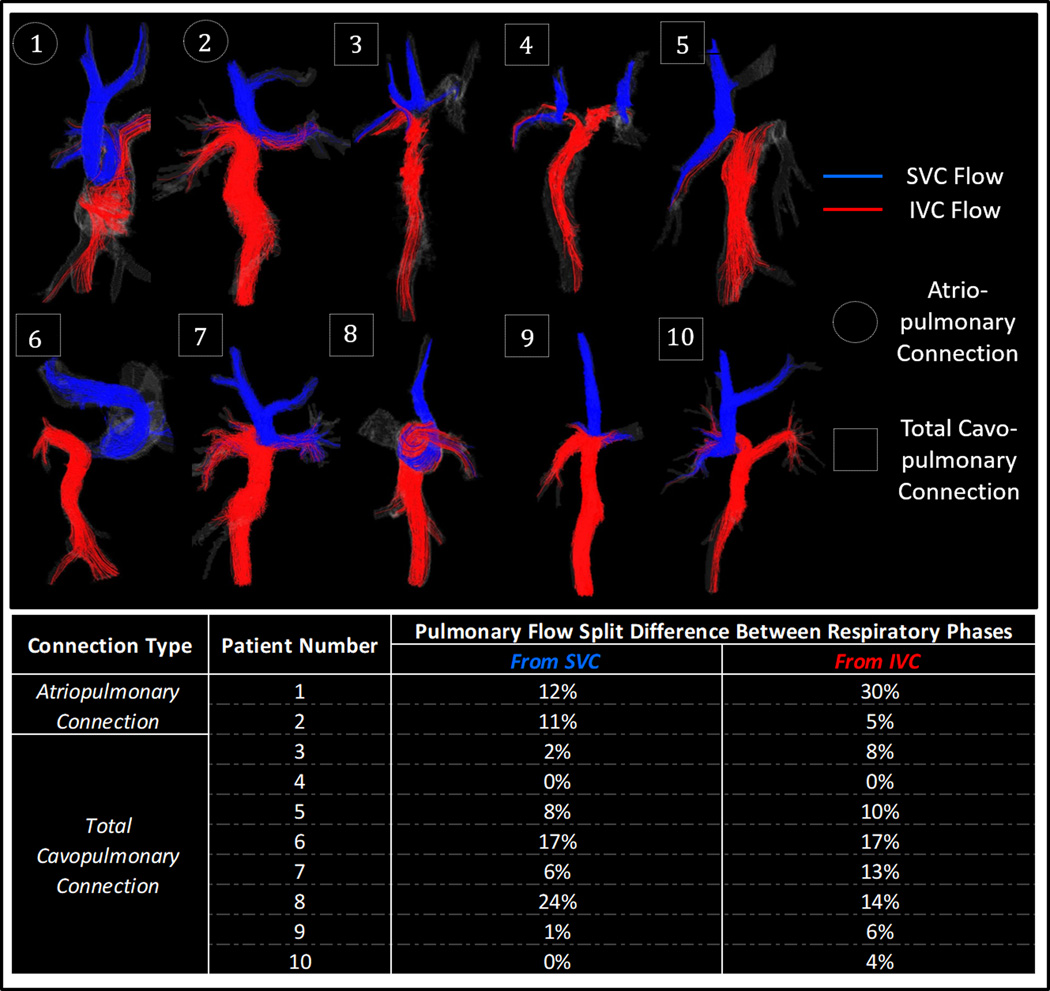
Cava-specific flow distributions obtained from the particle trace analysis of both respiratory phases, for each pulmonary branch and vena cava origin, are displayed in Figure 3. A significant difference was observed in the cava-specific pulmonary flow distribution from the SVC (p=0.011) and IVC (p=0.003) between inspiration and expiration cycles. Note that these represent a magnitude change in flow split, and are not representative of a respiratory trend to direct flow either right or left. For example, LPA flow proportion did not increase in every subject during inspiration or decrease in every subject during expiration. Patients 3 and 4 have bilateral superior vena cava connections, which produced unique flow distribution results for these cases, as displayed in the Figure 3 streamlines. Total pulmonary flow distribution (non-cava-specific) tended to be evenly split in expiration with 52% to the RPA, while more flow tended to the left pulmonary artery during inspiration with 64% to the LPA (p=0.06).
Figure 3.
Streamlines through Fontan vessels for ten patients during free-breathing expiration. Flow from the SVC and IVC is shown in blue and red, respectively. Cava-specific pulmonary flow split percentage differences between inspiration and expiration respiratory phases are also shown.
When geometric parameters were correlated with hemodynamic results, some moderate to strong relationships were observed. The amount of inferior vena cava-specific flow directed to the LPA showed a strong positive correlation to the angle between the IVC and LPA in both expiration (r= 0.739, p=0.015) and inspiration (r=0.665, p=.036). Though not statistically significant, other moderate relationships were seen between right pulmonary flow percentage and RPA angle in both inspiration (r=0.473, p=.167) and expiration (r=0.481, p=.159), between cava-specific flow from the IVC and vena cava offset (r=0.409, p=0.240), and between pulmonary flow percentage and pulmonary area percentage for both inspiration(r=0.585, p=0.075) and expiration (r=0.619, p=.057). Five out of the ten eligible Fontan flow patients had a preferential IVC-specific right-left or left-right flow split (Fontan 2, 6, 7, 8, and 9 from Figure 3). However, no common geometric property was found in this patient subset to explain the extreme flow preference.
Ventricular Flow
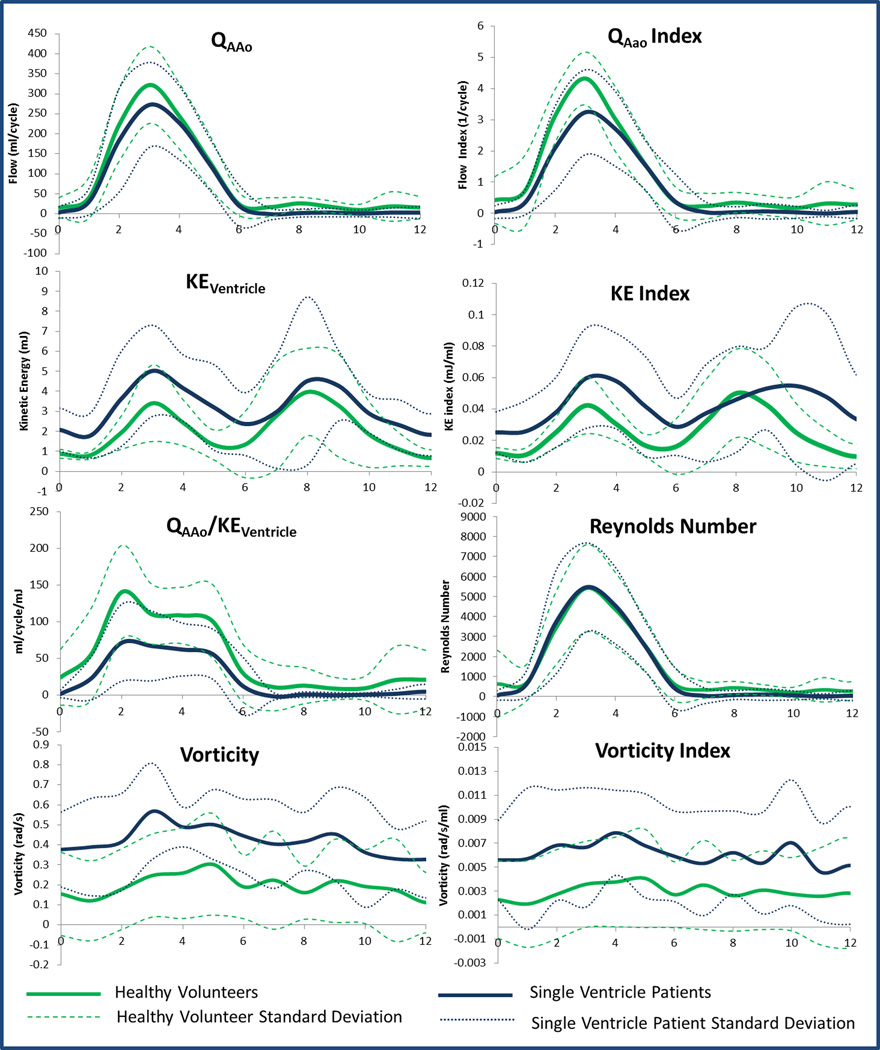
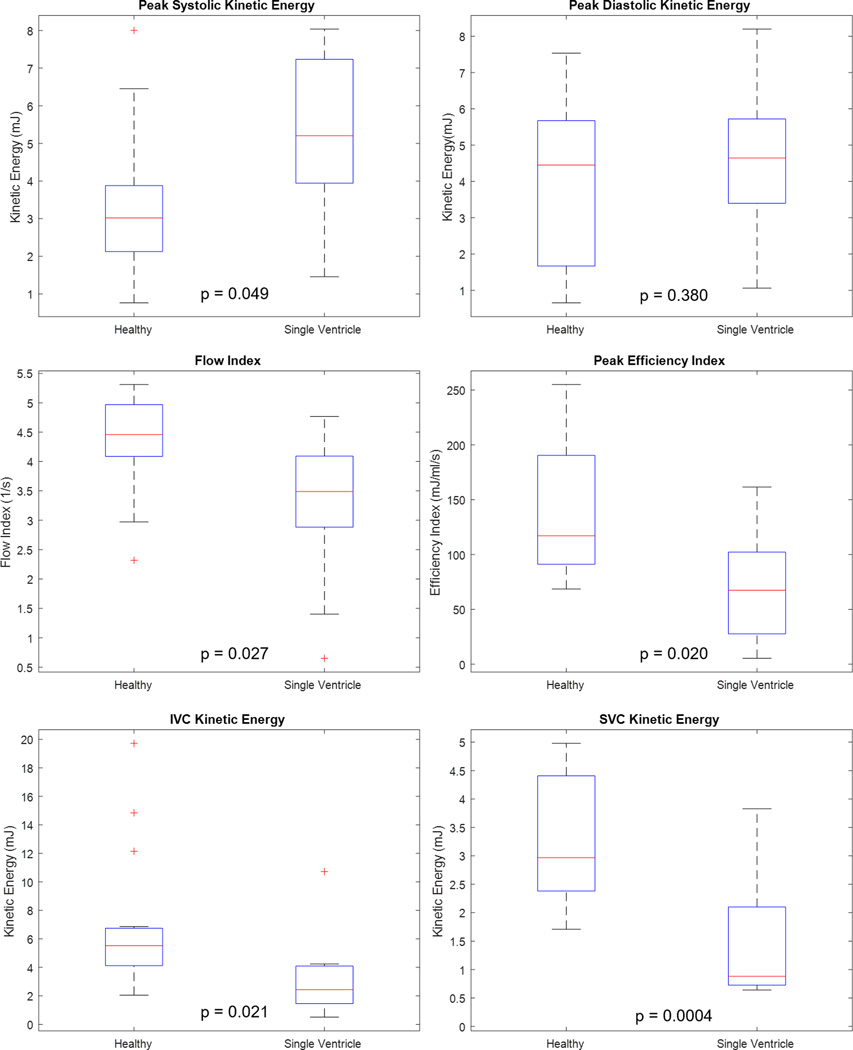
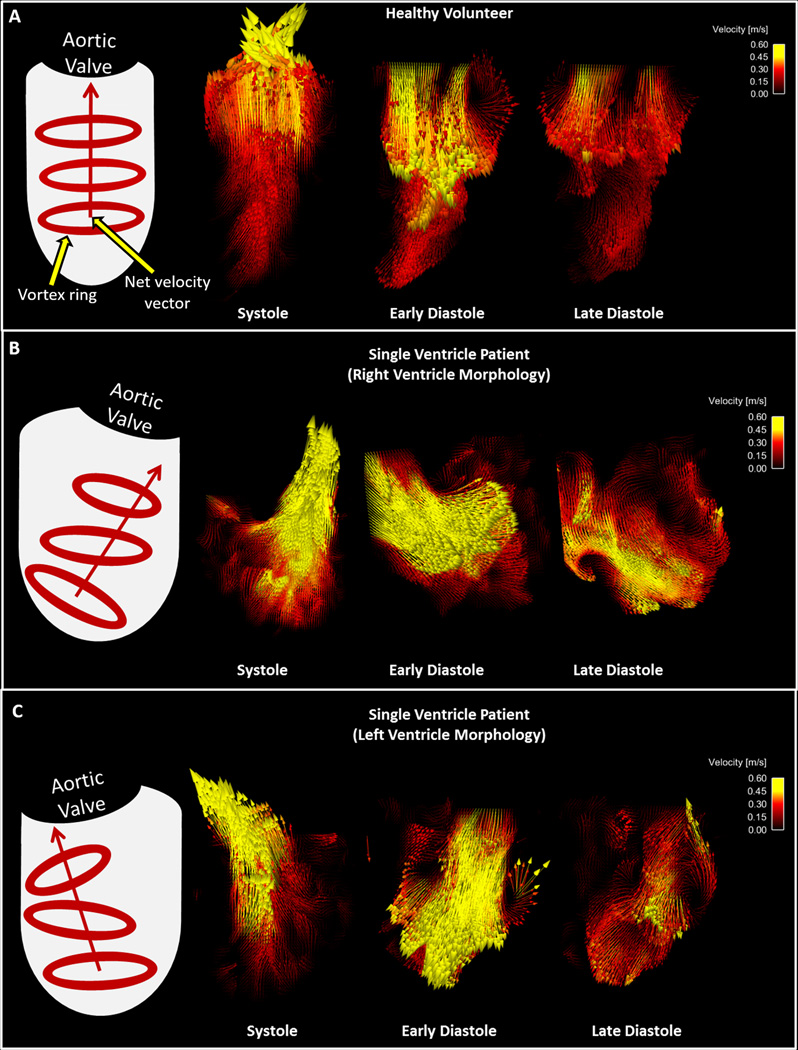
Average ventricular hemodynamic parameters for single ventricle patients and healthy volunteers were plotted over the cardiac cycle, as shown in Figure 4.As seen on the KE index curve, there was a significant diastolic delay in the KE peak of single ventricle patients compared to healthy volunteers (p=0.05). Cycle-averaged ventricular KE (p=0.009) and vorticity (p=0.001) – that is, KE and vorticity averaged over all 14 time-steps of the cardiac cycle - were higher in Fontan patients, while average efficiency index (p=0.049) was higher in healthy subjects. Reynolds Number profiles were nearly identical. Additionally, quantitative metrics on peak values of hemodynamics parameters were calculated, as displayed in Figure 5 and Table 2. Peak systolic KE was significantly higher in single ventricle patients than in healthy volunteers. Conversely, peak efficiency index, flow index, IVC KE, and SVC KE (Figure 4 and Table 2) were significantly higher in healthy volunteers than in Fontan patients. There was no significant difference in peak Reynolds Number between the two groups. In comparing ventricular morphology, the efficiency index was higher in the left ventricles than in the right ventricles of the healthy volunteers (p=0.02). There was also a moderate correlation between efficiency and vorticity in the RV (r=0.60, p=0.03) and LV (r=0.43, p=0.15) of healthy volunteers. These correlations were not present in single ventricle patients. Nonetheless, ventricular flow patterns, and the relationship to vorticity and net flow direction were plotted for healthy volunteers and single ventricle patients in Figure 6.
Figure 4.
Differences between healthy volunteers and single ventricle patients in average ascending aorta flow (QAAo), ventricular kinetic energy (KEventricle), efficiency index (QAAo/ Keventricle), vorticity, flow index (QAAo/stroke volume), KE Index (KE/stroke volume), and vorticity index (vorticity/stroke volume) were observed. Reynolds Number was similar between groups.
Figure 5.
Comparison of peak flow metrics observed in single ventricle patients with a Fontan connection and healthy volunteers. Flow index was obtained by normalizing aortic flow to stroke volume, and efficiency index was obtained through normalization of flow by expended kinetic energy.
Table 2.
Mean (± standard deviation) peak hemodynamic parameters calculated from respiratory- and cardiac-gated 4D Flow MRI in healthy volunteers and single ventricle patients. P-values represent the difference between healthy subjects and single ventricle patients.
| Parameter | Units | Healthy Volunteer (Maximum) | Single Ventricle (Maximum) | P-value |
|---|---|---|---|---|
| Flow | ml/cycle | 322 ± 96 | 272 ± 106 | 0.132 |
| Flow Index (Flow/Stroke Volume) | 1/cycle | 4.32 ± 0.85 | 3.24 ± 1.36 | 0.027 |
| Ventricle KE (Systole) | mJ | 3.16 ± 1.60 | 5.02 ± 2.28 | 0.049 |
| Ventricle KE (Diastole) | mJ | 3.72 ± 2.01 | 4.52 ± 4.20 | 0.38 |
| Efficiency Index (KE/Flow) | ml/cycle/mJ | 140 ± 64 | 71 ± 52 | 0.02 |
| Vorticity | rad/s | 0.26 ± 0.23 | 0.57 ± 0.24 | 0.212 |
| Reynolds Number | - | 5401 ± 2177 | 5454 ± 2222 | 0.478 |
| Aorta Relative Area Change | % | 46 | 45 | 0.5 |
| SVC Relative Area Change | % | 65 | 36 | 0.004 |
| IVC Relative Area Change | % | 41 | 66 | 0.125 |
| IVC KE | mJ | 6.98 | 3.2 | 0.021 |
| SVC KE | mJ | 3.34 | 1.44 | 0.0004 |
Figure 6.
Velocity vectors in the ventricles of a A) Healthy Volunteer and single ventricle patients with B) Right ventricle morphology and C) Left ventricle morphology during systole and diastole. Ventricle graphics on the left of the figure depict the trends overserved in vortex formation and net velocity vector direction for each group.
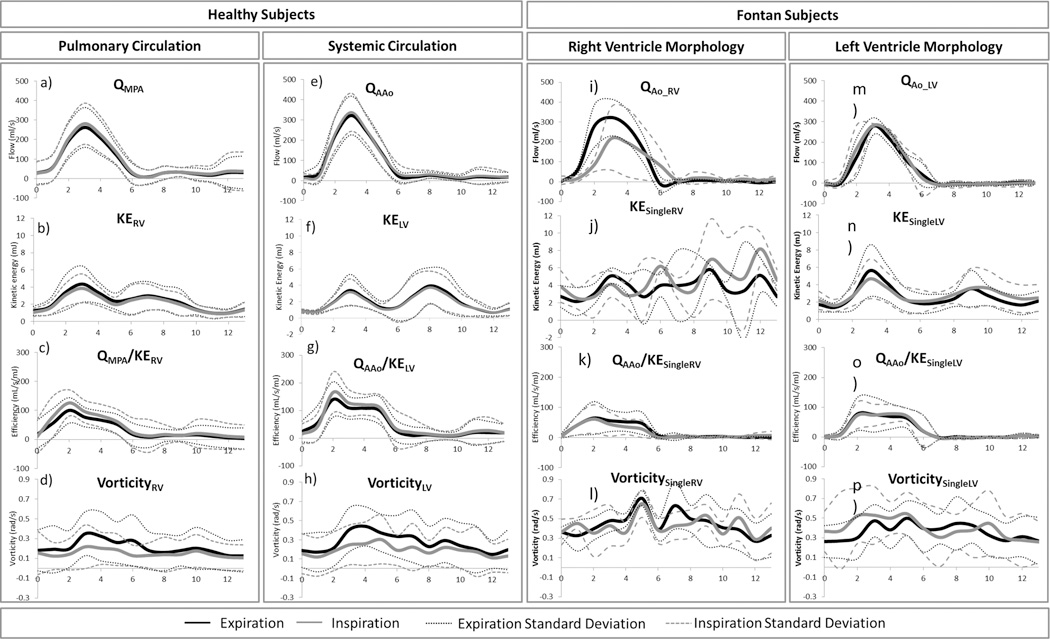
There was non-significant variation in the cardiac flow dynamics between respiratory phases of both healthy volunteers and single ventricle patients, as shown in Figure 7. However, some non-significant respiratory variation can be observed in the Fontan subject data, particularly with the right ventricle morphology. Figure 7 also lends itself to a comparison of hemodynamic parameters between ventricle morphologies of the Fontan patients group. Peak flow (p=0.055) tended to be higher in the patients with left ventricle morphology than those with right ventricle morphology. Peak diastolic kinetic energy was significantly higher in patients with right ventricle morphology (p=0.039), while there was no significant difference in peak systolic kinetic energy (p=0.366).
Figure 7.
Differences between respiratory phases (inspiration and expiration) in great vessel flow, ventricular kinetic energy (KE), efficiency index (Q/ KE), and vorticity of healthy volunteer right (RV) and left (LV) ventricle and Fontan patient single ventricles (SV) of right and left ventricle morphology.
DISCUSSION
Comprehensive evaluation of the single ventricle circulation of Fontan patients can provide insight on the multi-factorial, inter-related, complications of this patient group. Through the use of an investigational 4D flow MRI sequence that provides large volumetric coverage in shorter scan times, we observed multiple flow dynamic trends in both the cavopulmonary connection and single ventricle of Fontan patients.
Vena cava flow is often unevenly distributed through the pulmonary arteries creating differential lung perfusions. This flow imbalance needs to be quantified before corrective treatment can be administered; however, many confounding factors caused by surrounding physiological motion can influence the accuracy of flow quantification in the Fontan. To examine specific effects of respiratory variation on cava-to-pulmonary flow, we analyzed the contribution of flow from the SVC and IVC to the each of the pulmonary arteries during both inspiration and expiration plateaus. A difference was observed in cava-specific pulmonary flow from both the SVC and IVC between inspiration and expiration. The largest difference was seen for subject 8, whose cava-specific distribution varied between plateaus by almost 25% for the SVC and almost 15% for the IVC.(22) Such variation between cycles may have an impact on quantitative Fontan flow results.
There were also large patient-specific variations and high variability among respiratory plateaus for total flow and kinetic energy parameters, although they were not significant. Interestingly, the changes in kinetic energy were more evident than those in flow distribution. This suggests that acceleration of the fluid within the vessels may be changed as a result of intrathoracic pressure changes in the different respiratory phases. The altered acceleration may be partially responsible for the change in streamline distribution between inspiration and expiration. Altered acceleration of fluid within the IVC and SVC during the respiratory phases may also disrupt venous return which may explain the diastolic delay observed in the diastolic KE peak in single ventricle patients. Further, reductions in IVC and SVC KE over time may be an indication of pathological pulmonary vascular remodeling and rising pulmonary vascular resistance, which is a complication of the Fontan physiology.(23) The Fontan circulation is uniquely vulnerable to unfavorable lung mechanics and abnormal pulmonary function is highly prevalent in this population.(24,25) MR quantification of cavopulmonary flow may provide an additional tool to evaluate the complex cardiopulmonary interplay in this distinctive physiology.
To examine relationships between Fontan hemodynamics and anatomy, geometric parameters from each Fontan flow path were measured and compared with hemodynamic trends. The positive trends between cava-specific pulmonary flow imbalance and both pulmonary cross-sectional area imbalance and pulmonary angle reinforce the idea that geometric considerations play a role in determining the cava-specific flow distribution of IVC flow to the lungs. This is further supported by the positive correlation between the proportion of total flow passing through each pulmonary artery and the cross-sectional area of the PA. The relationships observed between flow and geometric characteristics may also explain why, that independent of respiratory phase, the flow from vena cava distributed unequally to the right and left pulmonary arteries in every case with a single superior vena cava. The uneven cavopulmonary distribution may have negative implications for downstream pulmonary function. Both the geometric parameters and flow distributions showed large variation between patients, with the largest deviation seen in case 6, where the superior and inferior vena cava flows distribute almost completely to the left and right pulmonary branches, respectively. The large variation between patient anatomy and hemodynamic data underpins the importance of patient–specific analysis for Fontan pathology.
4D flow MRI derived hemodynamic metrics based on cardiac work and energy dissipation may offer further information to evaluate cardiac function through the analysis of blood velocity and flow patterns in the heart. The rational for these metrics is rooted in the concept of cardiac work, which has two main components: kinetic energy and stroke work (SW) (17). Despite its small contribution to the total work of the healthy, resting heart, KE can be a significant indicator of overall cardiac function. As opposed to SW, which represents the work imposed by the motion of the heart, KE indicates the energy that is dissipated with blood motion. Therefore, the ratio of generated flow to KE may be indicative of efficiency of the cardiac pump.
Through ventricular flow analysis on 15 healthy subjects and 9 single ventricle patients with 4D Flow MRI, some trends in flow dynamic comparisons were found. Average and peak systolic KE metrics were significantly higher in Fontan patients than in healthy volunteers, which agree with previously published studies on other cardiac conditions.(10,16) Along with lower peak aortic flows, the higher KE led to lower average and peak efficiency indices in the Fontan group. In addition to lowering efficiency, the high afterload and lack of a pulsatile pulmonary circuit may also lead to a delay in diastolic kick. This is supported by the significant difference found between Fontan patients and healthy controls in the time at which KE peaked during diastole. Through a closer look at these effects downstream of the single ventricle, we observed that KE values in the SVC and IVC were lower in Fontan patients than in the healthy subjects. Therefore, as expected, more energy is lost throughout the Fontan patient systemic circulation, beginning with the higher loss of energy in the single ventricle. This issue is likely further exacerbated by the effects of the passive circulation heavily impacted by pulmonary function.
It was theorized that higher vortex formation would result in higher cardiac efficiency, and therefore, higher vorticity was expected from the more efficient healthy heart than from the single ventricle in the Fontan patients. The ventricular efficiency indices showed positive correlations with the degree of vorticity in the healthy subjects, but not in Fontan patients. Furthermore, we observed that LV vorticity was, on average, higher than RV vorticity, which is presumed to support the higher efficiency of the LV. However, the results of this study showed no significant difference in the magnitude of peak diastolic or peak systolic vorticity between healthy subjects and Fontan patients, and even suggested higher cycle-averaged vortex formation in the Fontan patients. This may seem like a contradiction to previous data that shows stronger, more developed, vortices in a normal ventricle than in an abnormal ventricle (insert reference – Hong, et al.), and warrants further study. However there is a potential explanation for this observation. In the healthy heart, a large vortex ring that directs flows to the aortic valve is known to conserve energy and facilitate efficient transmission of blood into the systemic circulation. However, this may not translate into total vorticity. For example, if there are many unorganized areas of vortex formation (and thus higher net vorticity) that direct the net velocity vector indirectly toward the aortic valve, then flow could be disrupted and efficiency could be decreased. This can be observed through qualitative analysis of the ventricular velocity vectors in the results section of this manuscript. Nevertheless, further work is needed to understand the relationship between vortex formation and ventricular efficiency in Fontan patients.
Despite quantitative and qualitative differences between patients and controls in flow, KE, efficiency index, and vorticity, the average Reynolds number profiles of the two groups were found to be very similar. This suggests that regardless of the anatomical differences of the single ventricle setup, the system will adapt to normalize the inertial and viscous flow forces and maintain normal patterns of laminar or turbulent flow. Based on the comparison of average aortic hydraulic diameter (Healthy: 26.72 ± 2.64 mm; Fontan: 31.30 ± 5.06mm), the majority of this normalization is hypothesized to be done through dilation of the aorta, which is prevalent in patients with Fontan palliation (26).
Due to the higher demand of pumping power and work for systemic blood flow, healthy volunteer LV efficiency was expected to be higher than RV efficiency during systole. This assumption was supported by our results that showed higher peak systolic LV efficiency than RV efficiency in healthy volunteers. The hemodynamic differences between left and right ventricles may be important considerations when analyzing single ventricle flow based on ventricular morphology. Through comparison of right and left ventricle morphologies, we found a significant difference in peak diastolic energy, and tendencies for higher flow and efficiency indices in left ventricle morphology. These differences suggest, as one may expect, that left ventricle morphology produces a more efficient and functional systemic ventricle. It is important to note that these comparisons were limited by the small sample sizes of each morphology group. However, they indicate that differences in flow dynamics may play an important role when considering function and efficiency of the two morphology types. With further study, a thorough knowledge of right and left ventricular morphology flow dynamics in Fontan patients may inform the way surgical procedures are performed with regard to design for hemodynamic efficiency.
There are some limitations to this study that warrant discussion. First of all, there were a limited number of patients used for this study. Fifteen Fontan patients were originally recruited and scanned for overall assessment of Fontan circulation, along with 15 age-matched volunteers. However, six of the fifteen Fontan patient data sets did not have adequate ventricular flow resolution and 5 of the patient data sets did not have adequate cavopulmonary resolution for accurate assessment of the hemodynamic metrics quantified in this study. This is presumed to be a result of image artifact produced by metal that remained in the chest wall after post-surgery closure (With experience, this issue can be resolved in future procedures and imaging studies). Combined with the large heterogeneity in Fontan configurations in this group, this made generalizations on geometric and hemodynamic trends difficult. Nonetheless, the heterogeneity allowed for analysis of flow and geometry in a wide range of situations that would not have been possible in a more uniform group. Another limiting factor in this work was the difficulty of analyzing vortex core formation, particularly in the Fontan patient group. This was, in part, expected to be a result of the altered single ventricle flow and the inherent difficulty of imaging swirling flow in the heart. Nonetheless, further work is needed in the development of ventricular vortex quantification methods that effectively separate true vortex formation from image noise produced by ventricular cross-flow. Finally, the comparative analysis of hemodynamics based on ventricular morphology was limited due to the small sample size of each group. Analysis of the two morphology groups would benefit from larger sample sizes of both right and left ventricle morphologies. In conclusion, using a 4D flow MRI sequence that provides large volumetric coverage in reduced scan times, we observed multiple flow dynamic trends in both the cavopulmonary connection and single ventricle of Fontan patients. Through this imaging modality, observations were made on both visual depictions of flow fields and on quantitative flow dynamic metrics, such as velocity, kinetic energy, vorticity, and efficiency indices. Furthermore, to provide a reference standard, these metrics were compared against those of healthy age-matched volunteers. Between-patient variability in the results of the Fontan group inhibited strong generalizations on flow dynamic parameters. However, this between-patient variability also underscored the importance of patient-specific analysis for this patient group. As demonstrated in this study, 4D flow MRI can be potentially useful for this type of comprehensive patient-specific clinical analysis in single ventricle patients with a Fontan connection.
References
- 1.Collins RT, Doshi P, Onukwube J, Fram RY, Robbins JM. Risk Factors for Increased Hospital Resource Utilization and In-Hospital Mortality in Adults With Single Ventricle Congenital Heart Disease. Am J Cardiol 2016;118(3):453–462. [DOI] [PubMed] [Google Scholar]
- 2.Khairy P, Fernandes SM, Mayer JE, et al. Long-term survival, modes of death, and predictors of mortality in patients with Fontan surgery. Circulation 2008;117(1):85–92. [DOI] [PubMed] [Google Scholar]
- 3.Imoto Y, Sese A, Joh K. Redirection of the hepatic venous flow for the treatment of pulmonary arteriovenous malformations after Fontan operation. Pediatr Cardiol 2006;27(4):490–492. [DOI] [PubMed] [Google Scholar]
- 4.Körperich H, Barth P, Gieseke J, et al. Impact of respiration on stroke volumes in paediatric controls and in patients after Fontan procedure assessed by MR real-time phase-velocity mapping. Eur Heart J Cardiovasc Imaging 2015;16(2):198–209. [DOI] [PubMed] [Google Scholar]
- 5.Hsia TY, Khambadkone S, Redington AN, Migliavacca F, Deanfield JE, de Leval MR. Effects of respiration and gravity on infradiaphragmatic venous flow in normal and Fontan patients. Circulation 2000;102(19 Suppl 3):III148–153. [DOI] [PubMed] [Google Scholar]
- 6.Wei Z, Whitehead KK, Khiabani RH, et al. Respiratory Effects on Fontan Circulation During Rest and Exercise Using Real-Time Cardiac Magnetic Resonance Imaging. Ann Thorac Surg 2016;101(5):1818–1825. [DOI] [PMC free article] [PubMed] [Google Scholar]
- 7.Sjöberg P, Heiberg E, Wingren P, et al. Decreased Diastolic Ventricular Kinetic Energy in Young Patients with Fontan Circulation Demonstrated by Four-Dimensional Cardiac Magnetic Resonance Imaging. Pediatr Cardiol 2017;38(4):669–680. [DOI] [PMC free article] [PubMed] [Google Scholar]
- 8.Han QJ, Witschey WR, Fang-Yen CM, et al. Altered Right Ventricular Kinetic Energy Work Density and Viscous Energy Dissipation in Patients with Pulmonary Arterial Hypertension: A Pilot Study Using 4D Flow MRI. PLoS One 2015;10(9):e0138365. [DOI] [PMC free article] [PubMed] [Google Scholar]
- 9.Gürel E, Prinz C, Van Casteren L, Gao H, Willems R, Voigt JU. The Impact of Function-Flow Interaction on Left Ventricular Efficiency in Patients with Conduction Abnormalities: A Particle Image Velocimetry and Tissue Doppler Study. J Am Soc Echocardiogr 2016;29(5):431–440. [DOI] [PubMed] [Google Scholar]
- 10.Kanski M, Arvidsson PM, Töger J, et al. Left ventricular fluid kinetic energy time curves in heart failure from cardiovascular magnetic resonance 4D flow data. J Cardiovasc Magn Reson 2015;17:111. [DOI] [PMC free article] [PubMed] [Google Scholar]
- 11.Sjöberg P, Heiberg E, Wingren P, et al. Erratum to: Decreased Diastolic Ventricular Kinetic Energy in Young Patients with Fontan Circulation Demonstrated by Four-Dimensional Cardiac Magnetic Resonance Imaging. Pediatric Cardiology 2017;385:1087. [DOI] [PMC free article] [PubMed] [Google Scholar]
- 12.Wong J, Chabiniok R, Pushparajah K, et al. Kinetic Energy Ejection Fraction: A Better Marker Of Cardiac Function In The Single Ventricle Circulation. Journal of the American College of Cardiology 2015;65(10). [Google Scholar]
- 13.Al-Wakeel N, Fernandes JF, Amiri A, et al. Hemodynamic and energetic aspects of the left ventricle in patients with mitral regurgitation before and after mitral valve surgery. J Magn Reson Imaging 2015;42(6):1705–1712. [DOI] [PubMed] [Google Scholar]
- 14.Pierrakos O, Vlachos PP. The effect of vortex formation on left ventricular filling and mitral valve efficiency. J Biomech Eng 2006;128(4):527–539. [DOI] [PubMed] [Google Scholar]
- 15.Bermejo J, Benito Y, Alhama M, et al. Intraventricular vortex properties in nonischemic dilated cardiomyopathy. Am J Physiol Heart Circ Physiol 2014;306(5):H718–729. [DOI] [PMC free article] [PubMed] [Google Scholar]
- 16.Jeong D, Anagnostopoulos PV, Roldan-Alzate A, et al. Ventricular kinetic energy may provide a novel noninvasive way to assess ventricular performance in patients with repaired tetralogy of Fallot. J Thorac Cardiovasc Surg 2015;149(5):1339–1347. [DOI] [PMC free article] [PubMed] [Google Scholar]
- 17.Arvidsson PM, Töger J, Heiberg E, Carlsson M, Arheden H. Quantification of left and right atrial kinetic energy using four-dimensional intracardiac magnetic resonance imaging flow measurements. J Appl Physiol (1985) 2013;114(10):1472–1481. [DOI] [PubMed] [Google Scholar]
- 18.Johnson KM, Lum DP, Turski PA, Block WF, Mistretta CA, Wieben O. Improved 3D phase contrast MRI with off-resonance corrected dual echo VIPR. Magn Reson Med 2008;60(6):1329–1336. [DOI] [PMC free article] [PubMed] [Google Scholar]
- 19.Schrauben EM, Anderson AG, Johnson KM, Wieben O. Respiratory-induced venous blood flow effects using flexible retrospective double-gating. J Magn Reson Imaging 2015;42(1):211–216. [DOI] [PubMed] [Google Scholar]
- 20.Walker PG, Cranney GB, Scheidegger MB, Waseleski G, Pohost GM, Yoganathan AP. Semiautomated method for noise reduction and background phase error correction in MR phase velocity data. J Magn Reson Imaging 1993;3(3):521–530. [DOI] [PubMed] [Google Scholar]
- 21.Gu T, Korosec FR, Block WF, et al. PC VIPR: a high-speed 3D phase-contrast method for flow quantification and high-resolution angiography. AJNR Am J Neuroradiol 2005;26(4):743–749. [PMC free article] [PubMed] [Google Scholar]
- 22.Lardo AC, Webber SA, Friehs I, del Nido PJ, Cape EG. Fluid dynamic comparison of intra-atrial and extracardiac total cavopulmonary connections. J Thorac Cardiovasc Surg 1999;117(4):697–704. [DOI] [PubMed] [Google Scholar]
- 23.Gewillig M, Brown SC, Heying R, et al. Volume load paradox while preparing for the Fontan: not too much for the ventricle, not too little for the lungs. Interact Cardiovasc Thorac Surg 2010;10(2):262–265. [DOI] [PubMed] [Google Scholar]
- 24.Opotowsky AR, Landzberg MJ, Earing MG, et al. Abnormal spirometry after the Fontan procedure is common and associated with impaired aerobic capacity. Am J Physiol Heart Circ Physiol 2014;307(1):H110–117. [DOI] [PMC free article] [PubMed] [Google Scholar]
- 25.Turquetto ALR, Canêo LF, Agostinho DR, et al. Impaired Pulmonary Function is an Additional Potential Mechanism for the Reduction of Functional Capacity in Clinically Stable Fontan Patients. Pediatr Cardiol 2017;38(5):981–990. [DOI] [PubMed] [Google Scholar]
- 26.Kim YY, Rathod RH, Gauvreau K, Keenan EM, Del Nido P, Geva T. Factors associated with severe aortic dilation in patients with Fontan palliation. Heart 2017;103(4):280–286. [DOI] [PubMed] [Google Scholar]


