Figure 3.
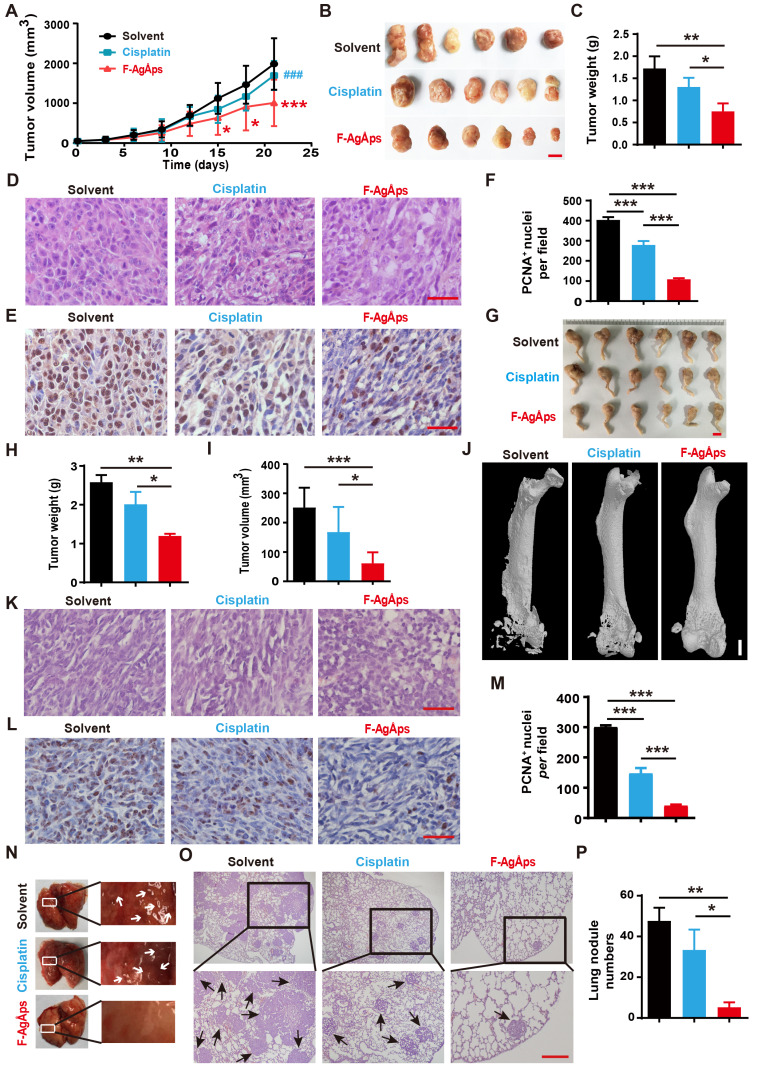
F-AgÅPs inhibit the growth and lung metastasis of osteosarcoma. (A) Tumor volumes of subcutaneous 143B xenograft-bearing mice in different treatment groups during an observation period of 21 days. n = 6 per group. (B and C) Photographs (B) and weights (C) of tumor samples from mice in (A) at days 21. Scale bar: 1 cm. n = 6 per group. (D) Representative images of the H&E-stained tumor sections from samples in (B). Scale bar: 50 µm. (E and F) Representative PCNA staining images (E) and quantification of the PCNA-positive cell numbers (F) in tumor sections from samples in (B). Scale bar: 50 µm. n = 3 per group. (G) Photographs of the right hindlimb samples from orthotopic SJSA-1-bearing mice receiving different treatments for 21 days. Scale bar: 1 cm. (H and I) Tumor weights (H) and volumes (I) of samples in (G). n = 6 per group. (J) Representative µCT images of the mouse right hindlimb specimens in (G). Scale bar: 1 mm. (K and L) Representative H&E (K) and PCNA (L) staining images of tumor specimens in (G). Scale bar: 50 µm. (M) Quantification of the PCNA-positive cell numbers. n = 3 per group. (N) Gross view of lungs from mice in (G). (O and P) Representative images of the H&E-stained lung sections (O) and quantification of the metastatic tumor nodule numbers (P). Scale bar: 200 µm. n = 3 per group. Data are shown as mean ± SD. *#P < 0.05, **/##P < 0.01, ***/###P < 0.001. For (A): *P < 0.05 vs. solvent group, #P < 0.05 vs. F-AgÅPs group.

