Abstract
Here, we assess infrared matrix assisted laser desorption electrospray ionization (IR-MALDESI) mass spectrometry imaging (MSI) analysis of hair as a clinical tool for monitoring patient adherence to the antiretroviral maraviroc (MVC). A custom MATLAB-based algorithm has been developed to streamline data analysis and generate longitudinal profiles of drug incorporation along the length of hair strands. Hair strands from volunteers enrolled in a directly observed therapy study were analyzed by IR-MALDESI MSI and processed using this tool to characterize the profiles of single doses and a daily dose regimen of MVC. Single dose responses were 1.7 [1.1, 2.5] mm (median [range]) wide along the length of the hair and were detected in 8 out of 12 volunteers. Daily dose profiles capturing 28 days of continuous dosing were approximately 5 times the intensity of single dose profiles and 10.5 [7.0, 13] mm wide, corresponding to 1 month of hair growth. MVC ion abundance was observed in all 12 volunteers for the daily dosing period. Daily dosing profiles were consistent with a model of MVC accumulation in hair based on linear superposition of a single dose response, indicating the potential for prediction of daily drug-taking behavior based on deconvolution of a complex longitudinal profile in hair.
Graphical abstract

Antiretroviral (ARV) therapy potently suppresses HIV replication.1,2 In addition, ARV therapy has been shown to prevent the spread of HIV from infected individuals and is used to prevent HIV acquisition in high-risk populations using pre-exposure prophylaxis (PrEP).3–5 ARV medicines are most commonly administered as a fixed oral dose, intended to be taken daily by the patient. Other dosing schemes, such as dosing before and after sexual activity, have also shown to reduce the risk of spreading of HIV.6 In either case, proper adherence to ARV medication is essential for its efficacy. If infected patients are not adherent to ARV medication (i.e., do not take medicine or miss doses), the virus can rebound, and they run the risk of developing drug resistance.7,8 For patients on PrEP regimens, nonadherence increases risk of contracting HIV.3,4 Thus, adherence to ARVs is critical for the suppression of HIV and the prevention of its spread.
Ideally, measures of adherence should be objective, non-invasive, assessed rapidly (during a clinical visit), able to quantify adherence longitudinally, and provide clinicians with a tool to communicate with patients. Current methods of monitoring patient adherence are subject to reporting bias, indirect measures, provide a short-term picture of adherence, or do not allow real-time (in clinic) feedback. Self-reporting and pill counting methods are simple to implement, but clinical trials have shown these methods overestimate patient adherence compared to pharmacologic measures.9,10 Pharmacy refill data are routinely used to measure adherence, but these methods only give an overview of adherence at the time of refill and can be easily manipulated.11,12 Electronic systems, such as medication event monitoring systems (MEMS), can remotely provide data when pharmaceutical containers are opened but are complex and do not provide objective evidence that a patient’s medication has been ingested.13,14 Plasma and peripheral blood mononuclear cells (PBMCs) have been used regularly as a direct measure of systemic exposure, but sample collection is invasive and can only capture a short-term period of response based on elimination half-life (plasma, <7 days; PBMCs, 7–14 days).15,16 In addition, collection of these matrices is invasive and may be complex to process.17
Analysis of hair has emerged as a potential long-term, objective measure of patient adherence.14,18 Many research groups have investigated hair analysis as a method for monitoring patient adherence to ARVs, exploring the effects and outcomes of varying cultural, demographic, biological, and behavioral factors. 18–22 To date, most current analyses of ARVs in hair are performed with LC-MS/MS. While these methods are effective, they often require many (up to 100) strands of hair and long extraction times (overnight), which prevents hair analysis from taking place within the time frame of a clinic visit.23–25 In addition, the hair approximately 1 cm proximal to the scalp is commonly used for these assays, which reflects about 1 month of hair growth.26 Given that doses of ARVs are taken daily or on-demand, this approach gives limited temporal information about a patient’s adherence history. Sections of hair as short as 0.4 mm have been investigated by LC-MS/MS, but required precise sectioning (1 h for 3.8 cm of hair) and 24 h extraction times.27,28 Higher resolution methods without need for extensive sample preparation would be beneficial for monitoring adherence, at least daily to match the frequency of dosing events, as even 1 – 2 week interruptions in treatment can result in viral rebound.29,30 There is need for a high resolution strategy to objectively evaluate adherence on a daily scale.
Mass spectrometry imaging (MSI) is a powerful analytical technique that can sensitively and selectively detect a wide range of drug targets, while also providing high-resolution spatial information. As with LC-MS/MS, most MSI analysis of hair has focused on drugs of abuse.31–33 We have previously demonstrated MSI analysis of ARVs in hair using infrared matrix assisted laser desorption ionization (IR-MALDESI).34,35 While we have demonstrated the detection of ARVs in hair, we have yet to investigate the longitudinal profiles of ARVs in a controlled setting. Understanding a longitudinal profile will require evaluating the profile of different observed dosing strategies, understanding dose–response relationships, and evaluating the response of adherent versus non- or remotely adherent patients.
Here, we demonstrate the feasibility of IR-MALDESI MSI as a clinical tool to monitor patient adherence to ARVs, beginning with the entry inhibitor maraviroc (MVC), which has recently been investigated as a candidate for HIV PrEP.36 Our investigation centers on longitudinal profiles in hair from volunteers on single and daily dose regimens of MVC.
EXPERIMENTAL SECTION
Materials and Reagents.
Methanol (HPLC grade), acetonitrile (HPLC), water (HPLC), acetic acid (80% w/w), and formic acid (Optima) were obtained from Fisher Scientific (Hampton, NH). The electrospray solvent was a 50/50 mixture of methanol/water (v/v) with 0.2% formic acid. Deuterated maraviroc (MVC-d6) was used as internal standard (IS; Toronto Research Chemicals, North York, ON, Canada).
Study Design and Hair Collection.
Hair samples were collected from 12 volunteers (V1–12) dosed with 300 mg MVC during a directly observed therapy (DOT) study (NCT03218592). For single dose samples, hair samples were collected 28 days after a single dosing event. Next, all participants received a dose of MVC given daily for 28 days. Hair samples were collected on the 28th day after the end of the daily dosing regimen or 56 days after the start of the daily dosing. Each dosing event was observed by clinical staff to ensure 100% adherence to the regimen. Approximately 10 hair strands were cut close to the scalp with scissors and stored at 4 °C until analysis. The benchmarking sample was collected from an HIV+ patient adherent to MVC by shaving close to the scalp. The sample was then stored at 4 °C until analysis.
Sample Preparation and IR-MALDESI MSI Operation.
Hair strands were fixed to glass slides using double-sided tape (VHB Tape, 3M, St. Paul, MN). The slides were placed on a stage controlled by a thermoelectric cooler (TE Technology, Inc., Traverse City, MI) in an enclosed source. Samples were then cooled to −10 °C under nitrogen and given time to stabilize (~12 min). A layer of ice was grown on the sample by opening the source and exposing the sample to ambient humidity. Before MSI analysis, the source was closed, and the relative humidity was set around 14% using a steady flow of nitrogen.
An IR-MALDESI source was used for all imaging experiments adapted from previous work.34,37,38 A single laser pulse from an IR OPO laser (Opotek, Carlsbad, CA) tuned to 2.94 μm wavelength was used at each spot to ablate the ice-covered samples. The desorbed plume was extracted and ionized by a perpendicular electrospray that carried the sample into the mass spectrometer (ThermoFisher Q Exactive Plus, Bremen, Germany). The stage was translated in 100 μm increments to oversample based on the laser spot size (~200 μm). The mass spectrometer was operated in full scan mode (m/z 200–800; resolving power, 140 000 at m/z 200; s-lens RF level, 100; mass accuracy, <1 ppm). Communication and timing between the stage, laser, and mass spectrometer were controlled using a custom MATLAB program (The Mathworks, Inc., Natick, MA) and a microcontroller.
Data Processing.
Data were processed using MSiReader39,40 and custom MATLAB software. RAW files were converted to mzML using MSconvert, then converted to imzML before processing by MSiReader. Ion maps represent a mass window of 5 ppm centered on the peak of interest. Longitudinal profiles were generated using a custom MATLAB program.
RESULTS AND DISCUSSION
Longitudinal Profile Generation.
To demonstrate the viability of our MATLAB program to generate longitudinal profiles, hair strands from an adherent patient were analyzed. The patient was assumed to be adherent based on continuously suppressed virus in plasma (<50 copies HIV RNA/mL). IR-MALDESI MSI simultaneously measured response to endogenous lipids and drugs incorporated in hair strands. Figure 1A and B shows ion images for cholesterol (m/ z 369.3516, [M + H − H2O]+) and MVC (m/z 514.3352, [M + H]+) in four hair strands from an HIV+ patient taking MVC. Cholesterol identifies the location of the hair strands, and MVC is the target of interest. MVC is detected along the length of the hair strands, indicating that drug from oral doses has been incorporated into the hair.
Figure 1.
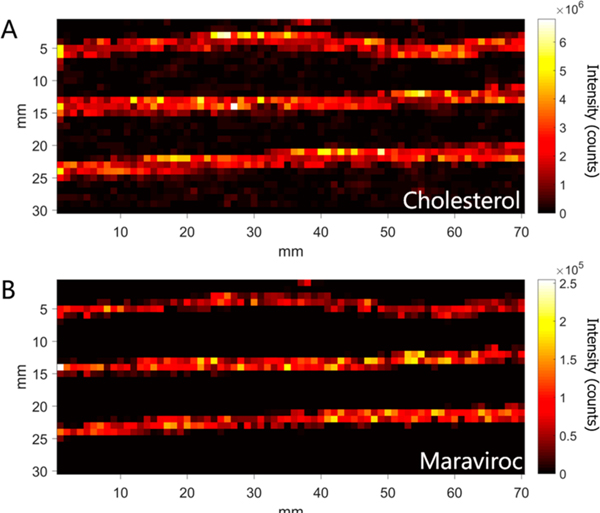
Mass spectrometry images of 3 hair strands from an HIV+ patient adherent to maraviroc. Ion images correspond to (A) cholesterol (m/z 369.3516, (M + H − H2O)+), as an endogenous marker, and (B) maraviroc (m/z 514.3352, (M + H)+), the drug of interest.
While MSI analysis is performed rectilinearly, mounted hair strands may be curved. To preserve the fidelity of the spatial location associated with each measurement, it is critical to generate a longitudinal profile along the axis of an individual hair strand. Our approach generated a profile using a custom MATLAB interface. This process took place in four steps. First, a line was fit to the center of each hair strand using cholesterol or another endogenous marker to delineate the extents of each strand (Figure 2A). The location of individual hair strands were selected by the user, and used to generated masked images containing a single hair strand. The center of the strand was located by using weighted average in each column of the image. Second, lines of a given width (input by the user, typically 400 μm or 4 voxels) were generated perpendicular to a line fit to the hair strand by calculating the normal vectors from two adjacent points along the center of the strand. Third, voxels intersected by each normal vector are spatially transformed to produce straightened images along the axis of the hair strands for each ion of interest (Figure 2B, cholesterol, and Figure 2C, MVC). Finally, longitudinal profiles are generated by radially averaging the ion abundance for all voxels sharing a transformed spatial location (Figure 2D and 2E). Figure 2B shows the straightened image of cholesterol from a curved hair strand in Figure 2A. The same transformation can be applied to other ions of interest, which we used to generate a straightened image corresponding to MVC in the same strand (Figure 2C). The profiles in Figure 2D and 2E are used to assess drug incorporation into the hair. Peaks in the profiles correspond to higher ion abundance in the MS image. For example, there is a peak in MVC ion abundance at about 2.5 mm in Figure 2E that corresponds to a peak in ion abundance in the same spot in the MS image in Figure 2C.
Figure 2.
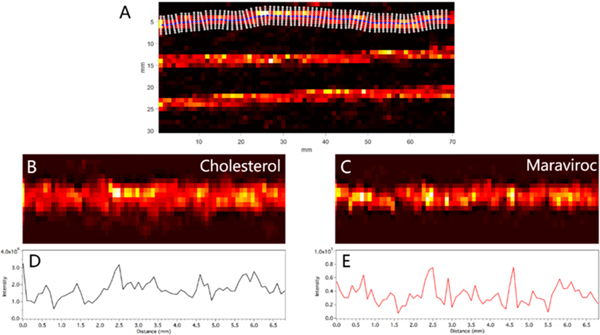
(A) Ion image from Figure 1 of cholesterol showing line fit to the center of the top strand and the vectors normal to that line. (B) Ion image of cholesterol after straightening algorithm is applied. (C) Ion image of maraviroc from the same strand after straightening algorithm is applied. (D) Longitudinal profile of cholesterol ion abundance along the length of the straightened image in panel B). (E) Longitudinal profile of maraviroc ion abundance on the length of the straightened imaged in panel C.
Detection of Single Doses.
Using the developed tool for profiling hair strands, length and shape of single dose responses were characterized. Hair samples (n = 4) from each of the 12 volunteers collected 28 days after a single dose of MVC were analyzed by IR-MALDESI MSI. The analysis window captured the proximal 13 mm of all hair strands. Images corresponding to cholesterol and MVC from one volunteer (V-6) are shown in Figure 3A and B, respectively. In this case, a band of MVC response is detected in each of the 4 hair strands analyzed. The longitudinal profile for the adjusted MVC intensity (MVC ion abundance/MVC-d6 ion abundance) along the length of the strand was smoothed with a moving average (n = 3) and is shown in Figure 3C. In each profile, there is a discrete band of MVC response associated with the incorporation of drug into the hair strand from a single dose.
Figure 3.
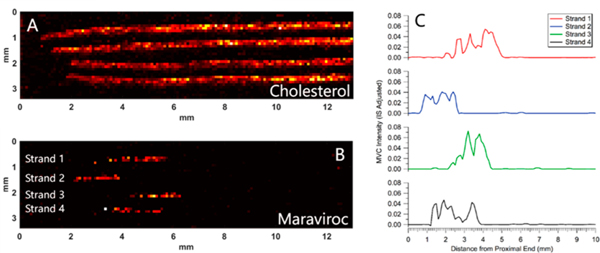
Ion images and profiles from one volunteer in the DOT study (V-6). Sample collected 28 days after a single dose of maraviroc. (A) Ion image corresponding to cholesterol. (B) Ion image from the same hair strands corresponding to maraviroc (corrected by IS). (C) Longitudinal profiles showing the intensity of maraviroc along the length of the hair strands in panel B. Each of the profiles were smoothed by moving average (n = 3). The top profile corresponds to the top strand in the image.
Mass spectra showing the detection of MVC on the top hair strand in Figure 3 and a negative response on another location of the hair strand are shown in Figure S24C and S24D. The insets in Figure S24C show subsets of an average mass spectrum from a region on the hair strand where MVC was detected, with cholesterol at m/z 369.3516 and detection of MVC at m/z 514.3352. The insets in Figure S24D show subsets of an average mass spectrum from a region without MVC. Cholesterol (m/z 369.3516) was detected, indicating the presence of a hair strand, but the peak corresponding to MVC at m/z 514.3352 does not appear in this spectrum. Combined with the high resolving power and mass accuracy of our instrument as well as the spatial distribution observed, this confirms the peak at m/z 514.3352 corresponds to MVC.
The ion abundance and location of features associated with single doses of MVC in the profiles in Figure 3C provide important information for interpretation of long-term profiles. First, the peak in the profile for each strand occurs at a slightly different location along the length of the strand. Second, each of these peaks is within 5 mm of the proximal end of the hair strand (closest to the scalp). The hair samples were collected 28 days after the initial dose, so, assuming a hair growth rate of ~11 mm/month,26 these peaks are much closer to the proximal end than expected. We suspect the variability in the location of the MVC band between hair strands and the proximity of the profile to the scalp is due to our sample collection method. Hair strands were cut close to scalp with scissors, such that a portion of the proximal end of hair will be left behind, which may vary strand-to-strand depending on the angle at which hair is cut. This relatively imprecise method of hair cutting may also account for the differences in the location of the profile. In addition, approximately 3–5 mm of hair remains under the scalp, which would account for a large portion of the difference in the actual and expected position of the single dose profile. Finally, the width of single dose-profiles in Figure 3C is 2–3 mm. For a growth rate of 11 mm/month, assuming a 30 day month, the width of a single dose on a single day would be predicted to be about 0.4 mm. Previous work has suggested that drug may be incorporated into the hair both beneath the scalp through the bloodstream and at the surface of the scalp through sweat and sebum.33,41 These studies indicate that drug may be incorporated into hair via blood over approximately 1.2 to 1.5 mm and via sebum over the ~3 mm of hair beneath the surface of the scalp.41 These two methods of drug incorporation may explain the width of the profiles observed.
Detection of Daily Doses.
After analyzing single dose samples from phase 1, we investigated daily dosing profiles from volunteer hair strands. Samples were collected 28 days after end of daily dosing or 56 days from the first day of daily dosing. Four hair strands from each volunteer were analyzed by IR-MALDESI. MS images from four hair strands from the same volunteer shown in Figure 3 (V-6) are shown in Figure 4. Figure 4A and B show heatmaps corresponding to cholesterol and MVC, respectively. Cholesterol was used to identify the location of the hair strands. A band of MVC response is visible in each hair strand in Figure 4B. The bands of MVC can be seen even more clearly in the longitudinal profiles (smoothed with moving average, n = 3) shown in Figure 4C.
Figure 4.
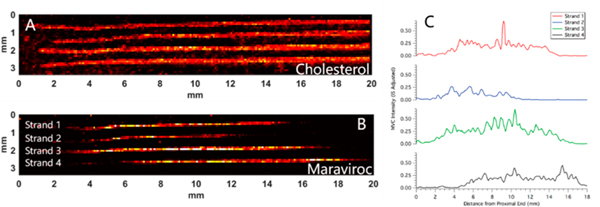
Ion images and profiles from the same volunteer in the DOT study as shown in Figure 3 (V-6). Sample collected 28 days after 28 days of daily dosing with maraviroc. (A) Ion image corresponding to cholesterol. (B) Ion image from the same hair strands corresponding to maraviroc (corrected by IS). (C) Longitudinal profiles showing the intensity of maraviroc along the length of the hair strands in panel B. Each of the profiles were smoothed by moving average (n = 3). The top profile corresponds to the top strand in the image.
The average width of MVC profiles corresponding to 28 days of daily dosing was 10.6 ± 2.8 mm, which is in good agreement with the expected value of ∼11 mm/month of hair growth.26 As with the single dose profiles, there is some variability in the location of the MVC ion abundance along the length of the hair strands, likely resulting from angle of cutting during collection. The peak in the profile of the top strand resulted from one voxel with low ion abundance of the IS. When correcting for the IS, this resulted in a “hot spot” in the image. Deposition was uniform for the rest of the image, and we did not observe this peak in any other strands; so, this was likely a single, isolated event. The top three strands in Figure 4 show a decrease in MVC ion abundance approaching the proximal end around 3.5 mm from the proximal end, while the fourth strand decreases closer to 4.5 mm. Additionally, the profile in the second strand from the top is narrower in width than the other three. This may be due to lower levels of MVC incorporated into this particular strand of hair. Little is currently known about the variability of MVC incorporation into individual strands of hair, given that most ARV analysis in hair is done by LC/MS, where multiple strands of hair are needed.22,24
Average Profiles of Single and Daily Doses for All Volunteers.
We developed a metric using area under the curve (AUC) ratios to determine when the response from a given strand would be considered positive, discussed in the Supporting Information. Using the AUC metric as a guide, individual strands with positive response were aligned and averaged for each volunteer for both single and daily doses to characterize the variability in drug profiles among volunteers. The profiles from individual strands were aligned using MATLAB’s alignsignals function and averaged. Average single doses for each volunteer are shown in red in Figure 5. Because the strand profiles were shifted in the x-direction when aligned, the resulting x-axis of the average profile reflects relative distance rather than an absolute distance from the proximal end of the hair strand. Four strands from each volunteer were averaged unless otherwise indicated (in red) in the figure, and the shaded regions indicate 95% confidence intervals. Profiles varied in intensity over roughly an order of magnitude. For the 8 volunteers with at least one positive response (all but V-4, V-7, V-8, and V-11), the median width at half-maximum was 1.7 mm, with a range of 1.1 to 2.5 mm.
Figure 5.
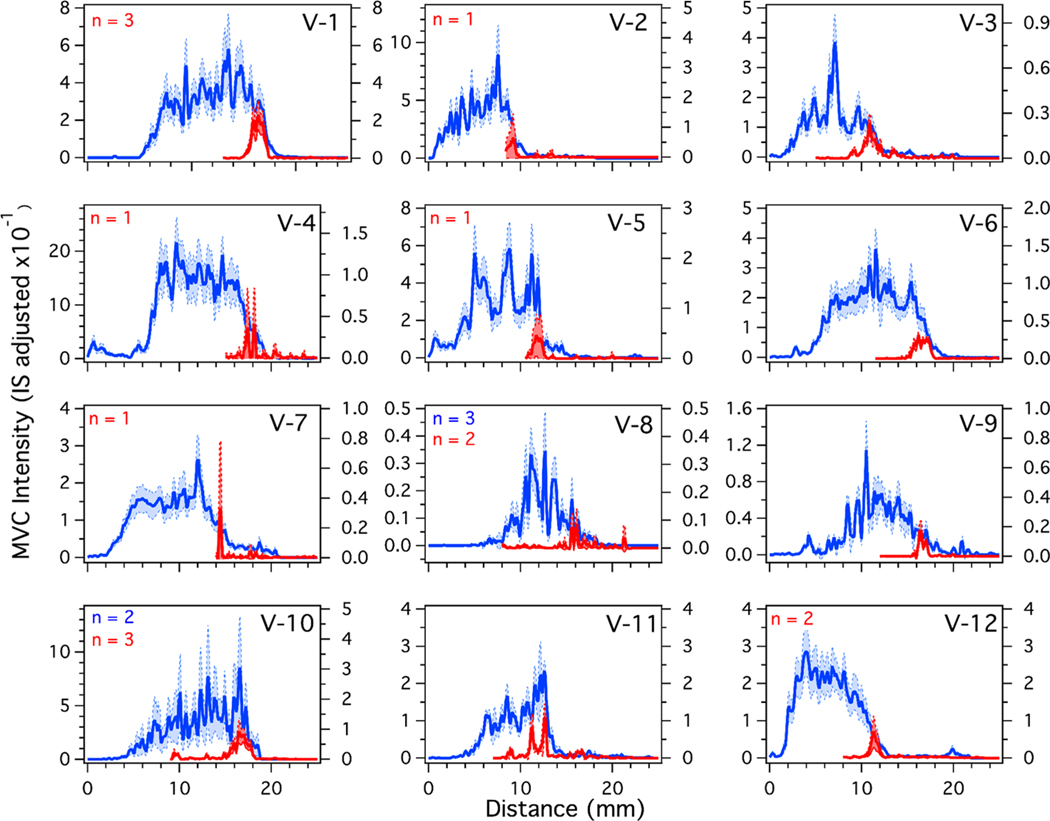
Average longitudinal profiles for single doses (red) and daily doses (blue) of MVC given to all 12 volunteers. The traces were generated, aligned, and averaged using MATLAB. After averaging, the profiles were smoothed by moving average (n = 3). The shaded areas indicate the 95% confidence interval. The traces are an average of 4 strands for both daily and single doses unless indicated in the figure.
Average daily doses were calculated using the same method and are shown for each volunteer in blue in Figure 5. As with the single dose strands, four strands from each volunteer were averaged unless indicated in the figure. For these samples, MVC was detected in all 12 volunteers. The intensities ranged over roughly 2 orders of magnitude for daily doses (minimum = V-8, maximum = V-4). The maximum adjusted intensity from the single dose samples did not necessarily correlate with the maximum adjusted intensity in the daily dosing samples. For example, hair from V-1 contained the most intense single dose response, but hair from V-4 had a high response for the daily dose samples. On average, the response from daily dose samples was approximately 12 times that of the single dose samples. Previous work showed the concentration of MVC in blood plasma and rectal tissue to be 2.23 and 3 times higher for daily dosing than a single dose, indicating that MVC accumulates in hair differently than other biological matrices.42 The median width at half-maximum for 28 days of daily dosing was 10.5 mm with a range of 7.0 to 13.0 mm. Relative to the median width of single dose response, the width of daily dosing response with MVC is likely to reflect a superposition of multiple single doses, rather than discrete peaks corresponding to each single dose. On the basis of this observation, we investigated whether a daily dosing profile could be predicted from average single dose response.
Prediction of Daily Dosing Profile with Single Dose Profile.
A direct comparison of the average longitudinal profiles between single doses and daily doses from volunteer V-6 is shown in Figure 6. The single dose trace (red) is the average trace for V-6 shown in red in Figure 5, and the daily dose trace (blue) is the average trace for V-6 shown in blue Figure 5. The distance from the end is not relevant for comparison here because these are different time points, but the intensity and width each average profile are of interest. For this volunteer, the daily dosing signal is approximately 5 times more intense than that from the single dose. Our end goal is to detect missed doses using this technique, so a large difference in signal intensity between daily doses (i.e., an adherent patient) and a single dose should enable detection of missed doses. The ability to detect missed doses will be further evaluated after examining the samples collected as a part of a later phase of the study.
Figure 6.
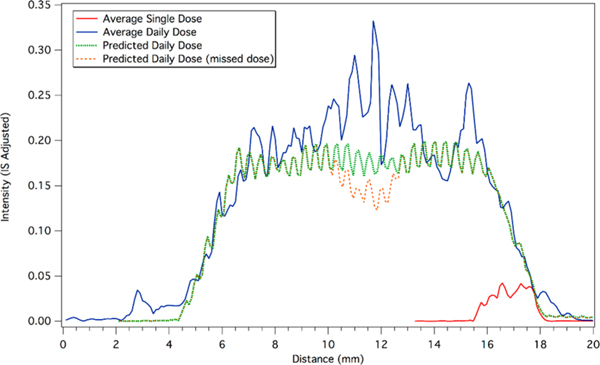
Average longitudinal profiles for single doses and a daily doses of maraviroc. The lowest intensity signal (red) corresponds to an average single dose from the 4 profiles in Figure 3. The average single dose has been offset on the x-axis to coincide with the start of the predicted profile. The highest intensity signal (blue) corresponds to the average of the 4 profiles from Figure 4. The dashed trace (green) is the predicted profile for 28 days of daily dosing based on a linear superposition of multiple average single doses. The second dashed trace (orange) corresponds to the predicted profile for 28 days of daily dosing, with a hypothetical missed dose on day 14.
A simple linear superposition of 28 of the average single doses is shown by the green dashed line in Figure 6. The first single dose trace was manually aligned to coincide with start of the daily dosing profile. Doses were separated by roughly 24 h, so the spacing of each dose was set at 0.41 mm, which is the approximate length corresponding to an average day’s hair growth. The overlapping intensities of each offset single dose were added to produce the predicted daily dose profile. The steady state intensity predicted by the superposition is slightly lower than the observed intensity in the daily doses, but the superposition captures the slope of the accumulation to steady state and the washout after the end of dosing. According to this prediction, steady-state is achieved after 4 doses, with the washout period corresponding to the same duration. In addition, there two narrow features on the washout (left side) around 5.3 and 5.8 mm that the superposition calculation predicts.
On the basis of this predictive model, we also considered the hypothetical scenario in which one dose is missed. The orange dashed line in Figure 6 shows the predicted profile using the same parameters as the green dashed line, but with a missed dose on day 14 of the 28 day regimen. Although the profile of a single dose spans multiple days of hair growth, a decline in intensity of approximately 20% in the daily dose profile is predicted when one dose is missed. Since a gap in adherence may not result in a return of the profile to the baseline, the superposition of the intensity from each day of dosing may be used to predict a missed dose or patterns of nonadherence. This approach was useful in a controlled research setting, but single dose profiles for patients would not be available in a clinic. Future work will investigate longitudinal profiles in hair from clinical patients to assess gaps in adherence.
CONCLUSIONS
IR-MALDESI MSI was used to detect MVC in hair strands from healthy volunteers as a part of a DOT study. A custom MATLAB program and algorithm was developed to generate longitudinal profiles of drugs along the length of the hair strands. Using normalized AUC as a metric, single doses of MVC were detected in hair strands from 8 of 12 volunteers, and potentially detected in all 12. With the same metric, MVC response from daily dosing was detected in all 12 of the volunteers. Superposition of multiple single dose profiles was a good predictor of the daily dosing profile, which may be used to predict the longitudinal profile of missed doses. These experiments represent a significant step toward using IR-MALDESI MSI analysis of hair as a clinical tool for the long-term, objective assessment of patient adherence to ARV regimens.
Supplementary Material
ACKNOWLEDGMENTS
The authors would like to thank Dr. Monica Gandhi for supplying the hair sample from the HIV+ patient. We would also like to thank Dr. David Muddiman for the development of and assistance with IR-MALDESI MSI. We gratefully acknowledge the National Institutes of Health (grants P30 AI50410, R01 AI122319) for financially supporting this work.
Footnotes
ASSOCIATED CONTENT
Supporting Information
The Supporting Information is available free of charge on the ACS Publications website at DOI: 10.1021/acs.analchem.9b02464.
Description of AUC ratio metric and ion images and profiles from each volunteer on the MVC-DOT study (PDF)
The authors declare no competing financial interest.
The Matlab GUI used to generate longitudinal profiles is available at https://github.com/macgilliland/MOHAWQ.
REFERENCES
- (1).Guidelines for the Use of Antiretroviral Agents in Adults and Adolescents with HIV. http://aidsinfo.nih.gov/contentfiles/lvguidelines/AdultandAdolescentGL.pdf (accessed May 3, 2019).
- (2).Saag MS; Benson CA; Gandhi RT; Hoy JF; Landovitz RJ; Mugavero MJ; Sax PE; Smith DM; Thompson MA; Buchbinder SP; del Rio C; Eron JJ; Fätkenheuer G; Günthard HF; Molina J-M; Jacobsen DM; Volberding PA JAMA 2018, 320 (4), 379. [DOI] [PMC free article] [PubMed] [Google Scholar]
- (3).Baeten JM; et al. N. Engl. J. Med 2012, 367 (5), 399–410. [DOI] [PMC free article] [PubMed] [Google Scholar]
- (4).Grant RM; et al. N. Engl. J. Med 2010, 363 (27), 2587–2599. [DOI] [PMC free article] [PubMed] [Google Scholar]
- (5).Eshleman SH; et al. JAIDS, J. Acquired Immune Defic. Syndr 2017, 74 (1), 112–116. [DOI] [PMC free article] [PubMed] [Google Scholar]
- (6).Molina J-M; et al. N. Engl. J. Med 2015, 373 (23), 2237–2246. [DOI] [PubMed] [Google Scholar]
- (7).Parienti J-J; Das-Douglas M; Massari V; Guzman D; Deeks SG; Verdon R; Bangsberg DR PLoS One 2008, 3 (7), No. e2783. [DOI] [PMC free article] [PubMed] [Google Scholar]
- (8).Gross R; Yip B; Re VL III; Wood E; Alexander CS; Harrigan PR; Bangsberg DR; Montaner JSG; Hogg RS J. Infect. Dis 2006, 194 (8), 1108–1114. [DOI] [PubMed] [Google Scholar]
- (9).Alcaide ML; Ramlagan S; Rodriguez VJ; Cook R; Peltzer K; Weiss SM; SifUnda S; Jones DL AIDS Behav. 2017, 21 (7), 2135–2140. [DOI] [PMC free article] [PubMed] [Google Scholar]
- (10).Agot K; Taylor D; Corneli AL; Wang M; Ambia J; Kashuba ADM; Parker C; Lemons A; Malahleha M; Lombaard J; Van Damme L. AIDS Behav. 2015, 19 (5), 743–751. [DOI] [PMC free article] [PubMed] [Google Scholar]
- (11).McMahon JH; Jordan MR; Kelley K; Bertagnolio S; Hong SY; Wanke CA; Lewin SR; Elliott JH Clin. Infect. Dis 2011, 52 (4), 493–506. [DOI] [PMC free article] [PubMed] [Google Scholar]
- (12).Mekuria LA; Prins JM; Yalew AW; Sprangers MAG; Nieuwkerk PT Trop. Med. Int. Health 2016, 21 (7), 856–869. [DOI] [PubMed] [Google Scholar]
- (13).El Alili M; Vrijens B; Demonceau J; Evers SM; Hiligsmann M. Br. J. Clin. Pharmacol 2016, 82 (1), 268–279. [DOI] [PMC free article] [PubMed] [Google Scholar]
- (14).Baxi SM; Liu A; Bacchetti P; Mutua G; Sanders EJ; Kibengo FM; Haberer JE; Rooney J; Hendrix CW; Anderson PL; Huang Y; Priddy F; Gandhi M. JAIDS, J. Acquired Immune Defic. Syndr 2015, 68, 13–20. [DOI] [PMC free article] [PubMed] [Google Scholar]
- (15).Louissaint NA; Cao Y-J; Skipper PL; Liberman RG; Tannenbaum SR; Nimmagadda S; Anderson JR; Everts S; Bakshi R; Fuchs EJ; Hendrix CW AIDS Res. Hum. Retroviruses 2013, 29 (11), 1443–1450. [DOI] [PMC free article] [PubMed] [Google Scholar]
- (16).Wertheimer B; Freedberg K; Walensky R; Yazdan Y; Losina E. HIV Clin. Trials 2006, 7 (2), 59–69. [DOI] [PubMed] [Google Scholar]
- (17).Anderson PL; Glidden DV; Liu A; Buchbinder S; Lama JR; Guanira JV; McMahan V; Bushman LR; Casapia M; Montoya-Herrera O; Veloso VG; Mayer KH; Chariyalertsak S; Schechter M; Bekker LG; Kallas EG; Grant RM Sci. Transl. Med 2012, 4 (151), 151ra125. [DOI] [PMC free article] [PubMed] [Google Scholar]
- (18).Baxi SM; Vittinghoff E; Bacchetti P; Huang Y; Chillag K; Wiegand R; Anderson PL; Grant R; Greenblatt RM; Buchbinder S; Gandhi M; Liu AY PLoS One 2018, 13 (1), No. e0190118. [DOI] [PMC free article] [PubMed] [Google Scholar]
- (19).Gandhi M; Murnane PM; Bacchetti P; Elion R; Kolber MA; Cohen SE; Horng H; Louie A; Kuncze K; Koss CA; Anderson PL; Buchbinder S; Liu A. AIDS 2017, 31 (16), 2245–2251. [DOI] [PMC free article] [PubMed] [Google Scholar]
- (20).Koss CA; et al. AIDS Res. Hum. Retroviruses 2017, 33 (8), 778–783. [DOI] [PMC free article] [PubMed] [Google Scholar]
- (21).Koss CA; Hosek SG; Bacchetti P; Anderson PL; Liu AY; Horng H; Benet LZ; Kuncze K; Louie A; Saberi P; Wilson CM; Gandhi M. Clin. Infect. Dis 2018, 66 (2), 213–219. [DOI] [PMC free article] [PubMed] [Google Scholar]
- (22).Seifert SM; Castillo-Mancilla JR; Erlandson K; Morrow M; Gandhi M; Kuncze K; Horng H; Zheng J-H; Bushman LR; Kiser JJ; MaWhinney S; Anderson PL JAIDS, J. Acquired Immune Defic. Syndr 2018, 77 (3), 295–298. [DOI] [PMC free article] [PubMed] [Google Scholar]
- (23).Sykes C; Blake K; White N; Schauer AP; Guzman BB; Cottrell ML; Tamraz B; Kashuba AD M. Anal. Bioanal. Chem 2018, 410 (29), 7773–7781. [DOI] [PMC free article] [PubMed] [Google Scholar]
- (24).Phung N; Kuncze K; Okochi H; Louie A; Benet LZ; Ofokotun I; Haas DW; Currier JS; Chawana TD; Sheth AN; Bacchetti P; Gandhi M; Horng H. Rapid Commun. Mass Spectrom 2018, 32 (5), 431–441. [DOI] [PMC free article] [PubMed] [Google Scholar]
- (25).Gandhi M; Bacchetti P; Ofokotun I; Jin C; Ribaudo HJ; Haas DW; Sheth AN; Horng H; Phung N; Kuncze K; Okochi H; Landovitz RJ; Lennox J; Currier JS Clin. Infect. Dis 2019, 68, 1044. [DOI] [PMC free article] [PubMed] [Google Scholar]
- (26).Pragst F; Rothe M; Spiegel K; Sporkert F. Forensic Sci. Rev 1998, 10 (2), 81–111. [PubMed] [Google Scholar]
- (27).Kuwayama K; Nariai M; Miyaguchi H; Iwata YT; Kanamori T; Tsujikawa K; Yamamuro T; Segawa H; Abe H; Iwase H; Inoue H. Forensic Sci. Int 2018, 288, 23–28. [DOI] [PubMed] [Google Scholar]
- (28).Kuwayama K; Miyaguchi H; Iwata YT; Kanamori T; Tsujikawa K; Yamamuro T; Segawa H; Inoue H. Anal. Chim. Acta 2016, 948, 40–47. [DOI] [PubMed] [Google Scholar]
- (29).Genberg BL; Wilson IB; Bangsberg DR; Arnsten J; Goggin K; Remien RH; Simoni J; Gross R; Reynolds N; Rosen M; Liu H. AIDS 2012, 26 (11), 1415–1423. [DOI] [PMC free article] [PubMed] [Google Scholar]
- (30).Haberer JE; Musinguzi N; Boum Y; Siedner MJ; Mocello AR; Hunt PW; Martin JN; Bangsberg DR JAIDS, J. Acquired Immune Defic. Syndr 2015, 70 (4), 386–392. [DOI] [PMC free article] [PubMed] [Google Scholar]
- (31).Flinders B; Cuypers E; Zeijlemaker H; Tytgat J; Heeren RMA Drug Test. Anal 2015, 7 (10), 859–865. [DOI] [PubMed] [Google Scholar]
- (32).Flinders B; Cuypers E; Porta T; Varesio E; Hopfgartner G; Heeren RMA Mass Spectrometry Imaging of Drugs of Abuse in Hair; Humana Press: New York, NY, 2017; pp 137–147. DOI: 10.1007/978-1-4939-7051-3_12. [DOI] [PubMed] [Google Scholar]
- (33).Kamata T; Shima N; Sasaki K; Matsuta S; Takei S; Katagi M; Miki A; Zaitsu K; Nakanishi T; Sato T; Suzuki K; Tsuchihashi H. Anal. Chem 2015, 87 (11), 5476–5481. [DOI] [PubMed] [Google Scholar]
- (34).Rosen EP; Thompson CG; Bokhart MT; Prince HMA; Sykes C; Muddiman DC; Kashuba AD M. Anal. Chem 2016, 88 (2), 1336–1344. [DOI] [PMC free article] [PubMed] [Google Scholar]
- (35).Robichaud G; Barry JA; Garrard KP; Muddiman DC J. Am. Soc. Mass Spectrom 2013, 24 (1), 92–100. [DOI] [PMC free article] [PubMed] [Google Scholar]
- (36).Gulick RM; et al. J. Infect. Dis 2016, 215 (2), jiw525. [Google Scholar]
- (37).Robichaud G; Barry JA; Muddiman DC J. Am. Soc. Mass Spectrom 2014, 25 (3), 319–328. [DOI] [PMC free article] [PubMed] [Google Scholar]
- (38).Thompson CG; Bokhart MT; Sykes C; Adamson L; Fedoriw Y; Luciw PA; Muddiman DC; Kashuba ADM; Rosen EP Antimicrob. Agents Chemother 2015, 59 (5), 2944–2948. [DOI] [PMC free article] [PubMed] [Google Scholar]
- (39).Robichaud G; Garrard KP; Barry JA; Muddiman DC J. Am. Soc. Mass Spectrom 2013, 24 (5), 718–721. [DOI] [PMC free article] [PubMed] [Google Scholar]
- (40).Bokhart MT; Nazari M; Garrard KP; Muddiman DC J. Am. Soc. Mass Spectrom 2018, 29 (1), 8–16. [DOI] [PMC free article] [PubMed] [Google Scholar]
- (41).Pragst F; Balikova MA Clin. Chim. Acta 2006, 370 (1–2), 17–49. [DOI] [PubMed] [Google Scholar]
- (42).Brown KC; Patterson KB; Malone SA; Shaheen NJ; Asher Prince HM; Dumond JB; Spacek MB; Heidt PE; Cohen MS; Kashuba AD. M. J. Infect. Dis 2011, 203 (10), 1484–1490. [DOI] [PMC free article] [PubMed] [Google Scholar]
Associated Data
This section collects any data citations, data availability statements, or supplementary materials included in this article.


