

Abstract

Microgel particles have emerged in the past few years as a favorite model system for fundamental science and for innovative applications ranging from the industrial to biomedical fields. Despite their potentialities, no works so far have focused on the application of microgels for cultural heritage preservation. Here we show their first use for this purpose, focusing on wet paper cleaning. Exploiting their retentive properties, microgels are able to clean paper, ensuring more controlled water release from the gel matrix, in analogy to their macroscopic counterpart, i.e., hydrogels. However, differently from these, the reduced size of microgels makes them suitable to efficiently penetrate in the porous structure of the paper and to easily adapt to the irregular surfaces of the artifacts. To test their cleaning abilities, we prepare microgels made of Gellan gum, a natural and widespread material already used as a hydrogel for paper cleaning, and apply them to modern and ancient paper samples. Combining several diagnostic methods, we show that microgels performances in the removal of cellulose degradation byproducts for ancient samples are superior to commonly employed hydrogels and water bath treatments. This is due to the composition and morphology of ancient paper, which facilitates microgels penetration. For modern paper cleaning, performances are at least comparable to the other methods. In all cases, the application of microgels takes place on a time scale of a few minutes, opening the way for widespread use as a rapid and efficient cleaning protocol.
Keywords: microgels, paper cleaning, Gellan gum, hydrogels, art preservation
1. Introduction
Microgels are colloidal-scale particles made of cross-linked polymer networks, usually suspended in water.1,2 Thanks to their intrinsic softness, microgels are able to adapt their size to the environmental conditions. In particular, upon changing the constituent polymers, they can be made responsive to external variables, such as temperature or pH, which makes them increasingly employed as building blocks of smart and functional materials.3−5 Thanks to their ability to deform microgels can pack well beyond the overlap concentration,6 giving rise to amorphous states with tunable rheological properties.7,8 These states are arrested on the macroscopic scale but not completely on the molecular one.9,10 Hence, the individual particles may still retain some degree of motion and be useful for purposes where solid-like and liquid-like properties are simultaneously needed. For the above reasons, microgels have become a favorite model system for fundamental physics, replacing hard spheres as the new paradigm of soft repulsive particles.11−13
The great versatility of microgels have so far been exploited for a large variety of applications,14,15 ranging from industrial to biomedical ones.2 However, to our knowledge, they have not yet been employed for cultural heritage conservation purposes. On the other hand, hydrogels (i.e., macroscopic gels, not organized into microparticles) have a long tradition for the cleaning of several kinds of artworks,16 including paper cleaning. Indeed, thanks to their retentive properties, they offer substantial advantages with respect to the traditional wet cleaning method, which involves contact with free water.17−19
Paper is a complex multicomponent material, mainly formed by a network of randomly interwoven cellulose fibers, whose composition depends on the production period and on the employed technology.20 In particular, ancient rags paper were made of cotton, linen, or hemp cellulose (>90% in weight) with the addition of animal glue or starch as a sizing compound. On the other hand, modern paper is usually made of soft or hardwood cellulose fibers that may also include lignin, depending on the production process, while in mechanical wood pulp lignin content is about 30% in weight, in chemical pulp it is very low, i.e., nondetectable by infrared spectroscopy technique. Modern paper composition also includes additives such as alum, resin, synthetic polymers, or chalk.
Paper contains in its structure a system of pores and voids, nonuniform in sizes and shapes. Their sizes span from nanometers when they are fully confined in the amorphous regions of cellulose elemental fibrils21 up to tens of microns within the cellulose fibers network.22 Pores and voids strongly influence chemical reactivity of paper due to water and external agents accessibility. In all cases, paper deteriorates over time because environmental factors like humidity, temperature, pollution, and radiation all contribute to speeding up chemical reactions,23,24 consisting principally in hydrolysis and oxidation processes of cellulose.25,26 During hydrolysis, acidic groups break the glycosidic bonds between the glucose units in the cellulose chains, cutting them into shorter chains and forming, at the same time, aldehydic groups susceptible of further oxidation into carboxyl acids. Oxidation can also lead to the formation of various carbonyl groups, as ketones and conjugated diketones, that are able to absorb the visible light (chromophores), thus becoming responsible for the yellowing of paper.27 As a result, several degradation byproducts, including acidic ones, are formed, which may potentially trigger further cellulose degradation reactions.
Wet cleaning, one of the most important steps during paper artworks restoration, allows for the removal of pollution materials, degradation byproducts, and chromophores, so as to obtain an improvement of their optical properties and a slowing down of paper aging.28,29 However, wet cleaning is also a very delicate step: if performed in the wrong way, it may lead to irreversible damages, such as alteration of colorants, pigments and inks, stain formation, modification of paper dimensions and of cellulose crystallinity. To this aim, the use of gelled systems has emerged as a valid cleaning protocol, since they are able to confine the solvent in the gel matrix,30 thereby ensuring a more controlled solvent release than simple washing by liquid solvents. The gel cleaning system is based on the osmosis mechanism, that exploits Fick’s first law, according to which water is released in the presence of a concentration gradient between gel and paper, while the degradation products perform the reverse path migrating from the paper to the gel.31 This process does not significantly alter the original morphology of paper and avoids spreading of colorants, pigments, and inks. In addition, with this method, even toxic solvents can be safely handled by conservators.
To clean ancient paper, an established practice is to use homogeneous and transparent Gellan gum based hydrogels,17 whose rheological properties can be tuned by changing the salt content.32,33 Gellan gum is a high molecular weight linear polysaccharide obtained from Pseudomonas elodea. It is formed by the repetition unit of (1,3)-β-d-glucose, (1,4)β-d-glucuronic acid, (1,4)β-d-glucose, and (1,4)α-l-rhamnose.17 Interestingly, it was recently shown34 that a shear stress applied during gelation in the presence of sodium chloride is able to rearrange the Gellan gum network into stable microgel particles, whose elasticity depends on Gellan and salt concentrations. With respect to paper cleaning, microgels could offer several advantages when compared to hydrogels: first, their reduced size may be suitable to achieve a better penetration in the porous structure of paper, where they could adsorb pollution materials and degradation byproducts in a shorter amount of time; second, the softness of the microgel suspensions could be tuned to make them easily adapt to the irregular surfaces of artifacts without inducing alteration of the latter. This would possibly extend their use also for materials with very delicate surfaces. Such ideas are illustrated in Figure 1.
Figure 1.

Illustration of microgel advantages for paper cleaning. (Top) As compared to hydrogels, the reduced sizes of microparticles are suitable to easily adapt to the irregular surfaces of the artifacts and to better penetrate in the porous structure of paper allowing a deeper cleaning in a shorter time. (Bottom) Illustration of the osmosis cleaning mechanism performed by microgels.
In this work we exploit these properties and propose to use Gellan gum-based microgel particles as a more efficient cleaning procedure. To this aim, we prepare the microgels following the protocol developed by Caggioni et al.34 and apply them to both modern and ancient paper samples. We then perform an extensive study to assess the validity of the cleaning process as well the overall effect of the treatment on the chemical and physical structure of paper samples. To gain this knowledge a variety of experimental techniques are employed including dynamical light scattering (DLS), rheology, fluorescence optical microscopy, scanning electron microscopy (SEM), tensile tests, electrical conductivity measurements, high-performance liquid chromatography (HPLC), Fourier transform infrared (FTIR), and optical reflectance spectroscopy (see the Experimental Methods for more details). In order to compare the cleaning effectiveness of microgels with respect to previously established protocols, the same diagnostic measurements are performed on modern and ancient samples subjected to a Gellan gum hydrogel treatment and water bath.17,18
2. Experimental Methods
2.1. Materials
Gellan gum powder Kelcogel, is from CP Kelco, San Diego, CA. NaCl, fluorescein isothiocyanate (FITC), methylene blue, methanol, Whatman no. 1 paper samples, phosphate buffer, and microscope glass slides are from Merck (Merck KGaA, Darmstadt, Germany). Reagents used in this research were of analytical grade and used without further purification unless specified elsewhere. In all cases, for the solutions preparation, bidistilled water (Millipore, Billerica, MA) was used. Purification of Gellan gum has been obtained by dialysis process using a 12000–14000 Da cut off dialysis tubing (Olinto Martelli srl, Florence Italy) until the conductibility of the external solution is about 1 μS.
2.2. Sample Preparation
Microgel samples were prepared by dispersing Kelcogel Gellan gum powder in ultrapure water (resistivity 18.2 MΩ cm at T = 25 °C) at room temperature, and the dispersion was heated up to 80 °C under stirring and kept for 10 min at these conditions. In order to obtain a sample with the desired final salt concentration, a proper quantity of a NaCl stock solution (1 M) was added to the dispersion. Following ref (34), the sample was then cooled at a fixed cooling rate of 0.5 K/min from 80° to 25 °C under the application of a shear with constant shear rate of 100 s–1. To produce stable microgels,34 we worked with two different samples: (i) the 0.10% sample with Gellan gum weight concentration Cw = 0.10% and NaCl weight concentration Cs = 100 mM; (ii) the 0.75% sample with Gellan gum weight concentration Cw = 0.75% and NaCl weight concentration Cs = 10 mM. Gellan hydrogel preparation has been performed following the protocol reported elsewhere.17,18
2.3. Paper Samples and Cleaning Process
Microgels have been applied on two different paper samples: ancient paper from “Breviarium Romanum ad usum fratrum” (1738) and modern paper (office paper from 1965). Both samples are from private collections. The cleaning procedures with Gellan hydrogel and water bath are reported elsewhere.17 During cleaning, microgels have been applied on paper samples and removed after 2 to 3 min with a humid soft brush.
2.4. Rheological Measurements
Rheological measurements have been performed with a Rheometer MCR102, Anton Paar with a cone–plate geometry (diameter = 49.97 mm, cone angle = 2.006°, truncation = 212 μm). The storage modulus G′(γ) and loss modulus G″(γ) have been measured as a function of shear strain γ at fixed oscillation frequency of 1 Hz and at T = 25 °C (strain sweep test) for the two different microgels 0.10% and 0.75% as in ref (34).
2.5. Dynamic Light Scattering (DLS) Measurements
DLS measurements have been performed using an optical setup based on a monochromatic and polarized beam emitted from a solid state laser (100 mW at λ = 642 nm) at a scattering angle θ = 90° that, according to the relation Q = (4πn/λ) sin(θ/2), corresponds to a scattering vector Q = 0.018 nm–1. The autocorrelation function of scattered intensity is fitted through the Kohlrausch–William–Watts (KWW) expression, g2(Q, t) = 1 + b[e–(t/τ)β]2, where τ is the relaxation time, β the stretching exponent, and b is the coherence factor. From the relaxation time, an average size of the particles can be obtained through the Stokes–Einstein relation.35
2.6. Fluorescence Optical Microscope Experiments
Fluorescent Gellan polymers have been obtained by labeling the purified Gellan gel polymer with a FITC dye. The synthesis has been performed according to a slight modification of the procedure reported elsewhere.36 Purified polysaccharide were first immersed in bidistilled water at room temperature to reach their swollen state. The swollen microgels were labeled with FITC by coupling the dye to the hydroxyl groups of microgels. Fluorescent dye was added in the dispersion. The unbound dye and the excess solvent were removed by dialysis.
Successively, 0.10% microgel was obtained as reported in the Sample Preparation section. Immediately before the fluorescence observation, a few drops of the microgel sample were cast on a glass microscope slide, rinsed with water, and covered with a glass. Images were obtained using an Axio scope A1 optical fluorescent microscope. (Carl Zeiss Microscopy, LLC, NY) equipped with a HB50 fluorescent lamp. A filter set consistent with the spectral bandpass of the “blue” excitation filter set and a 100× magnification lens were used.
2.7. SEM Analysis
Scanning electron microscopy was performed using a field emission-scanning electron microscope (FE-SEM), (SUPRA 35, Carl Zeiss SMT, Oberkochen, Germany). Punched samples were previously metalized to allow electronic conduction on the sample surface in order to have high-quality images without deteriorating the samples or creating any kind of artifacts. The metallization, 1 min at 25 mA, was performed using a sputter coater (EMITECH K550X, Quorum Technologies Ltd., West Sussex, United Kingdom) with a gold target. The detector used was the second electron detector, as the interest was mainly focused on the morphology of the paper fibers and on the presence of residues from the cleaning agents; the main operating parameters of the instrument were 10 keV as the gun voltage and a working distance of about 8 mm.
2.8. High-Performance Liquid Chromatography
HPLC analyses were performed using a THERMOQUEST instrument (Shimadzu, Kyoto, Japan), equipped with two pumps, an UV–vis detector LCGA SPD-10A (Shimadzu, Kyoto, Japan), and a C18 reversed phase column (5 μm 250 mm × 4.6 mm PINNACLE II, Restek). The analysis was performed on extracts obtained by treating 1 cm2 of a paper sample with 1 mL of distilled water and stirring on the rotating wheel (Dynal AS, Sweden) overnight at room temperature. An anion exchange column (SPE) (STRATA-SAX Phenomenex, Torrance, CA) was used for separating, for concentrating, and for converting all salts present in the samples (as alkaline reserve or paper degradation) in the acid form. After the filtration of the eluate using a filter RephiQuik PTFE (0.45 μm, RephiLe Bioscience Ltd., Shanghai, China), the solution was analyzed by HPLC at isocratic conditions using 25 mM phosphate buffer plus 1% (v/v) methanol at pH = 2.4 (gradient of purity 99.9% with HPLC grade) as a mobile phase (flow rate, 1 mL/min; loop, 200 μL) with runtime of 60 min (n = 3 for each samples). The excitation wavelength is 230 nm, which is the characteristic carboxylic moiety absorption one.37 The chromatographic profiles are based on different retention times using a selected eluent (in terms of ionic strength and pH), column (C18), and wavelength (230 nm) of the carboxylic compounds, present in the sample, as well as their relative amount into the samples under analysis. All experiments were performed in triplicate.
2.9. FTIR and pH Experiments
Spectra of paper samples were acquired on a ThermoScientific (model Is50) instrument (Thermo Scientific Inc., Madison WI), equipped with attenuated total reflectance (ATR). A diamond cell was used for measurement in the 4000–525 cm–1 region, at a resolution of 4 cm–1. A total of 64 scans were collected for each sample. All experiments were performed in triplicate, yielding consistent and reproducible results. The absorbance of all the spectra was normalized between 0 (at the minimum of absorbance, near 1850 cm–1) and 1 (band at 1030 cm–1 due to the C–O stretching associated with primary alcohols in cellulose). This band, indeed, is one of the least changing ones upon treatments and degradation processes.38 Measurements of pH were carried out on the paper surface by using an Amel Instrument 334-B pH meter with a combined glass electrode Ag/AgCl and a porous PTFE diaphragm (Crison Instruments, Spain). For each sample, results are averaged over five different measurements.
2.10. UV–Visible-NIR Reflectance Spectroscopy
Diffuse reflectance (R) of the paper samples in the UV–vis-NIR was measured in a nondestructive way by a fiber optics spectroscopic setup with integrating sphere from Avantes BV (The Netherlands). It was composed by an AvaLight-DH-S-BAL balanced deuterium-halogen UV–vis-NIR radiation source connected by a 800-μm-diameter optical fiber to a 30 mm-diameter Spectralon coated integrating sphere (AvaSphere-30-REFL). This was used to illuminate the samples in a spot of about 5 mm in diameter (angle of incidence 8°) and collect radiation reflected from the paper surface over all angles. A 600-μm-diameter optical fiber collected the radiation from the integrating sphere and sent it to an AvaSpec-2048x14-USB2 spectrometer equipped with a 2048 × 14 CCD detector allowing measurements in the 250–1050 nm range with 2.4 nm spectral resolution. The absorption coefficient of cellulose fibers α was recovered by using equations recently elaborated on in order to extend the Yang and Miklavcic improvement of the Kubelka–Munk theory (see the Supporting Information for further details).39−42
3. Results and Discussion
3.1. Preparation of the Microgels: Size and Mechanical Properties
Samples were prepared, as described in the Experimental Methods, following ref (34). In order to control the cross-linking process of Gellan gum into microgel particles rather than into a macroscopic hydrogel, samples were cooled under a constant shear rate. We initially focus on the sample with low Gellan gum weight concentration, i.e., the 0.10% microgels.
The storage and loss moduli G′(γ) and G″(γ) were measured immediately after preparation as a function of shear strain γ at fixed frequency of 1 Hz and a temperature T = 25 °C, as reported in Figure 2A. The measurement was repeated after 25 h, and the corresponding moduli are reported in Figure 2B. The data confirm the previous results of Caggioni and co-workers:34 the sample forms an elastic solid, with G′ > G″. The low-value of the zero-shear moduli indicates that the system is very soft. We notice that a small bump in G′ is present at small strains (γ ≈ 0.05), very similar to what found in ref (34), which disappears over time. Indeed, after 25 h, the sample displays a constant behavior of G′ at small strains, up to γ ∼ 0.5. At this value, the loss modulus G″ shows a characteristic peak, that is a typical signature of a soft gel. Apart from this slight variation, the values of the moduli do not change much over time, indicating that aging has only small effects. Hence, over this time scale, we can assess an overall stability of the samples. In the following we always refer to experiments performed with samples aged 25 h after preparation.
Figure 2.
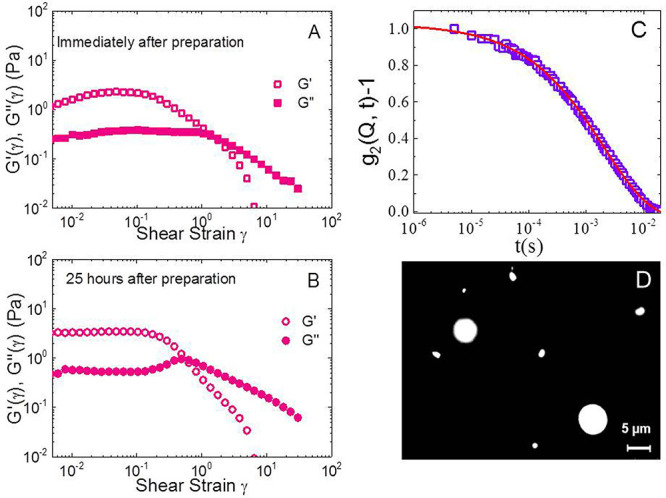
Characterization of the 0.10% microgel samples. (A,B) Storage modulus G′(γ) (open symbols) and loss modulus G″(γ) (closed symbols) as a function of shear strain γ at fixed frequency 1 Hz, at T = 25 °C for the 0.10% microgel sample, i.e., with Gellan gum weight concentration Cw = 0.10% and sodium chloride concentration Cs = 100 mM. Measurements performed immediately after preparation (A) and 25 h after preparation (B) are reported to exclude significant aging of the samples. (C) Normalized intensity autocorrelation function measured by DLS at a scattering angle θ = 90°. The line is a fit according to the KWW equation, yielding for this sample an average particle radius of 950 ± 250 nm. Measurements were performed 25 h after sample preparation. (D) Fluorescence microscopy image.
In order to confirm the formation of microgel particles, DLS measurements were performed and the resulting intensity autocorrelation function is shown, for a representative measurement, in Figure 2C. A fit through the Kohlrausch–Williams–Watts (KWW) expression (see Experimental Methods) is also reported, giving an estimate of the average particle radius. We find it to be of the order of a micron, in agreement with that obtained by the microrheology experiments of ref (34). Measurements were repeated for different samples yielding consistent and reproducible results. Also, indirect evidence of the formation of Gellan gum colloidal-scale particles was obtained by monitoring the emission intensity of a fluorescent probe, that is pyrene, during microgel preparation, as explained in detail in the Supporting Information (see Figure S1). Finally, the visualization of the particles was achieved thanks to the preparation of a batch of fluorescent microgels, where we used a fluorescein-labeled Gellan gum polymer (see the Experimental Methods for preparation details). This sample was then imaged with an optical microscope, yielding typical images like that reported in Figure 2D. While the size of the particles is in the micron range, we observe a rather large polydispersity, as also evidenced by the DLS results. This could actually be an advantage to the purpose of cleaning paper, because microgels could easily penetrate within the polydisperse pore size distribution of the cellulose network, without exceeding their average mesh size that extends up to tens of microns.22 In addition, the low value of their elastic moduli with respect to Gellan hydrogels should facilitate the cleaning process. We will test these hypotheses in the following.
3.2. Cleaning Efficacy of Gellan Gum Microgels
The cleaning efficacy of the microgels was tested on two paper samples that are different in age and composition: an ancient paper sample from a book edited in 1738 titled Breviarium Romanum ad usum fratum and office paper dated back to 1965. From now on, these samples are named Breviarium and Office, respectively. The compatibility and cleaning efficacy of the microgels were performed at first by preliminary tests to assess an eventual presence of microgel residues after the treatment and to address whether the proposed method would affect the characteristics of the paper fibers. After encouraging results from these tests, we applied a combination of diagnostic techniques, including pH measurements, HPLC, FTIR, and optical reflectance spectroscopy, to characterize the paper samples before and after the cleaning process by microgels. The same kind of Breviarium and Office samples have also been treated with Gellan gum hydrogel and a water bath, in order to compare our results with established protocols.
Qualitative analysis to determine paper sources and the pulping processes was performed following the color change on cellulose fibers obtained after staining them with Graff “C” stain test,43 as described in the Supporting Information (see Figure S2). These tests confirmed that paper sheets of Breviarium are composed of rags pulp, while Office fibers are obtained from bleached, chemically treated, lignin free wood pulp. After application of the microgel treatment on both samples, we performed a set of preliminary assessments to address whether the treatment may have affected the mechanical properties of the paper samples as well as to directly visualize the cleaning effects. To start with, we carried out tensile tests on 0.10% microgels cleaned samples (see Table S1 in the Supporting Information), which indicate that both stress and strain at break values are comparable with those of uncleaned samples, leaving unaltered the mechanical properties of the paper fibers. We then imaged the treated samples with SEM, as reported in Figure 3. SEM images indicate that cleaning with 0.10% microgels does not alter paper morphology and does not leave residues for both Breviarium and Office paper samples. In addition, they also provide evidence that no NaCl residues are present in the cleaned samples. Indeed, NaCl residues, if present, would form large crystals or filaments clearly detectable by SEM.44−46 Such aggregates are absent in the reported SEM micrographs. Thus, despite the relatively large amount of NaCl content in the 0.10% microgels, this is completely removed after treatment, as also confirmed by electrical conductivity measurements discussed in the Supporting Information. In addition, microscope images (see Figure S3) allow us to exclude that the cleaning process induces the spreading of inks and directly show that cleaning is effective in removing pollution materials and cellulose byproducts responsible of yellowing, as evident from the clearer aspect of microgel treated samples with respect to untreated ones.
Figure 3.

SEM images of (top row) Breviarium sample uncleaned (A) and cleaned (B) with 0.10% microgel and of (bottom row) Office sample uncleaned (C) and cleaned (D) with 0.10% microgel.
To be more quantitative, we then measured the pH of the samples before and after cleaning treatment. It is well-known that the optimal pH values of paper artworks are found in the range [6.5,8.5] and [6.0,7.0] for paper from rag pulp and wood pulp, respectively.47 Lower pH values indicate that paper has undergone degradation, due to the formation of acidic groups from cellulose degradation reactions. The pH values before and after cleaning with different methods are reported in Table 1. The table also includes results for 0.75% to be discussed in the following. It can be immediately noticed that the Office pH is lower than that of the Breviarium one because of the greater presence of alum (used in higher doses in modern paper production)48 and phenolic acids, due to the degradation of any lignin residue.49 Overall, pH values of both paper samples significantly increase after all cleaning processes under consideration, indicating that the treatments are all efficient in removing acidic degradation products from paper. However, we stress that while the application of the microgels took place for about 3 min, that of the hydrogel or water bath was carried out for 1 h, thus allowing the gain of a comparable result with a 20× speed-up.
Table 1. pH Values and Percentage of Chromophore Reduction, CR(%), before and after the Cleaning Processes.
| Breviarium |
Office |
|||
|---|---|---|---|---|
| pH | CR (%) | pH | CR (%) | |
| before cleaning | 6.7 ± 0.2 | 4.9 ± 0.2 | ||
| 0.10% microgel | 7.6 ± 0.2 | 83 | 5.5 ± 0.2 | 19 |
| 0.75% microgel | 8.1 ± 0.3 | 76 | 5.9 ± 0.2 | 15 |
| Gellan gel | 7.6 ± 0.2 | 49 | 5.5 ± 0.3 | 22 |
| water bath | 7.8 ± 0.2 | 80 | 5.3 ± 0.2 | 41 |
In order to obtain more insights into the removal of acidic degradation byproducts operated by the cleaning process, we performed HPLC analyses on the water extracts of paper fragments. This technique allows one to recognize the salts of several carboxylic acids arising from cellulose degradation. The analytical procedure was optimized in order to identify this kind of cellulose byproducts removed by the cleaning process.50 We considered both untreated and treated samples, the latter cleaned with microgels, hydrogel, and a water bath, as reported in Figure 4.
Figure 4.
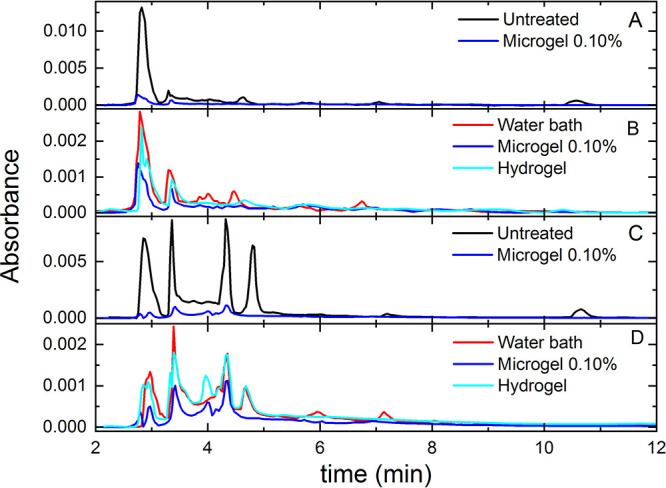
HPLC results for Breviarium (A, B) and Office samples (C, D). Different colors refer to untreated samples (black), samples cleaned by using a water bath (red), Gellan hydrogel (cyan), and 0.10% microgel (blue). Panels B and D display a reduced y-scale with respect to panels A and C in order to highlight the variations in the peaks among differently cleaned samples.
For Breviarium (Figure 4A), the use of 0.10% microgels induces a decrease of the peaks that are present in uncleaned samples due to the cellulose degradation process. These correspond to retention times of approximately 2.7, 3.5, 4.8, 7.2, and 10.8 min and can be ascribed to oxalic, ascorbic, malic, citric, and succinic acids, respectively.17,31,50 Comparing the results with those obtained by hydrogel and water bath treatments, as reported in Figure 4B, we observe that the use of microgels produces the highest removal for all peaks of carboxylic acids.
It is important to note that the analyses of the samples in Figure 4A,B were carried out in the same conditions. The higher absorbance intensity of the A panel with respect to that of the B panel is due to the higher amount of oxalic acid, exhibiting a peak around 2.7 min, which is present in the untreated sample but not in those of samples analyzed after a cleaning treatment. Similar considerations must be made for Figure 4C,D below.
A more complex scenario with respect to Breviarium is found for the Office sample. For untreated paper, besides the peaks corresponding to oxalic, ascorbic, citric, and succinic degradation compounds, the chromatograms display additional peaks in the region between 3.5 and 5 min, as shown in Figure 4C. These are probably due to paper composition (wood pulp instead of rags) and to the glue used for its production, but their identification is still under investigation. Most of the peaks are effectively reduced by the application of 0.10% microgels and, when compared to the other treatments in Figure 4D, we again observe that the use of microgels is the one yielding the highest removal of carboxylic degradation products. It is also important to stress that, in all cases and particularly for microgel treatment, no additional peaks are observed in the chromatograms of cleaned paper. In particular, the chromatographic profile of the water extract of Gellan gum hydrogel is characterized by peaks at retention times around 3.0, 5.9, and 12 min. Such peaks are totally absent in the chromatograms obtained from water extracts of paper samples, cleaned either with hydrogel or with microgels. These results exclude the presence of microgel residues after treatment. Additional information on the HPLC measurements and a complete comparison of the chromatograms obtained from the water extracts is reported in the Supporting Information (Figures S4 and S5 for Breviarium and Figures S6 and S7 for Office).
Confirmation of these findings is provided by FTIR spectra that are reported in Figure 5 for untreated and treated samples, comparing the three different cleaning methods for both types of paper samples. While the HPLC measurement protocol has been set up to reveal the carboxylic acids, the FTIR spectra provide information on the molecular structure of the pristine cellulose and on the products of its oxidative degradation. In particular, according to the literature,27,51 the spectral region between 1750 and 1550 cm–1 corresponds to the absorption bands of cellulose byproducts containing carboxyl and carbonyl groups. The infrared absorption spectra of the Breviarium samples in Figure 5A show that the intensity of the bands in the 1750–1550 cm–1 region are much smaller for cleaned samples with respect to the uncleaned ones.
Figure 5.

FTIR spectra of Breviarium and Office samples. Different colors refer to untreated samples (black), samples cleaned by using water bath (red), Gellan hydrogel (cyan), and 0.10% microgel (blue).
It should be noted that intensity variations in the 1550–1350 cm–1 region have to be attributed to small changes in the amount of carbonates alkaline reserve: in fact carbonates have two bands at about 1420 and 870 cm–1, and differences can be attributed to dissolution of the carbonate crystals, migration, or removal following water treatments. Instead, importantly the absorption band at 905 cm–1, which is ascribable to amorphous cellulose, does not significantly change as a consequence of the cleaning process, ensuring that the treatments do not induce a lowering of the paper quality. The reported spectra further show that the adopted cleaning processes do not induce the presence of any additional IR peaks. This amounts to say that, within the detection limit of the instrument, no residues, particularly of microgels, have been left on the samples, in agreement with HPLC and SEM. Further assessment on the absence of microgel residues is reported in the Supporting Information (see also Figures S8–S10).
We obtain similar results for Office samples, reported in Figure 5B, although the measured absorption intensity is much smaller in the 1750–1550 cm–1 region also for the untreated sample. Consequently, also the drop due to cleaning is strongly reduced and comparable for all treatments.
The same type of comparison among different treatments has been performed using optical reflectance spectroscopy, which furnishes a complementary investigation with respect to HPLC and FTIR. Indeed, it provides a detailed analysis of the improvement of the optical properties of samples and the efficiency of chromophores removal.
For untreated Breviarium paper, the optical absorption coefficient of cellulose fibers, α, shows a maximum in the ultraviolet (UV) region, followed by a shoulder at about 340 nm, a descent in the visible (Vis) range, and finally a lower level in the near-infrared (NIR) region, as shown in Figure 6A. This trend is common for ancient paper, being due to oxidation products such as carbonyls in the glucosidic rings of cellulose.52 For Office paper, other small spectroscopic features due to lignin (at about 285 nm) and optical brighteners (at about 375 and 400 nm) are superimposed to those due to cellulose carbonyls groups.53 Indeed, it has been demonstrated that these groups are UV–vis active (chromophores) and therefore responsible for the changes of the optical properties of cellulose artifacts during aging,27,40,41,54 in particular for the yellowing evident in paper aging and degradation. Thus, while violet and blue spectral regions are absorbed, those corresponding to yellow and red are largely scattered thereby producing the characteristic yellow-brown hue. The application of microgels on the Breviarium produces a very significant decrease of the chromophores band in the range 250–600 nm (see Figure 6A), comparable in effectiveness to the cleaning in a water bath.41 The 0.10% microgel treatment shows a slightly better cleaning capability with respect to the water bath as indicated by the overall smaller values of its α coefficient at all wavelengths.
Figure 6.
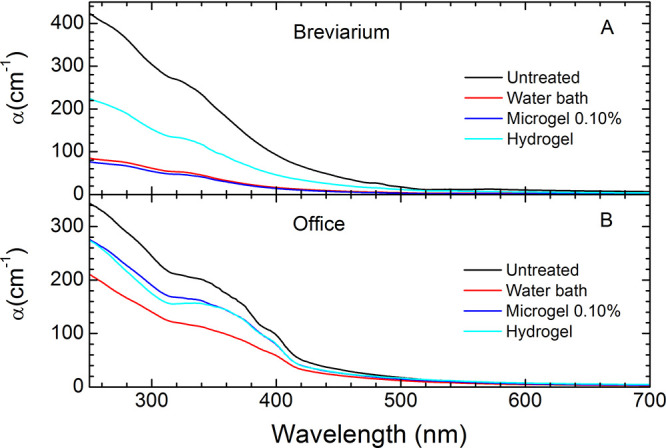
Optical absorption coefficient α for Breviarium (A) and Office (B) samples. Lines refer to untreated samples (black), samples cleaned by using a water bath (red), Gellan hydrogel (cyan), and 0.10% microgel (blue).
A quantitative evaluation of the
capability to remove chromophores
from paper substrates can be obtained by comparison of the integrals
of α calculated in the range 250–600 nm for treated and
untreated samples (IαT and Iα, respectively). According
to the Lambert–Beer law, α is directly proportional to
the concentration of chromophores and to their molar attenuation coefficient.54 Supposing that the latter is not modified by
treatments, the integrals provide an estimate of the concentration
of chromophores: results for different treatments are shown in Table 1 as the percentage
of chromophore reduction  . CR(%) values confirm that microgels
remove
chromophores as efficiently as the water bath but within a much reduced
application time. Interestingly, the hydrogel treatment is not very
effective for removing chromophores. Concerning Office samples, instead,
we find that the application of microgels produces a much smaller
decrease in the chromophores band as compared to cleaning with liquid
water (see Figure 6B). In this case, the efficacy of hydrogel treatment is comparable
to that of microgels.
. CR(%) values confirm that microgels
remove
chromophores as efficiently as the water bath but within a much reduced
application time. Interestingly, the hydrogel treatment is not very
effective for removing chromophores. Concerning Office samples, instead,
we find that the application of microgels produces a much smaller
decrease in the chromophores band as compared to cleaning with liquid
water (see Figure 6B). In this case, the efficacy of hydrogel treatment is comparable
to that of microgels.
3.3. Concentration Effects: Case of 0.75% Microgels
In this section, we report results for the second microgel sample analyzed in this work, i.e., the 0.75% sample with Gellan gum weight concentration Cw = 0.75% and NaCl weight concentration Cs = 10 mM, and we compare its performance with respect to the 0.10% sample.
The rheological assessment provides evidence that the 0.75% sample does not reach an elastic behavior, being always G″ > G′, as reported in Figure 7A. This finding is in agreement with results of ref.34 and is confirmed also 25 h after preparation. We clearly see that aging effects are almost absent. Interestingly, the values of the measured G′ are very similar for the two studied microgel samples (see also Figure 2), suggesting that a combined effect of Gellan concentration and salt content is at work to determine the elastic properties of the systems, as originally discussed in ref (34).
Figure 7.

Characterization and efficiency of 0.75% microgel samples. (A,B) Storage modulus G′(γ) (open symbols) and loss modulus G″(γ) (closed symbols) as a function of shear strain γ at fixed frequency 1 Hz, at T = 25 °C for the 0.75% microgel sample. Measurements performed immediately after preparation (A) and 25 h after preparation (B) are reported to exclude significant aging of the samples; SEM images of (top row) Breviarium sample uncleaned (C) and cleaned (D) with 0.75% microgels and (bottom row) Office sample uncleaned (E) and cleaned (F) with 0.75% microgels; optical absorption coefficient α for Breviarium (G) and Office (H) samples. Different lines refer to untreated samples (black), samples cleaned by using 0.75% microgel (green) and 0.10% microgel (blue); FTIR spectra of Breviarium (I) and Office (L) samples. The color code is the same as in panels G and H.
We have then repeated the cleaning tests experiments for the 0.75% sample on both Breviarium and Office paper. We report SEM images in Figure 7B,C, which confirm also in this case the absence of any residues, either microgel or NaCl, in the treated paper. A quantitative comparison of the cleaning performance of the more concentrated microgel samples is reported in Table 1. We observe that the pH of treated samples is quite comparable to that of the other cleaning treatments but slightly higher for both Breviarium and Office paper. Similarly, the chromophore reduction is slightly lower with respect to 0.10% microgels and water bath. Optical reflectance spectroscopy results are reported in Figure 7D,E for Breviarium and Office samples, confirming at all probed wavelengths that 0.75% microgels have slightly less cleaning capability with respect to the 0.10% samples for both types of paper. Similar findings are also obtained with FTIR experiments, reported in Figure 7F,G.
4. Conclusions
In this work, we proposed to use Gellan gum microgels as innovative agents for cleaning treatments in the restoration of paper artworks. We built on previous works which have reported, on one hand, the ability of Gellan gum hydrogels to this purpose17,18 and, on the other hand, the preparation of Gellan gum microgels under shear cooling.34 Our work was based on the hypothesis that the use of microgel particles would allow us to achieve a superior performance with respect to hydrogels, since microgels can penetrate more efficiently into paper pores thanks to their colloidal scale size. This would enhance the cleaning ability of the gels and, at the same time, would allow to obtain a faster cleaning treatment.
We have then prepared two microgel samples, different both in Gellan gum and NaCl concentrations, whose stability has been assessed for at least 25 h. The 0.10% sample has a lower polymer concentration but a higher salt content, which provides it with the characteristics of a soft elastic solid as seen from rheological measurements. On the other hand, the 0.75% microgel, having a lower salt content by 10 times, remains a viscous liquid. Microgel formation was confirmed by DLS measurements as well as by fluorescent microscopy yielding particles with an average radius of a micron. After this characterization, we have tested both microgel samples on paper in order to discriminate eventual differences in their cleaning efficacy.
In order to perform a robust test, we have employed two different kinds of material: ancient paper (Breviarium), made of rag pulp, and modern paper (Office), mainly composed of chemically bleached wood pulp. Qualitative analysis to determine papers sources and pulping processes was performed following the color change on paper fibers obtained after staining them with Graff “C” stain test. It is interesting to note that very few works have focused so far on the cleaning of modern paper artworks.19 The cleaning ability of microgels was compared to previously established procedures, by applying on the very same samples also a conventional water bath and a Gellan gum based hydrogel, which was recently established as a promising tool to paper preservation and cleaning.17,18 For all these protocols, we performed a combination of diagnostic techniques providing a thorough and quantitative evaluation of their cleaning efficacy.
In particular, HPLC and pH measurements have been used to assess the removal of acidic molecules. pH measurements provided evidence that microgels give a higher paper samples pH than that obtained by using hydrogels, confirming they ability to efficiently remove acidic byproducts. Optical reflectance spectroscopy highlighted the removal of chromophore molecules, compounds carrying carbonyl groups. Both acidic compounds and chromophores are byproducts from cellulose degradation due to aging and must be removed from paper to slow down degradation and improve optical quality. FTIR measurements were used to overall check the efficient removal of oxidized degradation byproducts and to confirm that the treatments do not induce a lowering of the paper quality. SEM and tensile tests have been employed to assess that the proposed cleaning methods do not change the morphology and the mechanical properties of paper samples and do not leave residues. Furthermore, electrical conductivity experiments of water extracts of cleaned paper samples have allowed us to exclude the presence of any salt residues.
Overall these measurements have confirmed that microgels represent an efficient tool for paper cleaning, resulting in the best treatment with all diagnostic techniques. In particular, HPLC and FTIR spectroscopy indicate that microgels are more efficient than water and hydrogels in removing the carboxylic compounds. At the same time, optical spectroscopy confirms the ability of microgels to penetrate the porous structure of Breviarium, removing the small fragments of oxidized cellulose polymers with an efficacy comparable to water bath. Minor differences between HPLC, FTIR, and optical reflectance spectroscopy results can be explained by the fact that chromophores are mainly carbonyl functionalities bonded to the glucosidic rings of cellulose. Their removal is only possible when they are localized on small fragments of cellulose polymers created by the hydrolytic chains scission. Carboxylic moieties, instead, are not UV–vis active,54,55 but they can be detected by HPLC and FTIR spectroscopy. These results further highlight the importance of performing complementary techniques since each analytical methodology is able to give information on the removal performances of a subset of byproducts.
Comparing between the 0.10% and 0.75% microgel samples, we found that they are rather similar in terms of cleaning efficiency, with an overall slightly superior performance of the 0.10% case. This indicates that increasing microgel concentration does not lead to an improvement in cleaning of paper substrate, and thus, it is sufficient to work with a less concentrated sample, allowing for a reduction of both costs and invasivity. Overall we do not find evidence of any microgel residues, even for the more viscous 0.75% sample. We postpone to future investigation a more systematic assessment of the optimal conditions of microgel preparation, in terms of Gellan gum and salt concentration, to be employed for paper restoration.
Instead, it is important to stress that a considerable improvement in terms of cleaning has been obtained by microgels with respect to hydrogel and also with respect to a water bath. This is actually a rather spectacular result, also considering the fact that the cleaning time is only a few minutes in the case of microgels and about 1 h in the case of water bath or treatment with hydrogels. To visualize the microgel’s ability to penetrate into paper sheets, additional experiments performed on colored paper have been reported in the Supporting Information (see Figures S11–S14). Altogether, these results confirm our hypothesis that microgel diffusion and penetration into the cellulose porous matrix is a crucial issue involved in the cleaning process that speeds up the osmosis regulated exchange of water and degradation products. It will be important to test the kinetic aspects of this exchange in the future by changing and optimizing the cleaning times.
Turning to Office paper, the cleaning effectiveness of microgels for these samples is comparable to that of hydrogels but not as efficient as the water bath. This result actually reinforces our initial hypothesis of microgel penetration as the key for an effective cleaning mechanism. Indeed, Office paper has a less porous surface morphology due to the coating with synthetic polymers, so that the accessibility to the underneath cellulose fibers network is reduced.22 The difference between the results obtained using Breviarium or Office paper can be ascribed to the different composition of paper and of the sizing material used to avoid the spreading of inks. Indeed, ancient paper was mainly sized by using animal glue or starch, while modern paper is sized by using alum-rosin or compounds based on synthetic polymers, like Alkyl Ketene Dimer (AKD) or Alkenyl Succinic Anhydride (ASA), that are much more efficient as a water-proofing agent56 and thus less prone to water cleaning treatments. Thus, the less penetrable layer of modern paper prevents the microgels to have the same cleaning efficacy as for ancient paper, at least for such a short cleaning time. It will be important to further test microgels in the future for longer times as well as to optimize the microgel suspension preparation, and possibly their size, to see whether better results can be achieved.
Altogether these findings establish Gellan gum-based microgels as a promising tool for paper preservation. More in general, they reinforce the idea that microgels and other soft materials would have a great, yet largely unexplored, potentiality in the context of cultural heritage conservation and restoration, as suggested in recent years.57 Microgels could therefore provide advanced cleaning protocols with respect to the current ones. As a future perspective, they may also be suitable carriers of more effective cleaning agents, such as, for example, tensioactives or enzymes that could act for the removal of localized degradation stains of chemical and biological origin.
Acknowledgments
We thank Andrea Martinelli for sharing the ACQUATI dynamometer used for tensile tests experiments. We acknowledge financial support from Regione Lazio, through L.R. 13/08, Progetto Gruppo di Ricerca GELARTE No. prot.85-2017-15290 and from MIUR FARE Project SOFTART (R16XLE2x3L). R.A., B.R., N.G., and E.Z. also acknowledge support from the European Research Council (ERC-CoG-2015, Grant No. 681597 MIMIC).
Supporting Information Available
The Supporting Information is available free of charge at https://pubs.acs.org/doi/10.1021/acsapm.0c00342.
Additional materials and methods; steady-state fluorescence experiments as indirect probe of microgel formation (Figure S1); paper fiber analysis with Graff ”C” stain tests (Figure S2); tensile tests (Table S1); microscope images (Figure S3); further results on the cleaning efficacy of microgels (Figures S4–S7); assessment of the presence of microgel and salt residues (Figures S8–S10); and evaluation of microgels ability to penetrate into paper (Figures S11–S14) (PDF)
The authors declare no competing financial interest.
Supplementary Material
References
- Pelton R. Temperature-Sensitive Aqueous Microgels. Adv. Colloid Interface Sci. 2000, 85, 1–33. 10.1016/S0001-8686(99)00023-8. [DOI] [PubMed] [Google Scholar]
- Fernandez-Nieves A.; Wyss H.; Mattsson J.; Weitz D. A.. Microgel Suspensions: Fundamentals and Applications; John Wiley & Sons, 2011. [Google Scholar]
- Brijitta J.; Schurtenberger P. Responsive Hydrogel Colloids: Structure, Interactions, Phase Behaviour, and Equilibrium and Non-Equilibrium Transitions of Microgel Dispersions. Curr. Opin. Colloid Interface Sci. 2019, 40, 87–103. 10.1016/j.cocis.2019.02.005. [DOI] [Google Scholar]
- Karg M.; Pich A.; Hellweg T.; Hoare T.; Lyon L. A.; Crassous J. J.; Suzuki D.; Gumerov R. A.; Schneider S.; Potemkin I.; Richtering W. Nanogels and Microgels: From Model Colloids to Applications, Recent Developments and Future Trends. Langmuir 2019, 35, 6231–6255. 10.1021/acs.langmuir.8b04304. [DOI] [PubMed] [Google Scholar]
- Rovigatti L.; Gnan N.; Tavagnacco L.; Moreno A. J.; Zaccarelli E. Numerical Modelling of Non-Ionic Microgels: An Overview. Soft Matter 2019, 15, 1108–1119. 10.1039/C8SM02089B. [DOI] [PMC free article] [PubMed] [Google Scholar]
- Mohanty P. S.; Nöjd S.; van Gruijthuijsen K.; Crassous J. J.; Obiols-Rabasa M.; Schweins R.; Stradner A.; Schurtenberger P. Interpenetration of Polymeric Microgels at Ultrahigh Densities. Sci. Rep. 2017, 7, 1487. 10.1038/s41598-017-01471-3. [DOI] [PMC free article] [PubMed] [Google Scholar]
- Vlassopoulos D.; Cloitre M. Tunable Rheology of Dense Soft Deformable Colloids. Curr. Opin. Colloid Interface Sci. 2014, 19, 561–574. 10.1016/j.cocis.2014.09.007. [DOI] [Google Scholar]
- Conley G. M.; Zhang C.; Aebischer P.; Harden J. L.; Scheffold F. Relationship Between Rheology and Structure of Interpenetrating, Deforming and Compressing Microgels. Nat. Commun. 2019, 10, 2436. 10.1038/s41467-019-10181-5. [DOI] [PMC free article] [PubMed] [Google Scholar]
- Zanatta M.; Tavagnacco L.; Buratti E.; Bertoldo M.; Natali F.; Chiessi E.; Orecchini A.; Zaccarelli E. Evidence of a Low-Temperature Dynamical Transition in Concentrated Microgels. Sci. Adv. 2018, 4, eaat5895. 10.1126/sciadv.aat5895. [DOI] [PMC free article] [PubMed] [Google Scholar]
- Zanatta M.; Tavagnacco L.; Buratti E.; Chiessi E.; Natali F.; Bertoldo M.; Orecchini A.; Zaccarelli E. Atomic Scale Investigation of the Volume Phase Transition in Concentrated PNIPAM Microgels. J. Chem. Phys. 2020, 152, 204904. 10.1063/5.0007112. [DOI] [PubMed] [Google Scholar]
- Yunker P. J.; Chen K.; Gratale M. D.; Lohr M. A.; Still T.; Yodh A. Physics in Ordered and Disordered Colloidal Matter Composed of Poly (N-isopropylacrylamide) Microgel Particles. Rep. Prog. Phys. 2014, 77, 056601. 10.1088/0034-4885/77/5/056601. [DOI] [PubMed] [Google Scholar]
- Lyon L. A.; Fernandez-Nieves A. The Polymer/Colloid Duality of Microgel Suspensions. Annu. Rev. Phys. Chem. 2012, 63, 25–43. 10.1146/annurev-physchem-032511-143735. [DOI] [PubMed] [Google Scholar]
- Bergman M. J.; Gnan N.; Obiols-Rabasa M.; Meijer J.-M.; Rovigatti L.; Zaccarelli E.; Schurtenberger P. A New Look at Effective Interactions Between Microgel Particles. Nat. Commun. 2018, 9, 5039. 10.1038/s41467-018-07332-5. [DOI] [PMC free article] [PubMed] [Google Scholar]
- Oh J. K.; Drumright R.; Siegwart D. J.; Matyjaszewski K. The Development of Microgels/Nanogels for Drug Delivery Applications. Prog. Polym. Sci. 2008, 33, 448–477. 10.1016/j.progpolymsci.2008.01.002. [DOI] [Google Scholar]
- Fernández-Barbero A.; Suárez I. J.; Sierra-Martín B.; Fernández-Nieves A.; de las Nieves F. J.; Marquez M.; Rubio-Retama J.; López-Cabarcos E. Gels and Microgels for Nanotechnological Applications. Adv. Colloid Interface Sci. 2009, 147, 88–108. 10.1016/j.cis.2008.12.004. [DOI] [PubMed] [Google Scholar]
- Baglioni M.; Giorgi R.; Berti D.; Baglioni P. Smart Cleaning of Cultural Heritage: A New Challenge for Soft Nanoscience. Nanoscale 2012, 4, 42–53. 10.1039/C1NR10911A. [DOI] [PubMed] [Google Scholar]
- Mazzuca C.; Micheli L.; Carbone M.; Basoli F.; Cervelli E.; Iannuccelli S.; Sotgiu S.; Palleschi A. Gellan Hydrogel as a Powerful Tool in Paper Cleaning Process: A Detailed Study. J. Colloid Interface Sci. 2014, 416, 205–211. 10.1016/j.jcis.2013.10.062. [DOI] [PubMed] [Google Scholar]
- Mazzuca C.; Micheli L.; Lettieri R.; Cervelli E.; Coviello T.; Cencetti C.; Sotgiu S.; Iannuccelli S.; Palleschi G.; Palleschi A. How to Tune a Paper Cleaning Process by Means of Modified Gellan Hydrogels. Microchem. J. 2016, 126, 359–367. 10.1016/j.microc.2015.12.016. [DOI] [Google Scholar]
- Bonelli N.; Montis C.; Mirabile A.; Berti D.; Baglioni P. Restoration of Paper Artworks With Microemulsions Confined in Hydrogels for Safe and Efficient Removal of Adhesive Tapes. Proc. Natl. Acad. Sci. U. S. A. 2018, 115, 5932–5937. 10.1073/pnas.1801962115. [DOI] [PMC free article] [PubMed] [Google Scholar]
- Hunter D.Papermaking: The History and Technique of an Ancient Craft; Dover Publications: New York, 1978. [Google Scholar]
- Corsaro C.; Mallamace D.; Łojewska J.; Mallamace F.; Pietronero L.; Missori M. Molecular Degradation of Ancient Documents Revealed by 1H HR-MAS NMR Spectroscopy. Sci. Rep. 2013, 3, 2896. 10.1038/srep02896. [DOI] [PMC free article] [PubMed] [Google Scholar]
- Chinga-Carrasco G. Exploring the multi-scale structure of printing paper – a review of modern technology. J. Microsc. 2009, 234, 211–242. 10.1111/j.1365-2818.2009.03164.x. [DOI] [PubMed] [Google Scholar]
- Area M. C.; Cheradame H. Paper Aging and Degradation: Recent Findings and Research Methods. BioResources 2011, 6, 5307–5337. [Google Scholar]
- Domenech-Carbo M. T. Novel Analytical Methods for Characterising Binding Media and Protective Coatings in Artworks. Anal. Chim. Acta 2008, 621, 109–139. 10.1016/j.aca.2008.05.056. [DOI] [PubMed] [Google Scholar]
- Łojewska J.; Miśkowiec P.; Łojewski T.; Proniewicz L. Cellulose Oxidative and Hydrolytic Degradation: In Situ FTIR Approach. Polym. Degrad. Stab. 2005, 88, 512–520. 10.1016/j.polymdegradstab.2004.12.012. [DOI] [Google Scholar]
- Łojewska J.; Lubańska A.; Miśkowiec P.; Łojewski T.; Proniewicz L. FTIR in Situ Transmission Studies on the Kinetics of Paper Degradation via Hydrolytic and Oxidative Reaction Paths. Appl. Phys. A: Mater. Sci. Process. 2006, 83, 597. 10.1007/s00339-006-3529-9. [DOI] [Google Scholar]
- Mosca Conte A.; Pulci O.; Knapik A.; Bagniuk J.; Del Sole R.; Lojewska J.; Missori M. Role of Cellulose Oxidation in the Yellowing of Ancient Paper. Phys. Rev. Lett. 2012, 108, 158301. 10.1103/PhysRevLett.108.158301. [DOI] [PubMed] [Google Scholar]
- Carretti E.; Dei L.; Weiss R. G.; Baglioni P. A New Class of Gels for the Conservation of Painted Surfaces. J. Cult. Herit. 2008, 9, 386–393. 10.1016/j.culher.2007.10.009. [DOI] [Google Scholar]
- Isca C.; Fuster-López L.; Yusá-Marco D. J.; Casoli A. An Evaluation of Changes Induced by Wet Cleaning Treatments in the Mechanical Properties of Paper Artworks. Cellulose 2015, 22, 3047–3062. 10.1007/s10570-015-0712-1. [DOI] [Google Scholar]
- Carretti E.; Bonini M.; Dei L.; Berrie B. H.; Angelova L. V.; Baglioni P.; Weiss R. G. New Frontiers in Materials Science for Art Conservation: Responsive Gels and Beyond. Acc. Chem. Res. 2010, 43, 751–760. 10.1021/ar900282h. [DOI] [PubMed] [Google Scholar]
- Mazzuca C.; Poggi G.; Bonelli N.; Micheli L.; Baglioni P.; Palleschi A. Innovative Chemical Gels Meet Enzymes: A Smart Combination for Cleaning Paper Artworks. J. Colloid Interface Sci. 2017, 502, 153–164. 10.1016/j.jcis.2017.04.088. [DOI] [PubMed] [Google Scholar]
- Picone C. S. F.; Cunha R. L. Influence of PH on Formation and Properties of Gellan Gels. Carbohydr. Polym. 2011, 84, 662–668. 10.1016/j.carbpol.2010.12.045. [DOI] [Google Scholar]
- Morris E. R.; Nishinari K.; Rinaudo M. Gelation of Gellan–A Review. Food Hydrocolloids 2012, 28, 373–411. 10.1016/j.foodhyd.2012.01.004. [DOI] [Google Scholar]
- Caggioni M.; Spicer P.; Blair D.; Lindberg S.; Weitz D. Rheology and Microrheology of a Microstructured Fluid: The Gellan Gum Case. J. Rheol. 2007, 51, 851–865. 10.1122/1.2751385. [DOI] [Google Scholar]
- Nigro V.; Angelini R.; Bertoldo M.; Bruni F.; Ricci M. A.; Ruzicka B. Dynamical Behavior of Microgels of Interpenetrated Polymer Networks. Soft Matter 2017, 13, 5185–5193. 10.1039/C7SM00739F. [DOI] [PMC free article] [PubMed] [Google Scholar]
- Pai V.; Srinivasarao M.; Khan S. A. Evolution of Microstructure and Rheology in Mixed Polysaccharide Systems. Macromolecules 2002, 35, 1699–1707. 10.1021/ma0115545. [DOI] [Google Scholar]
- Micheli L.; Mazzuca C.; Missori M.; Teodonio L.; Mosca Conte A.; Pulci O.; Arcadipane L.; Dominijanni S.; Palleschi A.; Palleschi G.; Iannuccelli S.; Sotgiu S. Interdisciplinary Approach to Develop a Disposable Real Time Monitoring Tool for the Cleaning of Graphic Artworks. Application on ”le Nozze di Psiche. Microchem. J. 2018, 138, 369–378. 10.1016/j.microc.2018.01.022. [DOI] [Google Scholar]
- Rosu D.; Teaca C.-A.; Bodirlau R.; Rosu L. FTIR and Color Change of the Modified Wood as a Result of Artificial Light Irradiation. J. Photochem. Photobiol., B 2010, 99, 144–149. 10.1016/j.jphotobiol.2010.03.010. [DOI] [PubMed] [Google Scholar]
- Conte A. M.; Pulci O.; Misiti M.; Lojewska J.; Teodonio L.; Violante C.; Missori M. Visual Degradation in Leonardo da Vinci’s Iconic Self-Portrait: A Nanoscale Study. Appl. Phys. Lett. 2014, 104, 224101. 10.1063/1.4879838. [DOI] [Google Scholar]
- Missori M. Optical Spectroscopy of Ancient Paper and Textiles. Nuovo Cimento C 2016, 39, 293. 10.1393/ncc/i2016-16293-x. [DOI] [Google Scholar]
- Missori M.; Mosca Conte A.; Pulci O.; Teodonio L.; Dominijanni S.; Puteo S.; Iannuccelli S.; Sotgiu S.; Sebastiani M. L. Non-Destructive Monitoring of Molecular Modifications in the Restoration of Works of Art on Paper-Application of Theoretical and Experimental Optical Spectroscopy. Eur. Phys. J. Plus 2019, 134, 99. 10.1140/epjp/i2019-12524-3. [DOI] [Google Scholar]
- Yang L.; Miklavcic S. J. Revised Kubelka–Munk Theory. III. A General Theory of Light Propagation in Scattering and Absorptive Media. J. Opt. Soc. Am. A 2005, 22, 1866–1873. 10.1364/JOSAA.22.001866. [DOI] [PubMed] [Google Scholar]
- Adamopoulos S.; Oliver J.-V. Fiber Composition of Packaging Grade Papers as Determined by the Graff ”C” Staining Test. Wood Fiber Sci. 2006, 38, 567–575. [Google Scholar]
- Cullen D.; Baker I. Observation of Impurities in Ice. Microsc. Res. Tech. 2001, 55, 198–207. 10.1002/jemt.10000. [DOI] [PubMed] [Google Scholar]
- Ebert M.; Inerle-Hof M.; Weinbruch S. Environmental Scanning Electron Microscopy as a New Technique to Determine the Hygroscopic Behaviour of Individual Aerosol Particles. Atmos. Environ. 2002, 36, 5909–5916. 10.1016/S1352-2310(02)00774-4. [DOI] [PubMed] [Google Scholar]
- Lee J.; Ashokkumar M.; Kentish S. E. Influence of Mixing and Ultrasound Frequency on Antisolvent Crystallisation of Sodium Chloride. Ultrason. Sonochem. 2014, 21, 60–68. 10.1016/j.ultsonch.2013.07.005. [DOI] [PubMed] [Google Scholar]
- Strlič M.; Kolar J.. Ageing and Stabilisation of Paper; National and University Library: Ljubljana, 2005. [Google Scholar]
- Libby C. E. Pulp.Pulp and Paper Science and Technology; McGraw-Hill, 1962; Vol. 2. [Google Scholar]
- Colom X.; Carrillo F.; Nogués F.; Garriga P. Structural Analysis of Photodegraded Wood by Means of FTIR Spectroscopy. Polym. Degrad. Stab. 2003, 80, 543–549. 10.1016/S0141-3910(03)00051-X. [DOI] [Google Scholar]
- Micheli L.; Mazzuca C.; Palleschi A.; Palleschi G. Development of a Diagnostic and Cleaning Tool for Paper Artworks: A Case of Study. Microchem. J. 2016, 126, 32–41. 10.1016/j.microc.2015.11.052. [DOI] [Google Scholar]
- Łojewski T.; Miśkowiec P.; Missori M.; Lubańska A.; Proniewicz L.; Łojewska J. FTIR and UV/vis as Methods for Evaluation of Oxidative Degradation of Model Paper: DFT Approach for Carbonyl Vibrations. Carbohydr. Polym. 2010, 82, 370–375. 10.1016/j.carbpol.2010.04.087. [DOI] [Google Scholar]
- Ahn K.; Zaccaron S.; Zwirchmayr N. S.; Hettegger H.; Hofinger A.; Bacher M.; Henniges U.; Hosoya T.; Potthast A.; Rosenau T. Yellowing and Brightness Reversion of Celluloses: CO or COOH, Who Is the Culprit?. Cellulose 2019, 26, 429–444. 10.1007/s10570-018-2200-x. [DOI] [Google Scholar]
- D’Aleo L.; Ciccola A.; Ghofraniha N.; Viola I.; Sennato S.; Magrini S.; Missori M. Diagnostic Study of Ancient Durium Phonographic Discs. Microchem. J. 2020, 155, 104781. 10.1016/j.microc.2020.104781. [DOI] [Google Scholar]
- Missori M.; Pulci O.; Teodonio L.; Violante C.; Kupchak I.; Bagniuk J.; Łojewska J.; Conte A. M. Optical Response of Strongly Absorbing Inhomogeneous Materials: Application to Paper Degradation. Phys. Rev. B: Condens. Matter Mater. Phys. 2014, 89, 054201. 10.1103/PhysRevB.89.054201. [DOI] [Google Scholar]
- Hosoya T.; Bacher M.; Potthast A.; Elder T.; Rosenau T. Insights Into Degradation Pathways of Oxidized Anhydroglucose Units in Cellulose by β-Alkoxy-Elimination: A Combined Theoretical and Experimental Approach. Cellulose 2018, 25, 3797–3814. 10.1007/s10570-018-1835-y. [DOI] [Google Scholar]
- Calvini P.; Gorassini A. FTIR–deconvolution Spectra of Paper Documents. Restaurator 2002, 23, 48–66. 10.1515/REST.2002.48. [DOI] [Google Scholar]
- Baglioni P.; Carretti E.; Chelazzi D. Nanomaterials in Art Conservation. Nat. Nanotechnol. 2015, 10, 287. 10.1038/nnano.2015.38. [DOI] [PubMed] [Google Scholar]
Associated Data
This section collects any data citations, data availability statements, or supplementary materials included in this article.