

Abstract
This study examined the responses of eumenorrheic women to 60 min of submaximal exercise at the mid-follicular (MF), ovulatory (OV) and mid-luteal (ML) phases of the menstrual cycle. Blood metabolite-hormonal measures, cardiorespiratory responses and ratings of perceived exertion (RPE) (local, legs only; and total, entire body) were monitored at 15-min intervals throughout exercise. No significant effects for phase were observed in the blood measures or the cardiorespiratory responses, except for the respiratory exchange ratio (RER). The overall exercise OV RER (0.86 ± 0.02; mean ± SEM) was lower than at MF (0.94 ± 0.02) but not at ML (0.89 ± 0.01). Substrate utilization (%) and oxidation (g/min) calculations indicated that more fat was used during OV than at MF but not ML. Conversely, more carbohydrate was used during MF than OV. Additionally, local RPE was higher in OV than in the MF or ML trials at 30–60 min of exercise. These findings suggest that menstrual cycle hormonal fluctuations influence metabolic substrate usage and effort perception during submaximal exercise in eumenorrheic women.
Keywords: metabolism, hormones, females, eumenorrhea
During the last several decades, a great deal of research has addressed the question of how exercise effects the menstrual cycle. The impetus for this work has been increased incidence of menstrual dysfunction associated with athletic and intensively training women (1–3). Recently, however, investigators have begun to address the opposite question, how the menstrual cycle affects a women’s ability to exercise (4). The basis for proposing this question is the fact that the large fluctuations in the circulating levels of hormones in eumenorrheic females have the potential to affect the body’s metabolism. In particular, animal research indicates that the female sex hormones, estrogens and progestogens, significantly affect the metabolism of carbohydrate and lipid (5–7). However, existing sports medicine research is contradictory as to whether the endogenous fluctuations of sex hormones during the menstrual cycle influence the metabolism of humans during exercise (8–11).
Most studies examining the effects of the menstrual cycle on the responses to exercise have compared subjects at the mid-follicular (MF) (low estrogen-progestogen levels) and mid-luteal (ML; high estrogen-progestogen levels) phases of the cycle. Few studies have attempted to examine the exercise responses during the ovulatory (OV) (divergent estrogen-progestogen levels) phase of the cycle. With this in mind, the intent of this study was to examine the physiological responses of eumenorrheic women to 60 min of submaximal exercise in the MF, OV and ML phases of the menstrual cycle.
Material and methods
Subjects
An initial screening procedure was used to identify potential subjects. This consisted of prospective subjects monitoring daily basal body temperature for 2–3 months to determine ovulation. A 0.3°C increase in temperature was used to identify ovulation (4). Additionally, during the final month of monitoring, morning urine and blood samples were periodically collected and analyzed for luteinizing hormone (LH) to confirm the occurrence of ovulation. From these procedures, 6 eumenorrheic women were identified as subjects for this study. Their physical characteristics (mean ± SD) were: age = 26 ± 6 years, weight = 59 ± 9 kg, height = 165 ± 7 cm, and maximal oxygen consumption ml/kg/min. Their average menstrual cycle length was 29 ± 1 d (mean ± SEM). None of the subjects had been on oral contraceptives for the previous 6–12 months. To determine each subject’s , a cycle ergometry test was conducted. The protocol for this test was graded (4-min stages, 30 W workload increase per stage) and until volitional fatigue. These tests occurred in the late luteal phase for 2 subjects and early follicular for the remaining subjects. Jurkowski and associates have demonstrated that does not differ throughout the menstrual cycle (12); therefore, our study findings should not have been influenced by having the test occur at different points in the cycle.
Exercise trials
Each subject performed a 60-min steady-state exercise bout at 70% of their . These bouts occurred at days 7–8 (MF), 14–16 (OV) and 22–23 (ML) of their cycles. For 36 h prior to each of these exercise bouts, the subject’s activity patterns and diets were replicated. Each trial took place approximately at the same time of day.
Physiological measures
Cardiorespiratory measures were heart rate (HR), minute ventilation (VE), oxygen consumption (VO2), carbon dioxide production (VCO2), as measured by open spirometry, indirect calorimetry. Briefly, the aforementioned procedure consisted of the subject breathing through a low-resistance mouth piece while expired gases were monitored and analyzed continuously via oxygen, carbon dioxide analyzers and a gas volume meter (13). This equipment was controlled with a Rayfield computerization system (Rayfield, USA). The VO2 and VCO2 measures were used to calculate the non-protein respiratory exchange ratio (RER), caloric cost and carbohydrate-fat utilization and oxidation via standard calorimetry formulas. These formulas are reported elsewhere (13). It should be noted that the RER values obtained did not account for protein contribution to the exercise bouts. Therefore, the utilization and oxidation responses do not reflect any potential protein effect on the physiological outcome. The subject’s HR was assessed from ECG tracings obtained from a CM5 electrode placement (13). All cardiorespiratory measures were taken at rest, 15, 30, 45 and 60 min of exercise.
Blood samples were obtained from an indwelling venous catheter (antecubital vein) inserted 20 min prior to the start of exercise. Samples were analyzed for glucose, hematocrit (Hct), hemoglobin (Hb), pH, estradiol (E2) and progesterone (P). Blood measures were assessed at 15-min intervals, as with cardiorespiratory measures, except for E2 and P, which were measured only at rest and the end of exercise. Glucose was determined by a hexokinase enzymatic-based assay (Sigma Chemical, USA), blood pH by micro-electrode (Radiometer, FRG), hormones by RIA kits (DPC, USA), Hb via Drabkin reagent (Sigma Chemical) and Hct microcapillary tubes. Additionally, at 15-min intervals during exercise, ratings of perceived exertion (RPE) were obtained relative to the total body (T-RPE) and localized (L-RPE) exercising muscle group (legs) using the modified Borg Scale (14).
Statistics
The dependent variables were analyzed with a repeated-measures analysis of variance with P ≤ 0.05. Post hoc comparisons were made with Fisher least significant difference procedures employing a 2-tail test for significance (15). All results are reported as means ± SEM.
Results
Hormonal analysis of resting blood samples indicated that the subjects were in the desired menstrual phase for each of the exercise bouts: E2 (rest, post-exercise); MF = 179.6 ± 47.9 vs 356.0 ± 58.8, OV = 2287.3 ± 1083.8 vs 589.9 ± 156.4, ML = 692.0 ± 257.2 vs 737.2 ± 98.1 pmol/l. P (rest, post-exercise): MF = 1.75 ± 0.51 vs 1.91 ± 0.76, OV = 10.18 ± 4.08 vs 20.07 ± 9.98, ML = 33.23 ± 7.73 vs 43.82 ± 14.11 nmol/l).
Statistical analysis of the blood and cardiorespiratory measures (Tables 1,2) indicated that normal steady-state exercise responses occurred: HR, VE, VO2 and VCO2 increased (P < 0.05) from rest to exercise and then remained at relatively constant levels (P > 0.05). Additionally, blood glucose and pH during exercise were variable (NS) from resting levels. Within all these measures, no significant differences caused by cycle phase were observed during exercise. The only exception, however, in these findings was for the RER measure (Fig. 1). The overall RER throughout the OV trial was (P < 0.03) lower than at the MF trial. Conversely, the RER at ML was not different from the MF or OV RER; however, the ML vs MF differences approached significance (P = 0.07).
Table 1.
Changes in cardiorespiratory measuresa during the study
| Measure Phase | Time (min) | ||||
|---|---|---|---|---|---|
| Rest | 15 | 30 | 45 | 60 | |
| Heart rate (bpm) | |||||
| MF | 67.8±4.2 | 145.0 ± 7.8 | 152.7±3.0 | 149.0±5.3 | 155.0±4.6 |
| OV | 69.7±4.3 | 148.0±11.6 | 160.8±5.1 | 158.5±4.2 | 164.3±4.7 |
| ML | 70.8±5.7 | 149.8 ± 5.8 | 162.3±8.8 | 158.3±6.1 | 161.0±6.1 |
| VE (l/min)b | |||||
| MF | 8.5±0.8 | 45.4 ± 2.9 | 43.8±2.1 | 42.7±2.6 | 43.8±2.8 |
| OV | 7.5±0.6 | 44.7 ± 2.4 | 44.0±2.3 | 42.6±3.6 | 42.9±3.6 |
| ML | 8.0±0.6 | 46.3 ± 2.9 | 44.1±3.3 | 44.4±3.6 | 43.2±3.6 |
| VO2 (l/min)c | |||||
| MF | 0.29±0.03 | 1.93 ± 0.13 | 1.81±0.11 | 1.81±0.11 | 1.84±0.14 |
| OV | 0.25±0.01 | 1.91 ± 0.13 | 1.86±0.12 | 1.86±0.13 | 1.89±0.12 |
| ML | 0.33±0.03 | 1.93 ± 0.13 | 1.83±0.14 | 1.80±0.14 | 1.77±0.16 |
| VCO2 (l/min)c | |||||
| MF | 0.21±0.03 | 1.87 ± 0.13 | 1.75±0.09 | 1.68±0.07 | 1.68±0.08 |
| OV | 0.20±0.01 | 1.75 ± 0.11 | 1.68±0.10 | 1.62±0.13 | 1.62±0.12 |
| ML | 0.29±0.05 | 1.86 ± 0.14 | 1.69±0.13 | 1.67±0.14 | 1.61±0.16 |
denotes mean ± SEM;
denotes BTPS;
denotes STPD
Table 2.
Changes in blood measuresa during the study
| Measure Phase | Time (min) | ||||
|---|---|---|---|---|---|
| Rest | 15 | 30 | 45 | 60 | |
| Hematocrit (%) | |||||
| MF | 39.7±0.7 | 43.1±1.0 | 43.1±1.1 | 42.5±1.0 | 42.2±1.0 |
| OV | 39.9±1.2 | 42.8±1.1 | 42.4±1.0 | 41.4±0.7 | 42.0±0.8 |
| ML | 39.8±1.0 | 43.3±0.9 | 44.1±0.8 | 44.1±0.7 | 43.0±0.8 |
| Hemoglobin (g/dl) | |||||
| MF | 14.1±0.4 | 14.8±0.6 | 15.3±0.6 | 15.0±0.5 | 15.1±0.8 |
| OV | 14.0±0.4 | 15.3±0.2 | 15.3±0.3 | 15.1±0.2 | 14.8±0.2 |
| ML | 13.7±0.4 | 15.5±0.7 | 15.7±0.6 | 15.3±0.7 | 15.3±0.8 |
| Glucose (mM) | |||||
| MF | 4.47±0.25 | 4.42±0.31 | 4.56±0.26 | 4.53±0.20 | 4.38±0.21 |
| OV | 4.81±0.16 | 4.42±0.23 | 4.37±0.10 | 4.13±0.25 | 4.45±0.17 |
| ML | 4.52±0.13 | 4.36±0.12 | 4.57±0.08 | 4.38±0.14 | 4.54±0.29 |
| pH | |||||
| MF | 7.32±0.01 | 7.35±0.01 | 7.35±0.01 | 7.38±0.01 | 7.39±0.10 |
| OV | 7.30±0.02 | 7.35±0.02 | 7.38±0.01 | 7.41±0.01 | 7.40±0.01 |
| ML | 7.30±0.02 | 7.34±0.02 | 7.36±0.02 | 7.37±0.02 | 7.37±0.02 |
denotes mean ± SEM
Fig. 1.
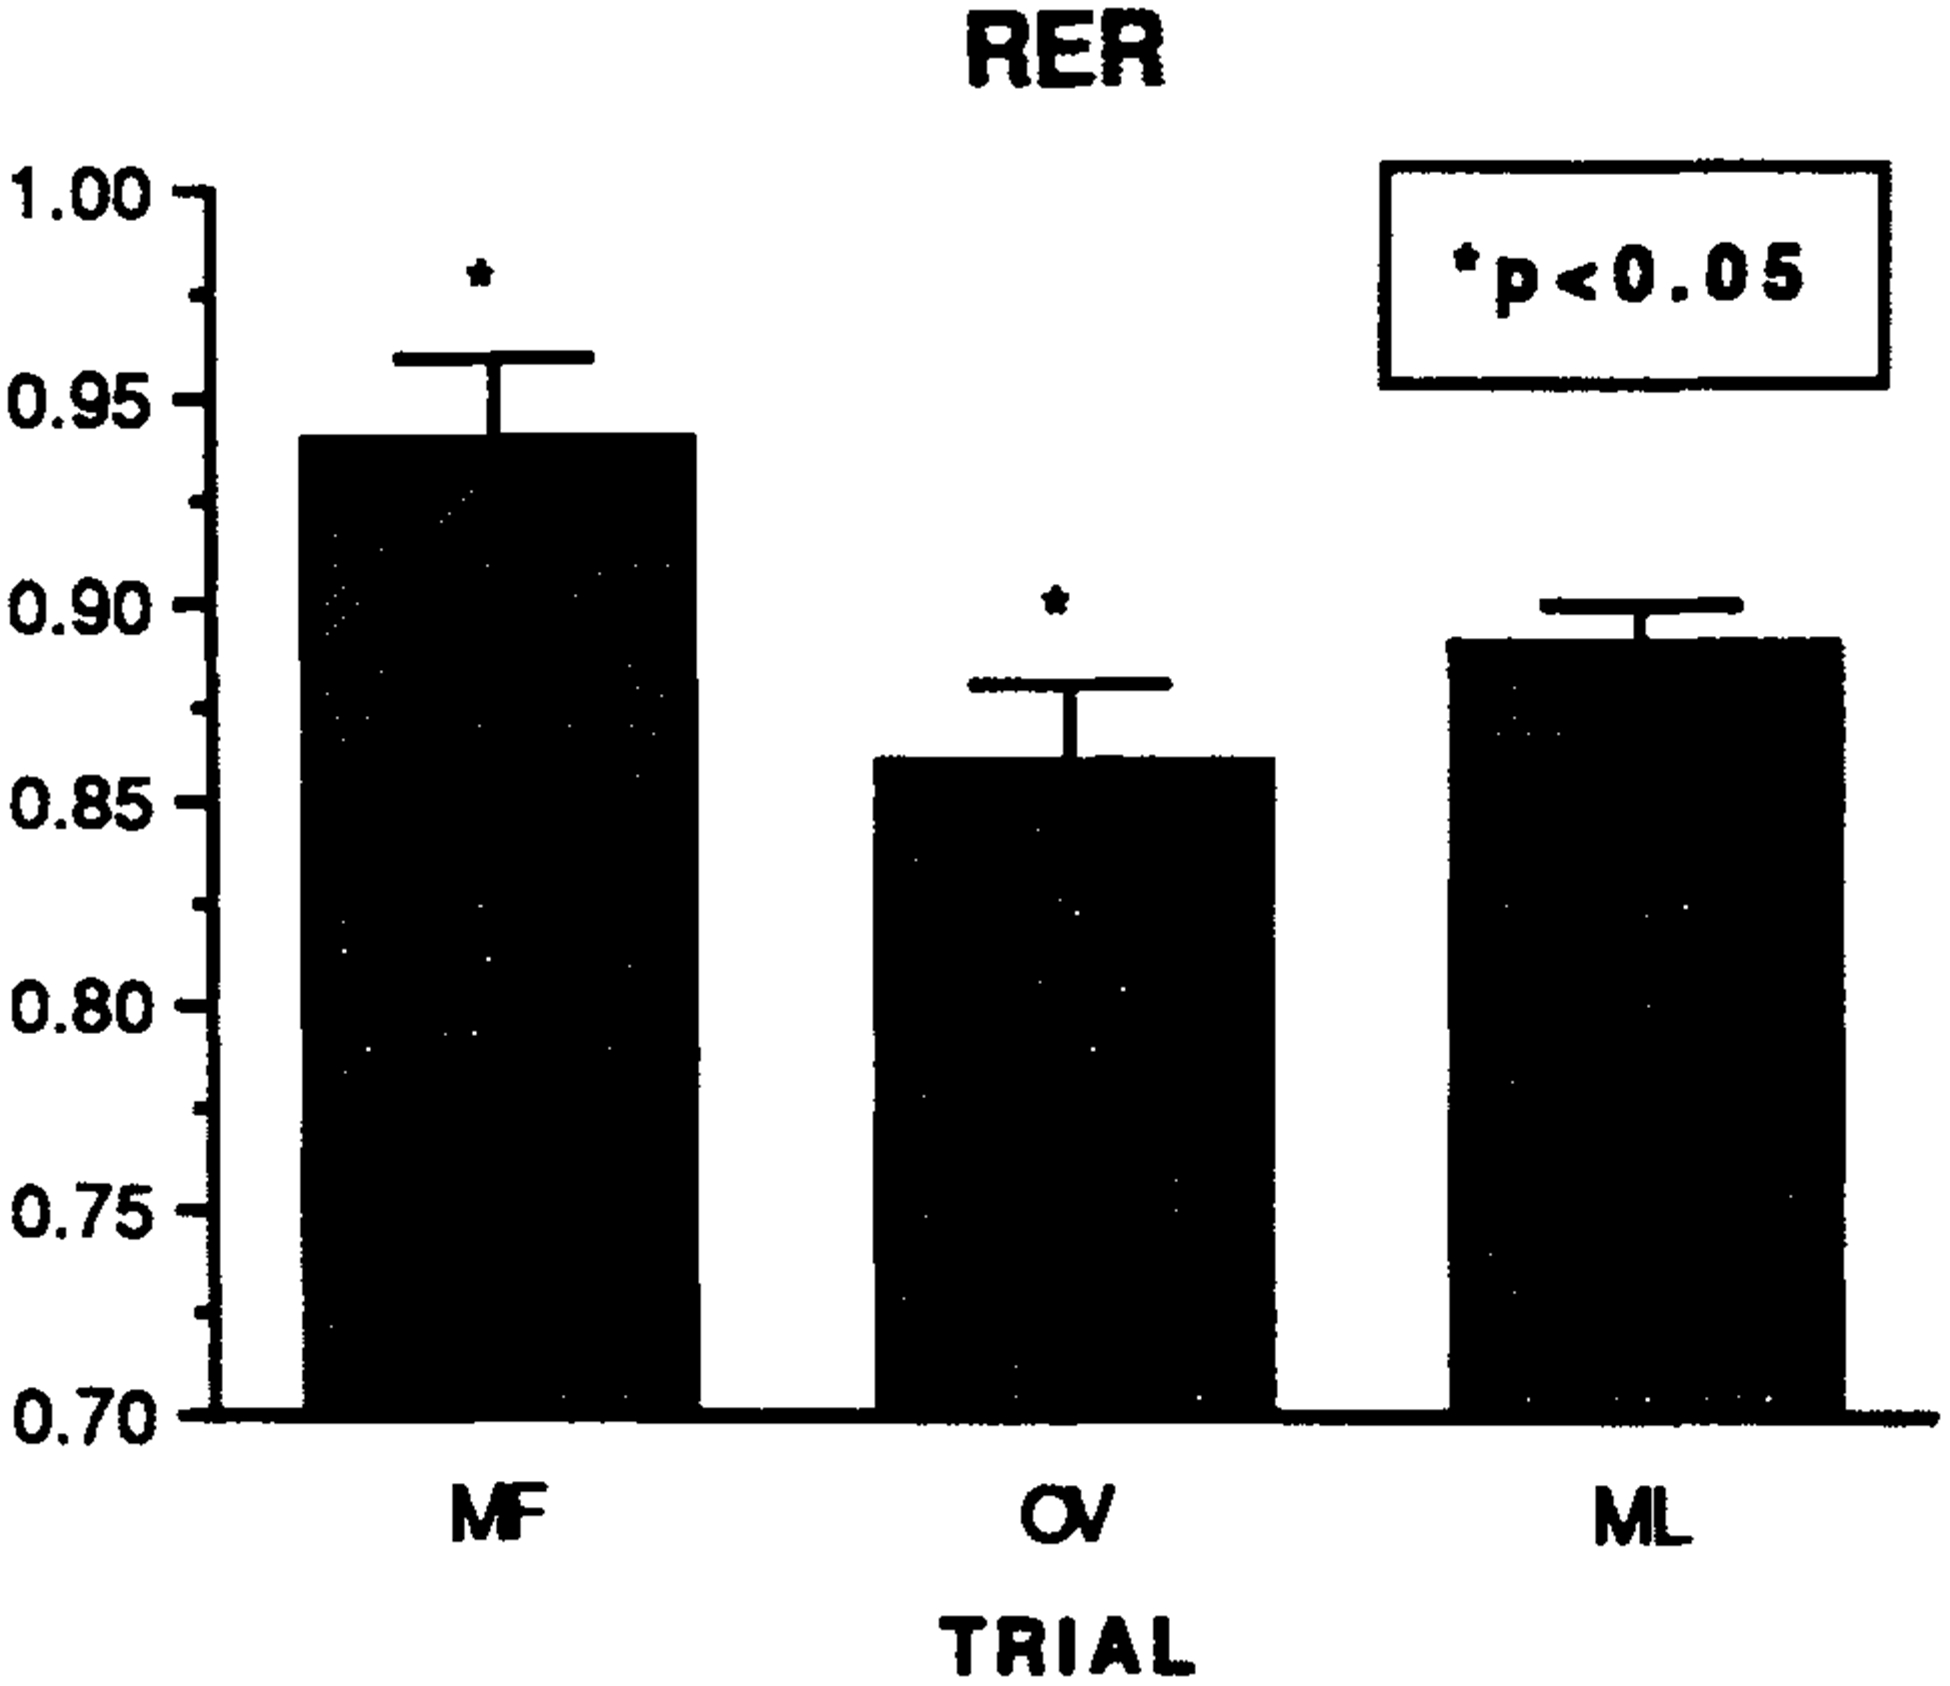
The overall respiratory exchange ratios (RER) measured during the mid-follicular (MF), ovulatory (OV) and mid-luteal (ML) exercise trials. P < 0.05, between-phase differences.
The overall caloric cost of the exercise did not differ significantly at any phase of the cycle (P > 0.05; MF = 9.18 ± 0.57, OV = 9.23 ± 0.60, and ML = 9.22 ± 0.63 kcal/min, respectively). However, the carbohydrate utilization (%) and oxidation (g/min) rates for the 60 min of exercise during the OV trial were significantly lower than during the MF trial (MF = 78.5 ± 5.9%, 1.77 ± 0.18 g/min; OV = 60.7 ± 6.2%, 1.40 ± 0.17 g/min and ML = 75.4 ± 10.0%, 1.75 ± 0.25 g/min). Conversely, fat utilization and oxidation (Fig. 2) were significantly greater during the OV trial than the MF trial. The carbohydrate-fat utilization and oxidation at ML did not differ from MF or OV.
Fig. 2.
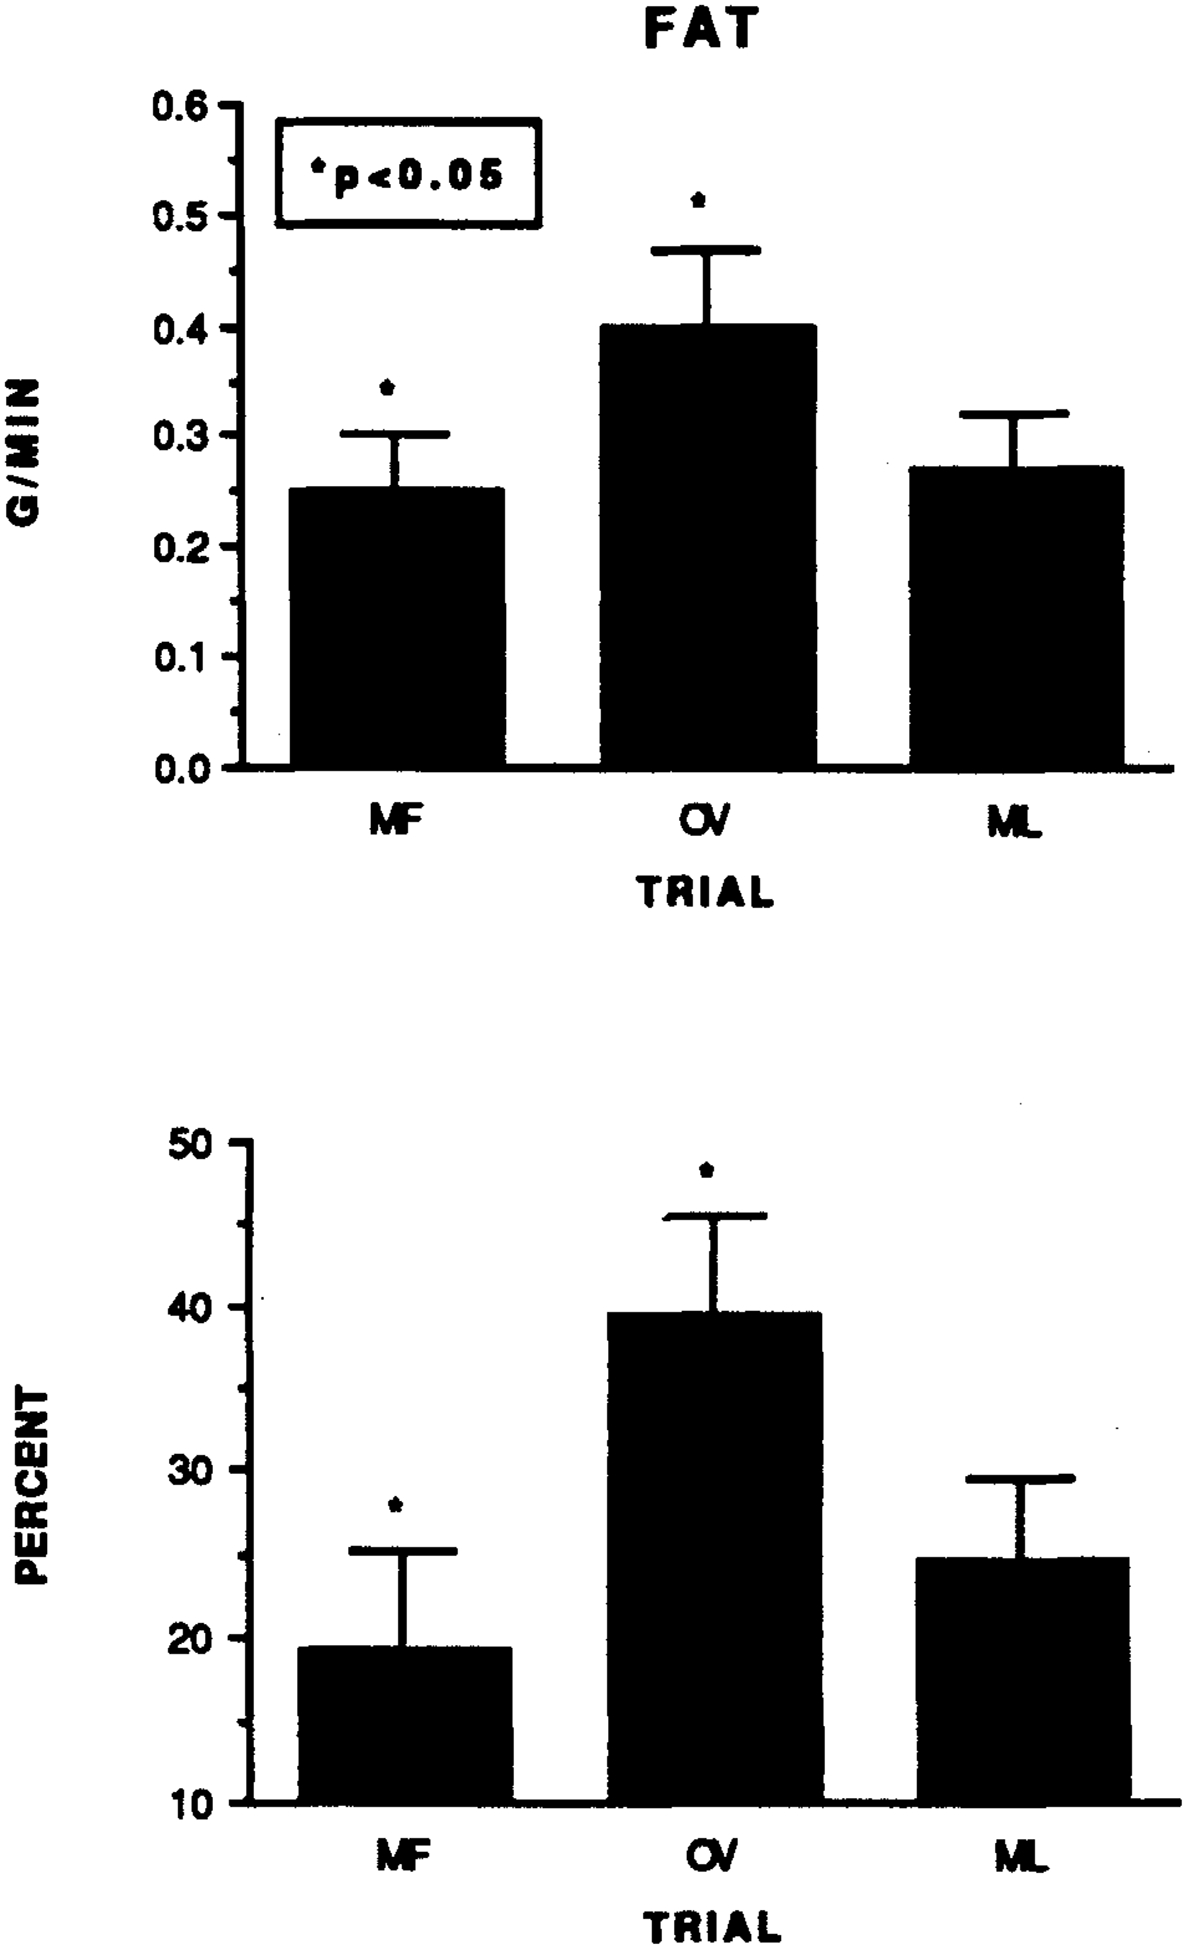
The fat oxidation (upper panel: g/min) and utilization (bottom panel: %) measured during the mid-follicular (MF), ovulatory (OV) and mid-luteal (ML) exercise trials. P < 0.05, between-phase differences.
There was a trend during exercise towards greater OV T-RPE responses (overall MF = 3.7 ± 0.6, OV = 4.6 ± 0.3 and ML = 3.5 ± 0.6: P = 0.12). The L-RPE responses during the final 30 min of exercise, however, were significant, with the OV responses being greater than during the MF or ML trials (Fig. 3).
Fig. 3.
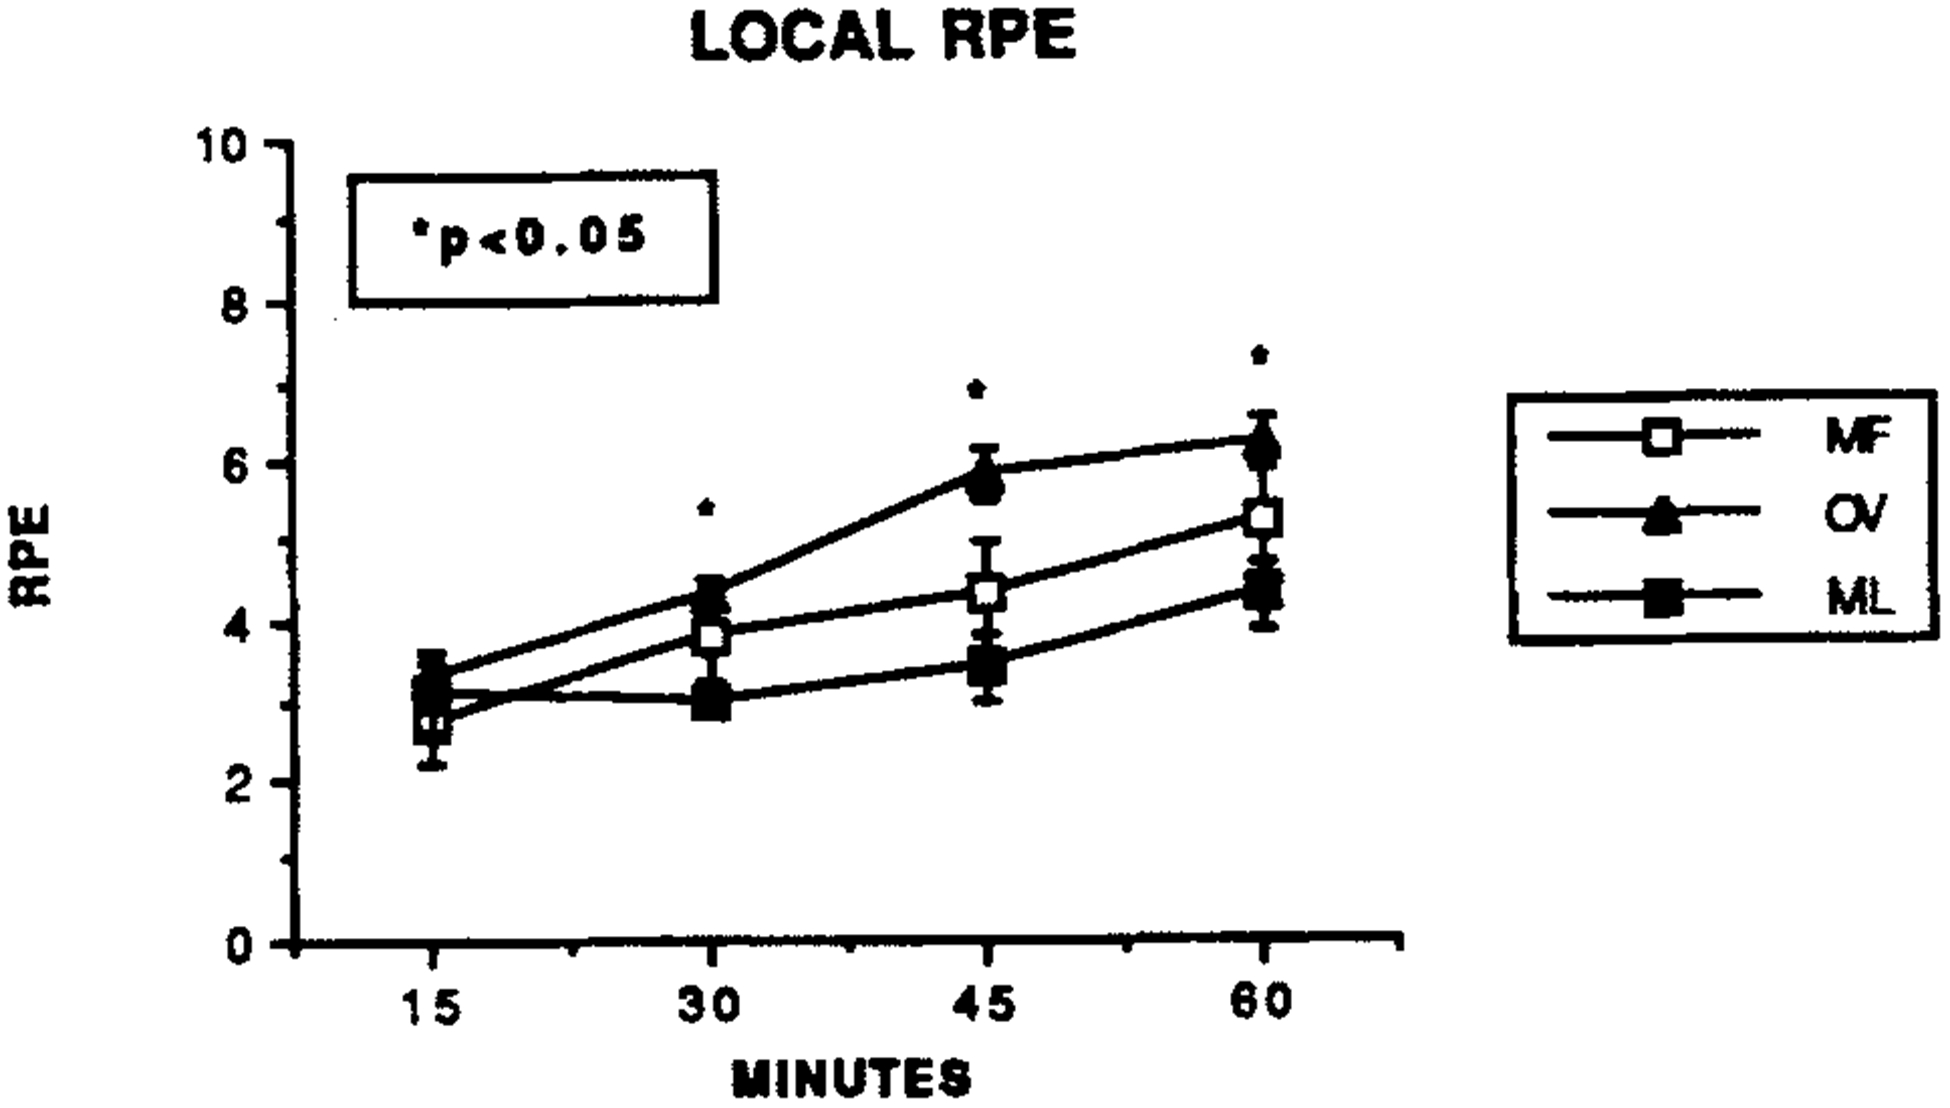
The local RPE changes (modified Borg scale [14]) during the mid-follicular (MF), ovulatory (OV) and mid-luteal (ML) exercise trials. P < 0.05, OV values significantly different from MF and ML values.
Discussion
The finding of no significant differences in the blood measures as well as the majority of the cardiorespiratory responses is in agreement with previous research examining submaximal exercise responses throughout the cycle (8,16,17). Nevertheless, the findings do disagree somewhat with studies that have examined maximal exercise responses. With maximal graded exercise, increased maximal VE and blood lactate responses have been noted in the luteal phase (12,18,19). Additionally, time to exhaustion at maximal effort appears longer during the luteal phase than the follicular phase (4,12,20). However, we measured submaximal responses, so direct comparison with the findings in these other studies is not entirely appropriate.
To our knowledge, the reduced RER found in the OV trial has not been previously reported. However, the tendency for the RER to be reduced in the luteal phase agrees with Dombovy et al. (8). The RER findings suggest that significantly more fat is metabolized during the OV phase than during the MF phase. This effect is most likely a function of the greatly elevated E2 levels that were found during the OV phase trial. Human studies as well as numerous animal studies have demonstrated that E2 has a direct and indirect (via growth hormone) lipolytic action on adipose tissue (5–7, 21). This state of enhanced fat metabolism during the OV trial may have resulted in a subsequent glucose- and glycogen-sparing effect during the exercise and thus produced the corresponding lower carbohydrate utilization and oxidation findings. Such a hypothesis would be in agreement with the known relationship of carbohydrate and lipid metabolism during exercise (1,18,22).
The L-RPE findings were unexpected and are somewhat at odds with published reports (8,10, 16,20,23). Gamberale et al. (10) and Higgs & Robertson (23) have reported that RPE ratings at maximal exercise are greater during the early follicular phase than luteal phase of the cycle. However, other investigators have reported no phase difference whatsoever in RPE ratings (8,16,20). This variance in the present findings with previous studies may be due to differences in experimental method and study design. Our study attempted to rigorously determine appropriate testing times (cycle phase) and control for confounding factors (such as oral contraceptive use, prior diet and physical activity and time of day for testing). Previous studies with differing results than ours were not as methodical in these aspects of their studies, thereby overshadowing the interpretation of their findings. Further, selection of the cycle day during which the experimental trials of these various studies took place (early-follicular vs mid-follicular vs late-follicular) has varied tremendously, thus making comparison with our study difficult.
Currently, we are uncertain as to the physiological basis of the greater RPE ratings during the latter part of the OV trial. However, Landesman et al. (24) have shown that increases in E2 cause an increased localized blood flow in tissues. This event occurs via an E2-mediated decreased norepinephrine vascular responsiveness in the tissue. We observed a reduction in the E2 levels during the OV exercise test. Therefore, the increased local RPE at OV may have been induced by a mild form of ischemia in the exercising tissue brought about by the reduction in E2 during the exercise. This hypothesis of menstrually induced altered blood flow does seem somewhat remote, but has been proposed by other investigators as a possible basis for alterations in physiological findings across the menstrual phases (12).
We realize that this study has limitations. Nevertheless, the findings do indicate that the endogenous E2 and P fluctuations in eumenorrheic women seem to influence metabolic substrate usage and effort perception during submaximal exercise. The significance of these findings relative to physical performance (i.e., athletic competition) remains to be determined. However, the increased ovulatory effort perception results have implications for the psychological preparation of eumenorrheic women who compete in endurance events (i.e., possible increased exercise discomfort at ovulation).
Acknowledgements
The authors wish to acknowledge the technical assistance of R. J. Ness, R. L. Sharp, J. M. Shaw and E. Floyd.
References
- 1.Bonen A, Ling WV, MacIntyre KP, Neil R, McGrail JC, Belcastro AN. Effects of exercise on the serum concentrations of FSH, LH, progesterone, and estradiol. Eur J Appl Physiol 1979: 42: 15–23. [DOI] [PubMed] [Google Scholar]
- 2.Hackney AC, Pearman SN, Nowacki JM. Physiological profiles of overtrained and stale athletes: a review. J Appl Sport Psychol 1990: 2: 21–33. [Google Scholar]
- 3.Jurkowski JE, Jones NL, Walker C, Younglai EV, Sutton JR. Ovarian hormonal responses to exercise. J Appl Physiol 1978: 44: 109–14. [DOI] [PubMed] [Google Scholar]
- 4.Nicklas BJ, Hackney AC, Sharp RL. The menstrual cycle and exercise: performance, muscle glycogen, and substrate responses. Int J Sports Med 1989. 29 264–9. [DOI] [PubMed] [Google Scholar]
- 5.Matute ML, Kalkhoff EK. Sex steroid influence on hepatic gluconeogenesis and glycogen formation. Endocrinology 1973: 92: 762–8. [DOI] [PubMed] [Google Scholar]
- 6.McKerns KW, Coulomb B, Kaleita E, DeRenza EC. Some effects of in vivo administered estrogens on glucose metabolism and adrenal cortical secretion in vivo. Endocrinology 1958: 63: 709–22. [DOI] [PubMed] [Google Scholar]
- 7.Sladek CD. Gluconeogenesis and hepatic glycogen formation in relation to the rat estrous cycle. Horm Metab Res 1974: 6: 217–21. [DOI] [PubMed] [Google Scholar]
- 8.Dombovy ML, Bonekat HW, Williams TJ, Staats BA. Exercise performance and ventilatory response in the menstrual cycle. Med Sci Sports Exerc 1987: 19: 111–7. [PubMed] [Google Scholar]
- 9.Doskin VA, Kozeeva TV, Listskaya TS, Shokina EV. Changes in working capacity of female athletes in different phases of the menstrual cycle. Hum Physiol 1980: 2:144–9. [PubMed] [Google Scholar]
- 10.Gamberale F, Strindberg L, Wahlberg I. Female work capacity during the menstrual cycle: physiological and psychological reactions. Scand J Work Environ Heath 1975:1: 120–7. [DOI] [PubMed] [Google Scholar]
- 11.Garlick MA, Bernauer EM. Exercise during the menstrual cycle: variations in physiological baselines. Res Q 1967:39: 533–42. [PubMed] [Google Scholar]
- 12.Jurkowski JE, Jones NL, Toews CJ, Sutton JR. Effects of menstrual cycle on blood lactate, O2 delivery, and performance during exercise. J Appl Physiol 1981: 51:1493–9. [DOI] [PubMed] [Google Scholar]
- 13.Thoden J, Wilson B, MacDougall J. Testing aerobic power In: MacDougall J, Wenger H, Green H, ed. Physiological testing of the elite athlete. Toronto: Mutual Press, 1982: 39–59. [Google Scholar]
- 14.Borg G, Ljunggren G, Ceci R. The increase of perceived exertion, aches, and pain in the legs, heart rate and blood lactate during exercise on a bicycle ergometer. Eur J Appl Physiol 1985: 54: 343–9. [DOI] [PubMed] [Google Scholar]
- 15.Winer BH. Statistical principles in experimental design. New York: McGraw-Hill, 1971. [Google Scholar]
- 16.Stephenson L, Kolka M, Wilkerson J. Perceived exertion and anaerobic threshold during the menstrual cycle. Med Sci Sports Exerc 1982: 14: 218–22. [PubMed] [Google Scholar]
- 17.Stephenson LA, Kolka MA, Wilkerson JE. Metabolic and thermoregulatory responses to exercise during the human menstrual cycle. Med Sci Sports Exec 1982: 14: 270–8. [DOI] [PubMed] [Google Scholar]
- 18.Lavoie M, Dionee N, Helie R, Brisson GR. Menstrual cycle phase dissociation of blood glucose homeostasis during exercise. J Appl Physiol 1987: 62: 1084–9. [DOI] [PubMed] [Google Scholar]
- 19.Schoene RB, Robertson HT, Person DJ, Peterson AP. Respiratory drives and exercise in menstrual cycles of athletic and nonathletic women. J Appl Physiol 1981: 50: 1300–5. [DOI] [PubMed] [Google Scholar]
- 20.Robertson LA , Higgs SL. Menstrual cycle variations in physical work capacity, post-exercise blood lactate, and perceived exertion. Can J Appl Sports Sci 1983: 8: 220. [Google Scholar]
- 21.Reinke U, Ansah B, Voigt KD. Effect of the menstrual cycle on carbohydrate and lipid metabolism in normal females. Acta Endocrinol 1972: 69: 762–8. [DOI] [PubMed] [Google Scholar]
- 22.Bonen A, Haynes FJ, Watson-Wright W et al. Effect of menstrual cycle on metabolic responses to exercise. J Appl Physiol 1983: 55: 1506–13. [DOI] [PubMed] [Google Scholar]
- 23.Higgs SL, Robertson LA. Cyclic variations in perceived exertion and physical work capacity in females. Can J Appl Sport Sci 1983: 6: 191–6. [PubMed] [Google Scholar]
- 24.Landesman R, Douglas RE, Dreidhpoon E, Hoke E. The vascular bed of the bulbar conjunctiva in the normal menstrual cycle. Am J Obstet Gynecol 1953: 66: 988–98. [DOI] [PubMed] [Google Scholar]