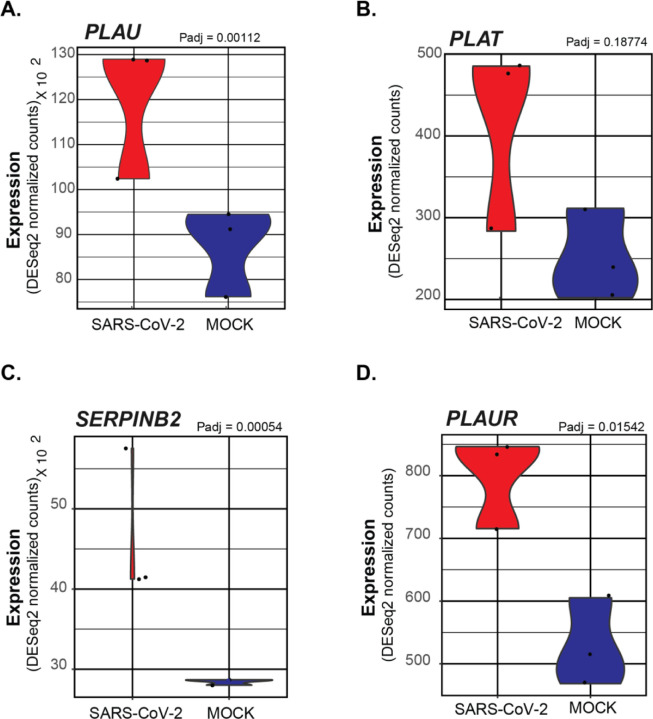
Figure 3: Violin plots depicting raw counts of reads mapping to regulators of the plasminogen activation system in mock infected and SARS-CoV-2 infected NHBE cells.
Raw counts were normalized to library size in the DESeq2 software package. Adjusted P values displayed for significant differences were also calculated within DESeq2. Images were generated using GGPlot2 in the R studio environment.

