
Figure 2. Differential expression analysis of mock treated versus SARS-CoV-2 infected primary human lung epithelial cells.
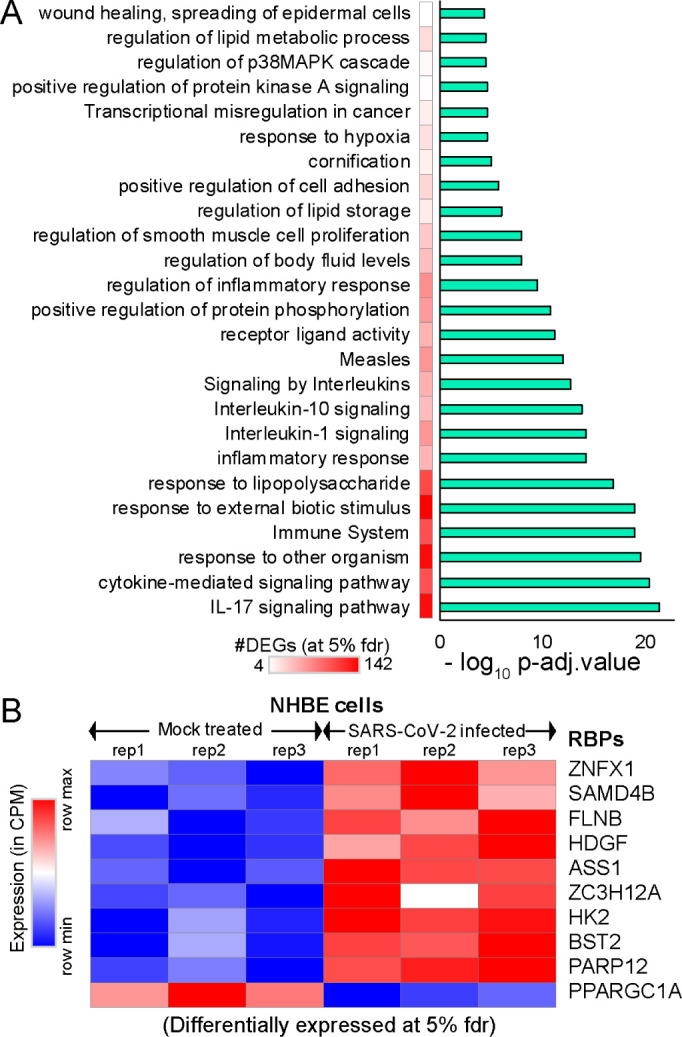
(A) Bar-plot illustrating the significant pathways obtained from GO-term based functional grouping of differentially expressed genes (DEGs) at 5% fdr using ClueGO analysis (Cytoscape plugin) (B) Row normalized expression profile of differentially expressed RBPs in mock treated and SARS-CoV-2 infected primary human lung epithelial cells (in biological triplicates).