

SUMMARY
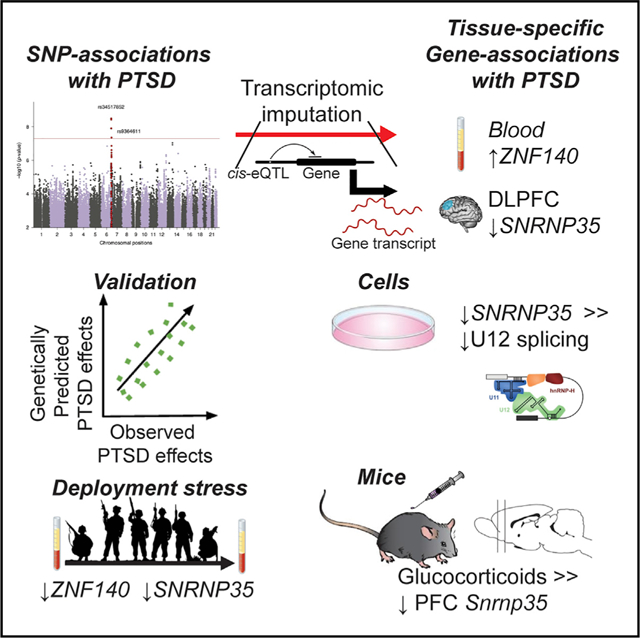
To reveal post-traumatic stress disorder (PTSD) genetic risk influences on tissue-specific gene expression, we use brain and non-brain transcriptomic imputation. We impute genetically regulated gene expression (GReX) in 29,539 PTSD cases and 166,145 controls from 70 ancestry-specific cohorts and identify 18 significant GReX-PTSD associations corresponding to specific tissue-gene pairs. The results suggest substantial genetic heterogeneity based on ancestry, cohort type (military versus civilian), and sex. Two study-wide significant PTSD associations are identified in European and military European cohorts; ZNF140 is predicted to be upregulated in whole blood, and SNRNP35 is predicted to be downregulated in dorsolateral prefrontal cortex, respectively. In peripheral leukocytes from 175 marines, the observed PTSD differential gene expression correlates with the predicted differences for these individuals, and deployment stress produces glucocorticoid-regulated expression changes that include downregulation of both ZNF140 and SNRNP35. SNRNP35 knockdown in cells validates its functional role in U12-intron splicing. Finally, exogenous glucocorticoids in mice downregulate prefrontal Snrnp35 expression.
Graphical Abstract
In Brief
Huckins et al. apply transcriptomic imputation to the PGC-PTSD GWAS to reveal tissue-gene associations. The results suggest substantial genetic heterogeneity based on ancestry, cohort type (military versus civilian), and sex. Results—especially the predicted downregulation of SNRNP35 in dorsolateral prefrontal cortex—are validated by findings in humans, cell culture, and mice.
INTRODUCTION
While trauma exposure is ubiquitous, particularly in veterans and high-risk civilian populations, a large proportion of individ uals do not experience post-traumatic stress disorder (PTSD) and remain resilient even after repeated, prolonged, or severe exposure to trauma (Bonanno, 2004; Kessler et al., 2005). Understanding which individuals may be susceptible or resilient to PTSD is vital in the development of effective interventions and treatments. Twin studies have repeatedly demonstrated that PTSD is heritable, with estimates in line with those for other disorders (Daskalakis et al., 2018b; Nievergelt et al., 2018). The recent Psychiatric Genomics Consortium for PTSD (PGC-PTSD) genome-wide association study (GWAS) estimated SNP-based heritability at 5%–20%, demonstrated genetic correlations with major depressive disorder and schizophrenia, and identified genetic variants or loci associated with PTSD susceptibility (Duncan et al., 2018; Nievergelt et al., 2019).
Despite the substantial success of GWAS in elucidating the genetic etiology of psychiatric disorders, resulting associations may be difficult to interpret biologically. At best, these studies result in large lists of associated loci, which require careful cu-ration to prioritize genes (Visscher et al., 2017). Studies of the transcriptome may yield more readily biologically interpretable results. However, progress is hampered by small sample sizes, due in part to the cost and inaccessibility of the primary tissue of interest (i.e., brain). Transcriptomic imputation (TI) approaches leverage large reference transcriptome datasets to codify relationships between genotypes and gene expression and create genetically regulated gene expression (GReX) models (Gamazon et al., 2015; Gusev et al., 2016). TI algorithms allow us to identify genes with predicted disease-associated GReX in specific tissue and to probe gene expression in large sample sizes, yielding sufficient power to detect genes with small effect sizes (Gamazon et al., 2015), which represent a substantial proportion of the risk for complex diseases (Fromer et al., 2016).
PTSD development, symptom trajectories, and severity differ according to index trauma type (Graham et al., 2016; Jakob et al., 2017; Kessler et al., 2005; Prescott, 2012). For example, PTSD prevalence differs significantly between rape survivors (45%) and combat veterans (30%) and following natural disasters (4%) (Kessler et al., 2005, 2017; Yehuda et al., 2015). While the differential prevalence, symptoms, and outcomes have been characterized in depth, trauma-type-specific genetic underpinnings of PTSD are unknown. The present study includes large collections of both military (M-PTSD) and civilian (C-PTSD) PTSD cohorts. Although military and civilian designations serve as an imperfect proxy for trauma type (either group may experience a range of trauma types), and groups are differentiated by numerous factors, these cohorts provide a powerful opportunity to probe differential genetic etiologies.
In this study, we tested GReX associations with case-control status for PTSD across 195,684 individuals (29,539 cases/166,145 controls; Table S1A) from the largest multi-cohort of the PGC-PTSD GWAS (Nievergelt et al., 2019) using an S-PrediXcan-based (Barbeira et al., 2018) meta-analysis framework. We analyzed all subjects together and conducted stratified analyses based on ancestry, cohort type (military versus civilian), sex, and their combination. Since PTSD development involves multi-systemic dysregulation (Daskalakis et al., 2018a; Sareen, 2014; Zoladz and Diamond, 2013), we used GReX models from 11 brain regions and 11 non-brain tissues.
RESULTS
GReX Is Associated with PTSD
No genes reached study-wide or within-tissue significance (p = 2.36e–7 and 5.24e–6, respectively; Table S1B) in our overall transethnic meta-analyses, including African ancestry (AA), European ancestry (EA), and Latino ancestry (LA). In our EA-specific meta-analysis (Figure 1A), whole-blood ZNF140 (Zinc-Finger Protein 140) reached study-wide significance (Table 1; Figure S1A), while whole-blood PVRL1 and brain-cortex ARFGEF2 reached within-tissue significance (Table 1). In our LA-specific meta-analysis (1,981 cases/3,722 controls), 4 genes reached within-tissue significance: cerebellum DHRS13, anterior cingulate cortex (ACC) Brodmann area (BA) 24 CEBPB, tibial artery ZNF554, and dorsolateral prefrontal cortex (DLPFC) BA9 KCNA4 (Table 1).
Figure 1. Gene-by-Tissue Associations with PTSD in EA.
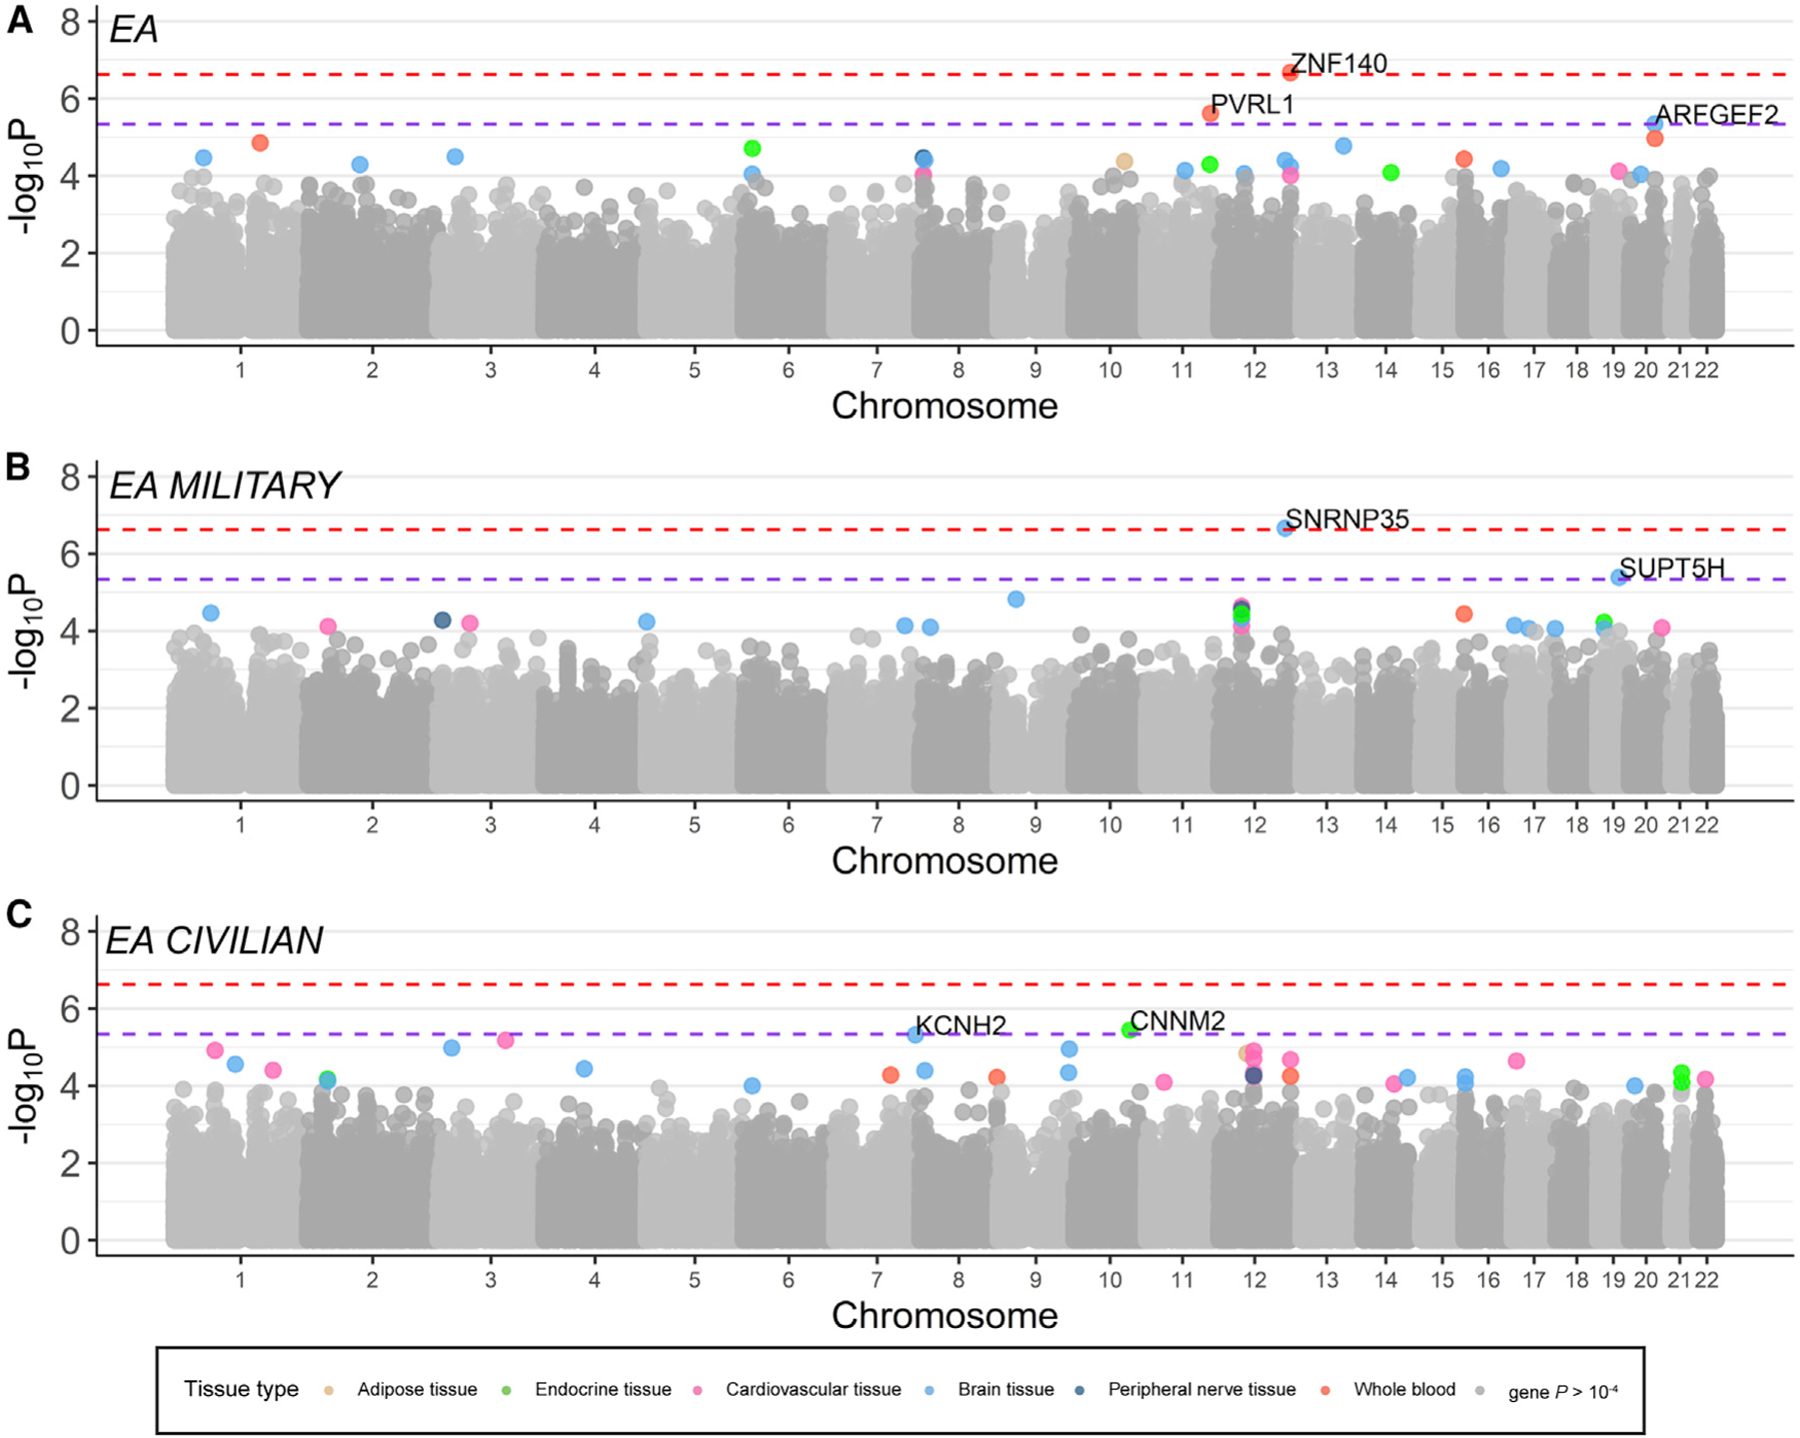
(A–C) Manhattan plots showing the −log10 of the p value of association of the genes-by-tissue in each chomosome with PTSD. In (A), one association reached study-wide significance (depicted by red discontinuous line) in our overall EA meta-analysis (23,195 cases/151,447 controls), and two genes reached within-tissue significance (depicted by purple discontinuous line). In (B), one gene reached study-wide significance in the military-only EA meta-analysis (6,004 cases/21,534 controls), and one reached within-tissue significance, while (C) two genes reached within-tissue significance in the civilian-only EA meta-analysis (16,959 cases/129,607 controls). Gene-tissue pairs with p  10–4 are color coded according to tissue type.
Table 1.
Study-wide and Tissue-wide Significant GReX Associations with PTSD
| Ancestry | Cohort Type | % Female | Tissue | Gene Symbol | Z score | p Value | Cases | % Cases | Controls | Total | Sex-Specific Significant Result |
|---|---|---|---|---|---|---|---|---|---|---|---|
| EAa | all | 50.3 | whole blood | ZNF140 | 5.19 | 2.11e–07 | 23,195 | 13.3 | 151,447 | 174,642 | males: Z = 4.60, p = 4.21e–06 |
| EAa | military | 6.9 | brain frontal cortex (BA9 region) | SNRNP35 | −5.18 | 2.19e–07 | 6,004 | 21.8 | 21,534 | 27,538 | males: Z = −4.55, p = 5.44e–06 |
| Transethnic | civilian | 59.6 | brain putamen (basal ganglia) | FBXO48 | −4.99 | 5.89e–07 | 21,163 | 13.3 | 138,476 | 159,639 | |
| Transethnic | civilian | 59.6 | brain cerebellar hemisphere | BCL2L15 | −4.80 | 1.52e–06 | 21,163 | 13.3 | 138,476 | 159,639 | |
| Transethnic | civilian | 59.6 | brain hypothalamus | OXSM | 4.79 | 1.64e–06 | 21,163 | 13.3 | 138,476 | 159,639 | |
| LA | all | 56.1 | brain cerebellum | DHRS13 | −4.78 | 1.74e–06 | 1,981 | 34.7 | 3,722 | 5,703 | |
| EA | all | 50.3 | whole blood | PVRL1 | 4.72 | 2.41e–06 | 23,195 | 13.3 | 151,447 | 174,642 | |
| AA | civilian | 65.3 | artery aorta | SLC30A3 | −4.69 | 2.73e–06 | 2,696 | 26.9 | 7,343 | 10,039 | |
| Transethnic | military | 8.2 | thyroid | GXYLT1 | −4.68 | 2.92e–06 | 8,004 | 22.7 | 27,297 | 35,301 | |
| LA | all | 56.1 | brain anterior cingulate cortex (BA24 region) | CEBPB | 4.64 | 3.53e–06 | 1,981 | 34.7 | 3,722 | 5,703 | |
| EA | civilian | 58.4 | pituitary | CNNM2 | −4.63 | 3.59e–06 | 16,959 | 11.6 | 129,607 | 146,566 | |
| All | military | 8.2 | brain nucleus accumbens (basal ganglia) | PODXL | −4.63 | 3.61e–06 | 8,004 | 22.7 | 27,297 | 35,301 | |
| LA | all | 56.1 | artery tibial | ZNF554 | −4.62 | 3.85e–06 | 1,981 | 34.7 | 3,722 | 5,703 | |
| EA | military | 6.9 | brain anterior cingulate cortex (BA24 region) | SUPT5H | 4.60 | 4.11e–06 | 6,004 | 21.8 | 21,534 | 27,538 | |
| LA | all | 56.1 | brain frontal cortex (BA9 region) | KCNA4 | 4.59 | 4.46e–06 | 1,981 | 34.7 | 3,722 | 5,703 | |
| Transethnic | military | 8.2 | artery aorta | GXYLT1 | −4.58 | 4.49e–06 | 8,004 | 22.7 | 27,297 | 35,301 | males: Z = −4.85, p = 1.19e–06 |
| EA | all | 56.7 | brain cortex | ARFGEF2 | −4.58 | 4.51e–06 | 23,195 | 13.3 | 151,447 | 174,642 | |
| EA | civilian | 58.4 | brain frontal cortex (BA9 region) | KCNH2 | 4.58 | 4.73e–06 | 16,959 | 11.6 | 129,607 | 146,566 | females: Z = 4.76, p = 1.92e–06 |
All genes have association with PTSD atwithin-tissue significance. The Z score corresponds to the effect of differences in genetically regulated gene expression (GReX) in cases versus controls. EA, European ancestry; LA, Latino ancestry; AA, African ancestry. See also Table S1.
Data in this row indicate a gene that has association with PTSD at study-wide significance level.
GReX Associations Differ between M-PTSD and C-PTSD Cohorts
We hypothesized that the genetic architecture of PTSD may differ according to trauma type. Our M-PTSD meta-analysis (8,004 cases/27,297 controls) identified three genes reaching within-tissue significance: thyroid GXYLT1, nucleus accumbens PODXL, and aorta GXYLT1 (Table 1). When restricting our analysis to only military cohorts of EA descent (Figure 1B), BA9 SNRNP35 (Small Nuclear Ribonucleoprotein U11/U12 Subunit 35), reached study-wide significance (p = 2.19e–7), while ACC SUPT5H reached within-tissue significance (Table 1; Figure S1B).
We did not identify genes reaching study-wide significance in our C-PTSD transethnic analysis (21,163 cases/138,476 controls), although three genes reached within-tissue significance: putamen FBXO48, cerebellar hemisphere BCL2L15, and hypothalamus OXSM (Table 1). Additionally, our C-PTSD analyses identified one AA-specific gene (Aorta SLC30A3; Table 1) and two EA-specific genes (pituitary CNNM2 and BA9 KCNH2; Figure 1C; Table 1). Notably, genes reaching study-wide significance in our M-PTSD analyses do not approach significance in our C-PTSD analyses; associations seem to be cohort-type specific (Figures 1B and 1C).
Trauma-Type-Specific Associations Are Not Driven by Sex Differences
It is possible that the different association patterns in M-PTSD and C-PTSD cohorts are confounded by sex (M-PTSD contains >90% males); if so, we should see more similar association statistics when comparing within-sex results to within-cohort results. To test this, we assessed the enrichment of shared nominally significant associations, and correlation of summary statistics, across four analyses—male C-PTSD, female C-PTSD, male M-PTSD, and female M-PTSD—for all 22 tissues. We saw significant correlations of association statistics between male and female C-PTSD analyses (Z scores, r > 0.169, p = 1.41e–58), as well as significant enrichment of nominally significant male C-PTSD associations in female C-PTSD associations, and vice versa (binomial tests, p < 0.049). We did not see significant correlations, or enrichment of nominally significant associations, within sex or between male and female M-PTSD analyses (Table S2). Together, these analyses do not support sex confounding our cohort-type-specific signal. Finally, some genes with significant effects in the cross-sex meta-analyses (aorta GXYLT1, BA9 KCNH2, BA9 SNRNP35, and whole-blood ZNF140) reached within-tissue significance in one of the sex-specific meta-analyses (Table 1).
GReX Associations with PTSD Are Enriched for Biological Pathways
We performed MAGMA pathway analysis in our overall, C-PTSD and M-PTSD transethnic meta-analyses. For each analysis, we tested for enrichment of genes identified in previous PTSD literature (Tables S3A and S3B), 186 hypothesis-driven gene sets and ~8,500 publicly available (“agnostic”) gene sets (STAR Methods). Literature-derived PTSD candidate genes were significantly enriched in the overall (p = 0.013) and C-PTSD analyses (p = 0.017), but not the M-PTSD analysis (Table S3C); top genes included DRD3 (C-PTSD, p = 4.73e–3), SGK1 (overall, p = 6.91e–3), and SLC18A2 (C-PTSD, p = 7.18e–3).
Four hypothesis-driven gene sets were significantly enriched in the overall analysis (Table S3C): genes related to post-synaptic density 95 protein (PSD-95; p = 8.2e–5) and genes with loss-of-function mutations implicated in intellectual disability (p = 1.2e–4). Our agnostic analysis identified 56 significantly enriched gene sets, including thyroid hormone receptor binding (p = 3.51e–9) and multiple olfactory pathways (p < 6.71e–7). We identified 10 significantly enriched gene sets in our C-PTSD analysis (Table S3C), including, from our hypothesis-driven gene sets, voltage-gated calcium channel: cytoskeleton (p = 3.27e–6) and genes highly intolerant to loss-of-function mutations (p = 4.8e–4), and, from our agnostic gene sets, olfactory transduction (p = 6.89e–6) and methylation (p = 1.12e–5).
Finally, we identified 17 gene sets significantly enriched in the M-PTSD analysis (Table S3C). Only one from the hypothesis-driven gene sets was significantly enriched; genes highly intolerant to loss-of-function mutations (p = 1.5e–4). Significantly en riched agnostic gene sets included porphyrin and chlorophyll metabolism (p = 8.29e–8) and pathways related to RNA and mRNA stabilization (p < 3.71e–5) and olfactory signaling (p = 6.34e–5).
Predicted PTSD GReX Differences Are Concordant with the Observed PTSD Gene Expression Differences
175 PGC-PTSD samples had available observed peripheral leukocyte transcriptome data, generated as part of the Marine Resiliency Study (MRS; STAR Methods). Clinical interviews and peripheral blood samples were collected 1 month pre-deployment and 3-months post-deployment. We performed a differential expression analysis and identified 280 genes nominally associated with future development of PTSD at pre-deployment and 160 genes at post-deployment (Table S4A; observed gene expression analysis workflow in Figure S6).
In parallel, we carried out differential expression analysis on all tissue-specific GReX in these same samples using a matching strategy (Tables S4B and S4C) and compared fold change (FC) statistics. Observed and whole-blood GReX FCs were significantly correlated at both pre-deployment (r = 0.179, p < 4.13e–46, df = 6,250; Table S4D1) and post-deployment (r = 0.208, p < 7.5e–62, df = 6,250; Table S4D2). The strength of these correlations was influenced by (1) the extent that gene expression is genetically predicted both at pre-deployment (for genes with R2 R median: r = 0.242, p < 3.37e–42, df = 3,124) and at post-deployment (r = 0.323, p < 2.31e–75, df = 3124) and (2) the strength of the PTSD effect in GReX (for genes with PTSD: p G 0.05 at pre-deployment in Figure 2A and post-deployment time points in Figure 2B). We saw strongest concordance between observed and predicted PTSD effects in whole-blood GReX, compared to GReX of all other tissues, validating the tissue specificity of our TI approach (Figures 2C and 2D; Table S4D1 and S4D2).
Figure 2. PTSD GReX Differences Are Concordant with the Observed Blood PTSD Gene Expression Differences in U.S. Marines.

(A and B) Correlation between PTSD (versus controls) log2 of fold change (FC) of observed peripheral leukocyte gene expression (x axis) measured at pre- (A) and post-deployment (B) and whole-blood GReX (y axis).
(C and D) Coefficients of correlation between log2FCs of peripheral leukocyte gene expression and GReX across multiple tissues (x axis) and level of correspondent significance (−log10 of p value in y axis) at pre- (C) and post-deployment (D); data points are color coded according to tissue type.
(E and F) Gene expression changes in U.S. Marines following deployment. Correlation between log2FCs based on in vivo DEX stimulation (x axis) (Arloth et al., 2015) and deployment stress (y axis) in PTSD subjects (E) and in control subjects (F). Red data points in (E) and (F) depict significant upregulation by deployment stress at FDR-significance threshold, while the blue data points depict significant downregulation by deployment stress at FDR-significance threshold.
(G and H) The GSEAs of the gene set of downregulated genes by DEX (Arloth et al., 2015) in the pre- to post-deployment expression changes in PTSD subjects (G) and in control subjects (H). The y axis represents enrichment score (ES), and on the x axis are genes (vertical black lines) represented in the gene set. ES is the maximum deviation from zero as calculated for each gene going down the ranked list and represents the degree of over-representation of a gene set at the top or the bottom of the ranked gene list (boxplot) based on deployment-stress effects.
Gene Expression Changes following Deployment
When we compared baseline to post-deployment peripheral leukocyte gene expression, separately for PTSD cases and control samples, we identified 1,335 genes with FDR (false discovery rate)-significant longitudinal changes in expression in PTSD cases and 1,161 genes in control samples (Table S4E). ZNF140 and SNRNP35 (study-wide PTSD-GReX associations are in Table 1), were downregulated in response to deployment stress both in PTSD cases (FC = −0.127, p = 0.0011; and FC = 0.137, p = 5.06e–6, respectively) and in control subjects (FC = −0.140, p = 9.21e–6; and FC = 0.086, p = 0.0025, respectively). Genes that are less genetically regulated (i.e., with lower TI model R2) were more impacted (i.e., lower p values) by deployment stress: in PTSD subjects, Welch’s t(6287) = −3.75, p = 1.74e–4; and in control subjects, t(6287) = 5.01, p = 5.32e–7. Similarly, genes with FDR-significant effects by deployment stress had lower R2 than non-FDR significant genes: in PTSD subjects: t(2914) = −7.64, p = 2.75e–14; and in control subjects, t(2547) = −8.92, p < 2.2e–16.
Glucocorticoids, the prominent mediators of the long-term effects of stress, have transcriptional effects by activating the glucocorticoid receptor (GR) (Daskalakis et al., 2018a). We tested whether deployment stress effects on gene expression are related to changes induced by dexamethasone (DEX), a potent GR agonist. We estimated the correlation and gene set enrichment of deployment-stress-induced changes in PTSD and control subjects with (1) PBMC (peripheral blood mononuclear cell) gene expression changes from PTSD and control subjects in vitro stimulated by DEX (Breen et al., 2019) and (2) whole-blood gene expression changes after in vivo DEX stimulation (Arloth et al., 2015). Deployment stress effects strongly correlated with in vitro DEX-induced changes, and PTSD subjects showed stronger correlations compared to control subjects (Figures S2 and S3, respectively), especially in the high-DEX doses. The correlation with in vivo DEX-induced changes was strong in both groups (Figures 2E and 2F). Gene set enrichment analysis (GSEA) confirmed these relationships, indicating a strong overlap between deployment stress effects and GR regulation, with several of these gene sets showing significant enrichment over background, especially in PTSD subjects (Figures 2G and S4 for PTSD subjects; Figures 2H and S5 for controls).
SNRNP35 Is Part of RNA-Processing Gene Networks in DLPFC
Our results indicate a potential role of SNRNP35 in the DLPFC BA9 region. Co-expression network analysis of 279 healthy DLPFC RNA-seq samples revealed that SNRNP35 is part of a 152-gene co-expression module (Table S5A), enriched for RNA binding and processing functions, highlighting module functional specificity related to the mRNA metabolic process (adjusted p [adj. p] = 1.33e–16), RNA binding (adj. p = 1.95e–13), and spliceosomal complex (adj. p = 5.65e–13; Table S5B).
SNRNP35 Knockdown Reduces U12 Splicing
SNRNP35 protein is a subunit of the minor spliceosome, which catalyzes the removal/splicing of an atypical class of introns—U12 type (0.5% of all introns), from messenger RNAs (mRNAs) (Turunen et al., 2013). We tested whether SNRNP35 downregulation is sufficient to cause a functional impact on U12 splicing in cell-culture experiments. Using small hairpin RNAs (shRNAs), we specifically showed that knocking down all the protein-coding isoforms of SNRNP35 mRNA in HEK cells (Figure 3A) reduced the U12 splicing of a target mRNA, CHD1L (Niemelä et al., 2014) (Figure 3B).
Figure 3. SNRNP35 Validation Experiments.
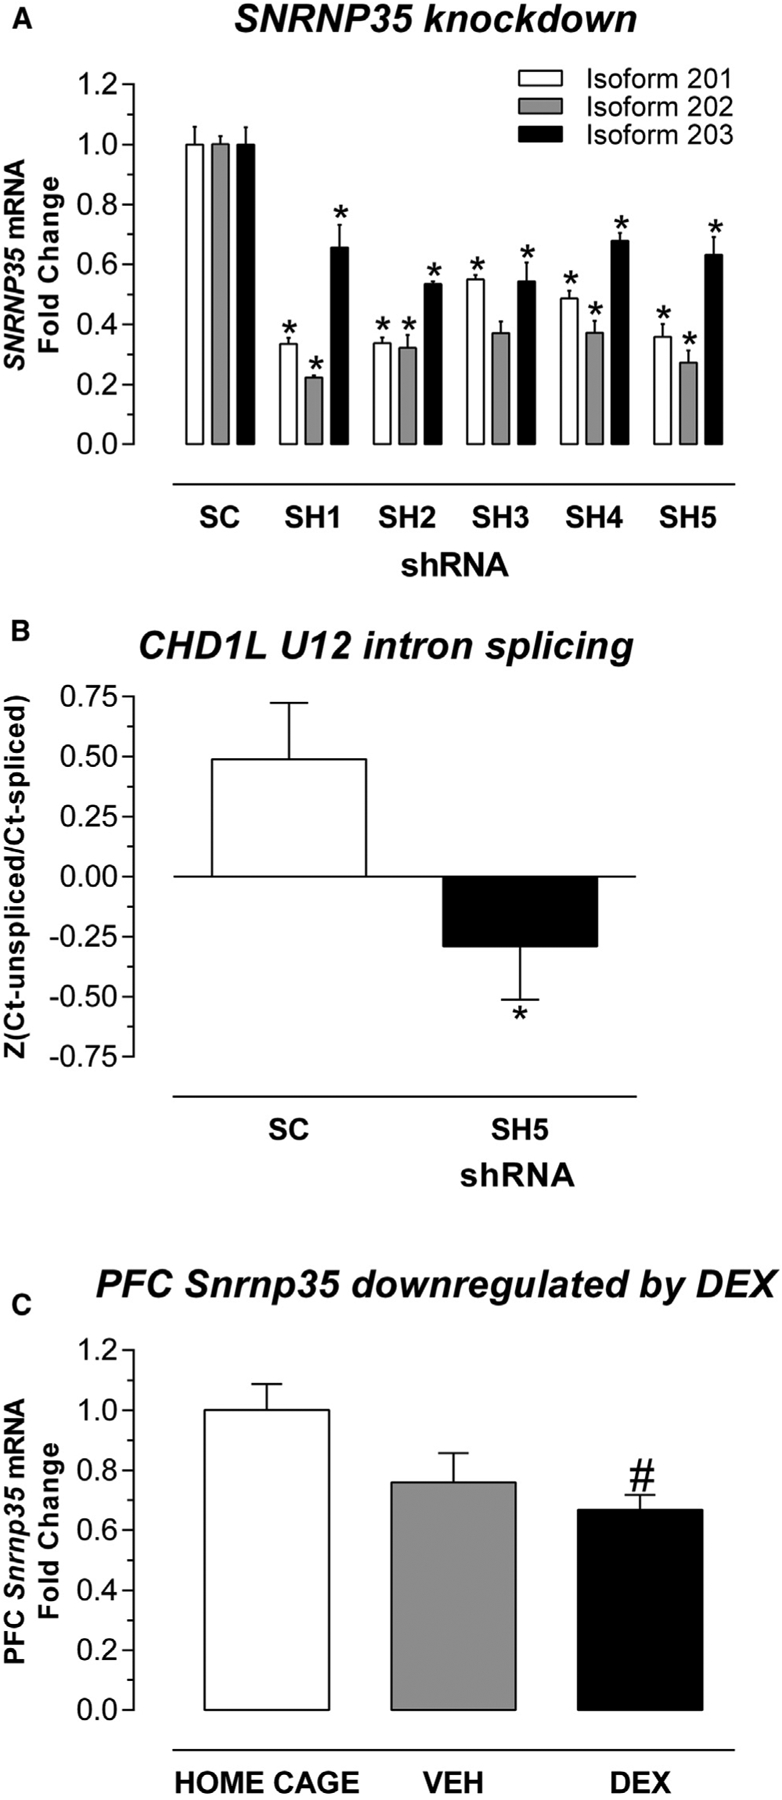
(A) SNRNP35 knockdown in human cells. In HEK cells, the five shRNAs (SH1, SH2, SH3, SH4, and SH5) significantly downregulated all the three protein-coding SNRNP35 RNA isoforms compared to scrambled (SC) RNA: for isoform 201 (hg38), p = 4.68e–5, 4.71e–5, 3.67e–4, 2.36e–4, and 1.29e–4, respectively; for isoform 202 (hg38), p = 1.61e–7, 1.2e–5, 1.11e–5, 1.23e–5, and 5.47e–6, respectively; for isoform p = 203 (hg38), p = 0.0106, 1.72e–4, 1.61e–3, 1.91e–3, and 4.03e–3), respectively. Data are represented as mean fold change (FC) ± standard error of mean (SEM). Asterisk indicates significant difference (p < 0.05) between shRNA and SC.
(B) SNRNP35 knockdown affected U12 of CHD1L target RNA. The repeated-measures ANOVA with technical replicate as within-subject factor and knockdown status as the between-subjects factor revealed an effect of knockdown status on U12 splicing, F(1, 17) = 5.779; p = 0.0279. Data are represented as mean (standardized ratio of unspliced Ct values over spliced Ct values) ± SEM. Asterisk indicates significant difference (p < 0.05) between shRNA-SH5 and SC.
(C) SNRNP35 downregulation by stress hormones. In mice, dexamethasone (DEX) intraperitoneal (i.p.) injection (10 mg/kg) downregulated prefrontal cortex (PFC) Snrnp35: Kruskal-Wallis H(2, 21) = 6.75, p = 0.0280; DEX versus HOME CAGE, adj. p = 0.0303. Data are represented as mean FC ± SEM. Pound sign indicates significant difference (p < 0.05) between DEX and HOME CAGE.
SNRNP35 Is Downregulated in Mouse Prefrontal Cortex by Stress Hormones
Given the effect of deployment stress on blood-based SNRNP35 expression in the MRS study, we hypothesized that stress may also affect prefrontal cortex (PFC) SNRNP35 expression. Stress hormones modulate gene expression through binding to GR and subsequent binding to glucocorticoid-binding sequences (GBSs). The mouse Snrnp35 gene contains many GBSs: 15 sites out of a total of 196 transcription factor binding sites in the entire mouse gene (Gene Transcription Regulation Database: http://gtrd.biouml.org/; Table S6). To examine the effect of stress-related GR activation on SNRNP35 expression in a model system, we injected mice with 10 mg/kg DEX and observed significant Snrnp35 downregulation in the PFC 4 h later (adj. p = 0.0303), confirming regulation of Snrnp35 by stress hormones in the mouse brain (Figure 3C; site of PFC micropunches in Figure S7). The direction of glucocorticoid-regulation PFC Snrnp35 expression is consistent with the lower levels of SNRNP35 in PTSD cases in the GReX analysis and at post-deployment in the MRS study.
DISCUSSION
We applied a TI-based method (i.e., S-PrediXcan) to the multi-cohort PGC-PTSD GWAS and discovered two putative PTSD susceptibility genes, prefrontal SNRNP35 and blood ZNF140. SNRNP35 is a U11/12 minor spliceosome subunit involved in the splicing of U12-type introns. SNRNP35 mRNA is predicted to be downregulated in DLPFC in PTSD, a brain region of interest, as it is involved in many stress-related neurobiological systems and processes (Averill et al., 2017; Nemeroff et al., 2006). Functional alterations in DLPFC have been described in PTSD, contributing to dysregulated circuit transmission and hypothalamus-pituitary-adrenal (HPA) axis function (Averill et al., 2017; Nemeroff et al., 2006). ZNF140 is a nucleus-based zinc-finger protein with DNA-binding transcription repressor activity in immune cells (Nishimura et al., 2001). Interestingly, most blood gene expression studies in PTSD identified immune dysregulations, often glucocorticoid regulated (Breen et al., 2018; Girgenti and Duman, 2018).
In our overall PTSD pathway analysis, the enrichment of the PSD-95 gene set aligns with substantial evidence supporting a role for PSD-95 in synapse-related dysfunction in several neuropsychiatric disorders (Penzes et al., 2011). We also identified significant enrichment of genes with loss-of-function mutations implicated in intellectual disability, in line with other psychiatric disorders (Huckins et al., 2019). Finally, we noted significant enrichment of olfactory pathways across all our pathway analyses, in line with previous findings of differential olfactory identification in individuals with combat-related M-PTSD compared to healthy controls (Vasterling et al., 2000); olfactory triggers for PTSD intrusion symptoms (Daniels and Vermetten, 2016); olfactory-based treatments for PTSD (Aiken and Berry, 2015); and the key role of olfaction in fear conditioning in animal models (Morrison et al., 2015). Our results support the hypothesis that differential sensitivity to odors may predispose to the development of PTSD.
A potential limitation of our findings is that expression quantitative trait loci (eQTL) and linkage disequilibrium (LD) reference panels are largely European. Since GReX models are applicable across ancestries (Huckins et al., 2019), eQTLs are highly conserved between populations (Stranger et al., 2012), and altering LD reference panels in MAGMA had minimal effect (STAR Methods), we do not expect significant bias in our results. However, our assessment is not exhaustive; larger non-European eQTL (Mogil et al., 2018) and LD (Chatzinakos et al., 2020) reference panels are essential to address these questions in TI-based analyses.
SNRNP35 was significant in the M-PTSD, but not the C-PTSD, EA analysis. Before interpreting this difference, it is important to recognize a few methodological limitations. Cohort-type proxies used to delineate trauma type are imperfect; we cannot account for type or degree of trauma, and inclusion of an individual in a military cohort does not preclude an experience of civilian trauma. Moreover, military cohorts may be more homogeneous in terms of sex (mainly male), ancestry (mostly EA), and age, and the lack of significance for these two genes in the transethnic or ancestry-specific C-PTSD analyses may be attributable to lack of power. Control ascertainment may also differ between the two groups; whereas controls for military cohorts are trauma-exposed service members without PTSD, controls for civilian cohorts may be more diverse in the degree of trauma exposure. Therefore, combining all civilian trauma studies may reduce the likelihood of identifying genes for C-PTSD risk.
Sex differences in trauma exposure, symptom expression, levels of support, access to treatment, and treatment response may substantially affect PTSD outcomes (Breslau, 2002; Olff, 2017). The latest PGC-PTSD GWAS has shown evidence for different SNP heritability between men and women (Duncan et al., 2018; Nievergelt et al., 2019). In the present study, we were able to investigate the contributions of sex to the genetic associations with PTSD in the military and civilian cohorts. Our comparisons of male- and female-specific C-PTSD and M-PTSD signals identified significant correlations between male and female C-PTSD analyses, with significant enrichment of nominally significant associations. By contrast, we did not see any within-sex correlations. Therefore, it seems unlikely that our cohort-specific associations are primarily driven by sex differences, although these may still confound our analyses. We urge that these questions be addressed in future large-scale PTSD GWAS; our analysis is still small, particularly with regard to female veterans, precluding a more nuanced sex-specific analysis.
The M-PTSD and C-PTSD differences are intriguing and suggest that further research is necessary to elucidate the potentially different genetic etiologies of PTSD related to civilian and military trauma. To date, PTSD in civilians and service members has been considered the same condition, with comparable biological underpinnings, although they display differences in prevalence, etiologic and/or clinical heterogeneity (Prescott, 2012), and environmental risk factors. Little is known about the possible biological and molecular differences between C-PTSD and M-PTSD. Not surprisingly, biomarkers discovered in civilian studies are not always replicated in military studies (Norrholm and Jovanovic, 2011), and genetic risk factors discovered in the largest (largely civilian) PTSD-GWAS meta-analysis (Duncan et al., 2018; Nievergelt et al., 2019) did not replicate in a large military sample, and vice versa (Gelernter et al., 2019; Stein et al., 2016). Based on our results and previous findings, we hypothesize that C-PTSD and M-PTSD have both shared and distinct genetic etiology, in line with subtypes of other complex, heterogeneous psychiatric disorders (Charney et al., 2017), or pairs of psychiatric disorders with substantial etiologic, symptomatic, and diagnostic overlap (Bipolar Disorder and Schizophrenia Working Group of the Psychiatric Genomics Consortium, 2018). For these types of studies, substantial progress has been made by explicitly comparing cases of each disorder or subtype. However, given the limitations of our design, further work is needed to consolidate this hypothesis.
TI-based studies add important biological insights in GWAS by interpreting association loci at a gene and tissue resolution. However, these insights must be treated with caution, as (1) TI models’ predictive power is correlated with sample size of the tissue reference panel used for model training (Gamazon et al., 2015; Huckins et al., 2019), and gene expression heritability in that tissue (Veturi and Ritchie, 2018; Wheeler et al., 2016); (2) eQTLs are highly shared between tissues (GTEx Consortium, 2017); and (3) spurious gene prioritization can arise due to LD and/or tissue-level co-expression (Wainberg et al., 2019). Further, current TI models are derived from bulk tissue; thus, SNP weights might be driven by variations in cell-type proportions. Importantly, using MRS-blood gene expression (Breen et al., 2015), we observed concordance of predicted PTSD differences and observed PTSD differences with strong evidence for tissue specificity.
TI approaches focus on GReX and cannot completely elucidate the etiopathology of a complex psychiatric disorder such as PTSD. Any case-control differences identified are due only to allele frequency differences and cannot stem from differential exposure to trauma, or to any other environmental factors, or factors related to disease state. As TI models are derived from postmortem adult tissues, the genotype-to-gene expression relationships encoded by these models will be biased by environmental factors in the lives of donors. As far as possible, we and others have controlled for these factors, including correction for known diagnoses, age, smoking status, and surrogate variables (Gamazon et al., 2015; Huckins et al., 2019), when constructing TI models. Even if these methods only partially control for certain stressors, this will not lead to a systematic bias between cases and controls in our study.
We found significant evidence for deployment stress effects in blood gene expression in the MRS cohort, and the genes affected are glucocorticoid responsive. Both genes with study-wide GReX associations for PTSD were downregulated by deployment stress. The directions for SNRNP35 were concordant in the GReX (BA9) and MRS (blood) analyses, with the PTSD cases showing a stronger effect, perhaps indicating that stress-induced SNRNP35 downregulation is a vulnerable response. On the contrary, the direction of effect for ZNF140 in MRS analysis (blood) was discordant with the GReX analysis (blood), with the control subjects showing a stronger deployment effect, perhaps indicating that stress-induced ZNF140 downregulation is a protective response.
Finally, our SNRNP35 knockdown cell experiments demonstrated that downregulation of this specific subunit of the minor spliceosome is sufficient to cause changes in U12 splicing. Since U12 splicing is not widespread (Turunen et al., 2013), SNRNP35 downregulation is expected to have a finite number of directly affected downstream pathways that need to be tracked in postmortem brains from trauma-exposed subjects with or without PTSD. We further confirmed that the administration of a high dose of a stress hormone, mimicking the glucocorticoid elevations after HPA-axis activation, can downregulate this gene in mouse PFC. The observed Snrnp35 downregulation is likely mediated through GR binding at specific GBSs of the gene. Previous studies have shown that DEX administration, only at the high dose we used, can increase anxiety in the elevated plus maze and that this elevation can be blocked by an opioid agonist (Vafaei et al., 2008) or can potentiate the hypermotility caused by opioids (Capasso et al., 1992). These observations open avenues for future translational studies.
In conclusion, our GReX analyses identified PTSD risk genes. We identify SNRNP35 as the most promising gene for further functional investigation of its cohort-type-specific role in vulnerability to and resilience against PTSD.
STAR★METHODS
RESOURCE AVAILABILITY
Lead Contact
Further information and requests for resources and reagents should be directed to and will be fulfilled by the Lead Contact, Nikolaos Daskalakis (ndaskalakis@mclean.harvard.edu)
Materials Availability
All unique/stable reagents generated in this study are available from the Lead Contact with a completed Materials Transfer Agreement.
Data and Code Availability
The full GWAS meta-analyses summary statistics (Nievergelt et al., 2019) from the Psychiatric Genomics Consortium for PTSD (PGC-PTSD) are available for download from the Psychiatric Genomics Consortium at https://www.med.unc.edu/pgc/results-and-downloads/. Access to individual-level data for available datasets may be requested through the PGC Data Access Portal at https://www.med.unc.edu/pgc/shared-methods/data-access-portal/.
The PGC-PTSD S-PrediXcan meta-analyses summary statistics generated by this study are available at: https://www.dropbox.com/sh/qjb2zlx8mcnz9cg/AADUBdFRP2hFnQHbwVTFADy3a?dl=0
The accession number for the Marine Resiliency Study (MRS) gene expression data reported in this paper is GEO: GSE64814.
The CommonMind Consortium(CMC) dorsolateral prefrontal cortex (DLPFC) Coexpression Networks from control subjects are available at: https://www.synapse.org/#!Synapse:syn7118802
Open source scripts used in this study include
FGSEA: https://bioconductor.org/packages/release/bioc/html/fgsea.html (Korotkevich et al., 2019);
gcrma: https://www.bioconductor.org/packages/release/bioc/html/gcrma.html (Wu et al., 2020);
limma: http://bioconductor.org/packages/release/bioc/html/limma.html (Ritchie et al., 2015);
MAGMA: https://ctg.cncr.nl/software/magma/ (de Leeuw et al., 2015);
METAL: http://csg.sph.umich.edu/abecasis/metal/ (Willer et al., 2010);
PrediXcan: https://github.com/hakyimlab/PrediXcan (Gamazon et al., 2015);
S-PrediXcan: https://github.com/hakyimlab/MetaXcan (Barbeira et al., 2018).
EXPERIMENTAL MODEL AND SUBJECT DETAILS
PTSD Workgroup of the Psychiatric Genomics Consortium (PGC-PTSD)
The main analyses of this manuscript are secondary analyses of genotype data obtained by the PGC-PTSD. Details regarding participants, Institutional Review Board approvals, genotyping, quality control, imputation, and ancestry assignment were reported previously (Nievergelt et al., 2019). PGC-PTSD data used in this manuscript included 195,684 individuals (29,539 cases and 166,145 controls) from 70 different ancestry-specific cohorts, partitioned according to ancestry (broadly, in order of cohort size, European Ancestry [EA]; African Ancestry [AA]; Latino Anscetry [LA]), cohort-type (military/civilian) and sex. The breakdown of the sample sizes per analysis can be found in Table S1A.
Marine Resiliency Study (MRS)
MRS is a prospective and longitudinal U.S. Marine cohort (Baker et al., 2012). The MRS research team conducted structured clinical interviews on U.S. Marines and collected peripheral blood samples at 1-month prior-to deployment and 3-months following deployment to conflict zones (i.e., post-deployment). Details regarding the collection of clinical measures and peripheral blood samples have been described in detail previously (Baker et al., 2012). Briefly, at the time of each blood draw, PTSD symptoms were assessed using a structured diagnostic interview, the Clinician Administered PTSD Scale (CAPS) and the PTSD Checklist (PCL). Diagnosis for PTSD was defined as a threat to life, injury, or physical integrity (Criterion A1) and the presence of at least one re-experiencing symptom and either three avoidance symptoms or two hyperarousal symptoms, or two avoidance symptoms plus two hyperarousal symptoms. Symptoms must have occurred at least once within the past month (frequency ≥ 1) and caused a moderate amount of distress (intensity ≥ 2).
All participants had to be symptom free with no PTSD diagnosis and a CAPS ≤ 25 at pre-deployment to be used into subsequent gene expression analyses. Participants who fulfilled criteria for PTSD diagnosis were designated the PTSD group at post-deployment. Carefully matched trauma-exposed control samples with post-deployment CAPS ≤ 25 and those with matched post-deployment measures of combat exposure, age and ethnicity were designated the ‘trauma-exposed control’ group at post-deployment. Subsequently, if a Marine participant developed PTSD following trauma-exposure at 3-months post-deployment, their pre-deployment sample would be included in the ‘PTSD-risk’ group. Likewise, if a participant avoided PTSD symptoms at 3 months post-deployment their sample at pre-deployment was included in the ‘control’ group.
Genomic DNA was prepared from blood leukocytes and genotyping was carried out by Illumina (https://www.illumina.com/) using the HumanOmniExpressExome (HOEE) array with 951,117 loci and by RUCDR (https://www.rucdr.org) using the HOEE array with 967,537 loci (Nievergelt et al., 2015).
Peripheral blood sample acquisition has been described in detail elsewhere (Breen et al., 2015; Glatt et al., 2013; Tylee et al., 2015; GEO: GSE64814). In brief, peripheral blood was obtained from U.S. Marine participants who served a seven-month deployment. Blood was drawn 1-month prior to deployment and again at 3-months post-deployment for each participant. Each blood sample (10ml) was collected into an EDTA-coated collection tube, RNA was isolated from peripheral blood leukocytes using LeukoLOCK Total RNA isolation and sequenced using the Illumina Hi-Seq 2000. From these samples, two separate datasets generated. The first dataset included a total of 24 paired pre-deployment samples and 24 post-deployment samples, which were subjected to the Affymetrix Hu-Gene 1.0 ST Array. The second dataset of data included a total of 130 pre-deployment samples and 134 post-deployment samples which were subjected to RNA-sequencing.
Cell Culture
HEK293 cells (ATCC CRL-1573 – source: female embryonic kidney) were maintained under standard conditions in DMEM supplemented with 10% FBS and 1% Antibiotic-Antimycotic (all Thermo Fisher Scientific) at 37°C and 5% CO2 (vol/vol). For cell culture experiments, cells were seeded in 24 well plates at 35,000 cells/well. Transfection was performed the next day using Lipofectamine 2000 Transfection Reagent (Thermo Fisher Scientific), following the manufacturer’s protocol. Cells were harvested 24 hours post transfection using TrypLE Express (Thermo Fisher Scientific).
shRNA Construction. A shRNA plasmid against hsaSNRNP35 was constructed as follows: We purchased plasmid pshRNA containing a U6 promoter and a multiple cloning site followed by a mCherry gene driven by the PGK promoter from VectorBuilder Inc (Santa Clara, CA). Target sequences for hsaSNRNP35 were derived from https://www.invivogen.com/sirnawizard/ using default settings. We designed custom 58nt oligos with AgeI/EcoRI restriction sites, annealed them to generate double stranded DNA fragments and ligated this fragment into the AgeI/EcoRI sites of pshRNA to generate pshSNRNP35. Similar, a scrambled control was constructed. Restriction digest and Sanger Sequencing confirmed the resulting plasmid.
Primer combinations were as follows:
-
SNRNP35_shRNA_No1
fwd.5′ CCGGGAGTCTGGGCAACTGAGATTTCTCGAGAAATCTCAGTTGCCCAGACTCTTTTTG 3′;
rev.5′ AATTCAAAAAGAGTCTGGGCAACTGAGATTTCTCGAGAAATCTCAGTTGCCCAGACTC 3′
-
SNRNP35_shRNA_No2
fwd.5′ CCGGCTTCAGAGATGACAGGATCAACTCGAGTTGATCCTGTCATCTCTGAAGTTTTTG 3′;
rev.5′ AATTCAAAAACTTCAGAGATGACAGGATCAACTCGAGTTGATCCTGTCATCTCTGAAG 3′)
-
SNRNP35_shRNA_No3
fwd.5′ CCGGCCTATTAACTTGCCAGTTGTTCTCGAGAACAACTGGCAAGTTAATAGGTTTTTG 3′;
rev.5′ AATTCAAAAACCTATTAACTTGCCAGTTGTTCTCGAGAACAACTGGCAAGTTAATAGG 3′)
-
SNRNP35_shRNA_No4
fwd.5′ CCGGAGGGCAATGCTGGCACGATATCTCGAGATATCGTGCCAGCATTGCCCTTTTTTG 3′;
rev.5′ AATTCAAAAAAGGGCAATGCTGGCACGATATCTCGAGATATCGTGCCAGCATTGCCCT 3′
-
SNRNP35_shRNA_No5
fwd.5′ CCGGGGGCTACGCCTTCATCGAATACTCGAGTATTCGATGAAGGCGTAGCCCTTTTTG 3′;
rev.5′ AATTCAAAAAGGGCTACGCCTTCATCGAATACTCGAGTATTCGATGAAGGCGTAGCCC 3′
Mouse study
The dexamethasone (DEX) experiment was performed on adult (9 weeks old) C57BL/6J male mice obtained from The Jackson Laboratory. Mice were group-housed in a temperature-controlled vivarium, with ad libitum access to food and water. Animals were maintained on a 12-h light/dark cycle (lights on at 7:30 am), with experimental procedures being performed during the light cycle. Mice were administered DEX (Sigma) intraperitoneally (i.p.) at a dose of 10 mg/kg dissolved in saline (DEX, N = 7). The injection volume was 125μl/25 g. Vehicle treated mice (VEH, N = 8) were injected with the same amount of saline. Injections were performed between 8:00 and 8:30 am. The i.p. injection per se represents a moderate stressor that is able to induce a stress response. Therefore, an additional group of mice serving as baseline control did not receive any injection or handling prior sacrifice (home cage, N = 6). 4 hours after the injection, all mice were sacrificed by decapitation following quick anesthesia by isoflurane. Brains were removed, snap-frozen in isopentane at −40°C, and stored at −80°C until further processing. All procedures conformed to National Institutes of Health guidelines and were approved by McLean Hospital Institutional Animal Care and use Committee. Whole PFC tissue micropunches were performed (1.78 to 1.34 mm anterior of bregma; Figure S7) based on the Mouse Brain Atlas (Paxinos and Franklin, 2019).
METHOD DETAILS
Cell culture: RNA extraction and qPCR
Total RNA extraction, reverse transcription, and qPCR for cell culture and animal dexamethasone experiment was performed as follows: Total RNA was isolated and purified using the Quick-RNA Miniprep Kit (Zymo Research, Irvine, CA) according to the manufacturer’s protocol. RNA concentration was measured with The Qubit 2.0 Fluorometer (ThermoFisher Scientific, Waltham, MA). RNA was reverse transcribed with the SuperScript IV First-Strand Synthesis System (ThermoFisher Scientific), using random hexamer primers provided within the kit. cDNA was amplified on an Applied Biosystems ViiA7 Real-Time PCR System with Power SYBR Green PCR Master Mix (ThermoFisher Scientific). Ct values were normalized using the established delta-delta Ct method (2–ΔΔCt), unless otherwise stated.
Primer combinations were as follows:
-
CHD1L-U12-unspliced
fwd. 5′ GCAAGAGGCATCCCAACTTA 3′; rev. 5′ TGGCAGGAAGAAACTTGGTC 3′
-
CHD1L-U12-spliced
fwd. 5′ GCAAGAGGCATCCCAACTTA 3′; rev. 5′ ACCAGCTGTCTTGAGGAGGA 3′
-
GAPDH (housekeeping)
fwd. 5′AGCTCAGGGATGACCTTGC 3′; rev. 5′ TCACTGCCACCCAGAAGACT 3′
-
SNRNP35-isoform_201
fwd.5′ GCCTCAGCCAAGGTTTTTAAG 3′; rev.5′ CCCGCTTTGAGTGGATCATA 3′
-
isoform_202
fwd.5′ GGGAGGAAGTGCACCTAGAA 3′; rev.5′ CCCGCTTTGAGTGGATCATA 3′
-
SNRNP35-isoform_203
fwd.5′ CAGCTGCTCGCCTGTCTC 3′; rev.5′ CCCGCTTTGAGTGGATCATA 3′
Mouse study: brain samples RNA extraction and qPCR
Total RNA was isolated and purified using the Quick-RNA miniprep kit (Zymo Research) according to the manufacturer’s protocol. RNA templates were reverse transcribed into cDNA with the SuperScrip IV First-Strand Synthesis System (Thermo Scientific) and random hexamer primers. cDNA was amplified on an Applied Biosystems ViiA7 Real-Time PCR System with Power SYBR Green Master Mix (Thermo Scientific). Snrnp3-specific primers and GAPDH housekeeping primers were as follows: Snrnp35 (fwd. 5′ CGGTGGAAACGGTTTTTCT 3′; rev. 5′ CGGTCATGTGGGTCTTCATC 3′), Gapdh (fwd. 5′ TATGACTCCACTCACGGCAA 3′; rev. 5′ ACATACTCAGCACCGGCCT 3′). Ct values were normalized using the established delta-delta Ct method (2–ΔΔCt).
QUANTIFICATION AND STATISTICAL ANALYSIS
Statistical details for experiments can be found in Figure Legends and Key Resources Table.
KEY RESOURCES TABLE
| REAGENT or RESOURCE | SOURCE | IDENTIFIER |
|---|---|---|
| Chemicals, Peptides, and Recombinant Proteins | ||
| Antibiotic-Antimycotic | Thermo Fisher Scientific | Cat#15240096 |
| Dexamethasone 21-phosphate disodium salt | Sigma | Cat#D1159 |
| DMEM, high glucose | Thermo Fisher Scientific | Cat#11965084 |
| Fetal Bovine Serum | Thermo Fisher Scientific | Cat#16000044 |
| Lipofectamine 2000 Transfection Reagen | Thermo Fisher Scientific | Cat#11668019 |
| Power SYBR Green Master Mix | Thermo Fisher Scientific | Cat#4368706 |
| Quick-RNA Miniprep Kit | Zymo Research | Cat#R1054 |
| SuperScrip IV First-Strand Synthesis System | Thermo Fisher Scientific | Cat#18091200 |
| TrypLE Express Enzyme | Thermo Fisher Scientific | Cat#12605010 |
| Deposited Data | ||
| CMC DLPFC Coexpression Networks from Control Subjects | (Fromer et al., 2016) | https://www.synapse.org/#!Synapse:syn7118802 |
| Marine Resiliency Study (MRS) gene expression data | (Breen et al., 2015; Glatt et al., 2013; Tylee et al., 2015) | GEO: GSE64814 |
| Psychiatric Genomics Consortium for PTSD (PGC-PTSD) GWAS | (Nievergelt et al., 2019) | meta-analyses summary statistics: https://www.med.unc.edu/pgc/results-and-downloads/ individual-level data: https://www.med.unc.edu/pgc/shared-methods/data-access-portal/ |
| PGC-PTSD S-PrediXcan results | This paper | meta-analyses summary statistics: https://www.dropbox.com/sh/qjb2zlx8mcnz9cg/AADUBdFRP2hFnQHbwVTFADy3a?dl=0 |
| Experimental Models: Cell Lines | ||
| HEK293 cells | American Type Culture Collection | CRL-1573 |
| Experimental Models: Organisms/Strains | ||
| Mouse: C57BL/6J | Jackson Laboratory | Cat#000664 |
| Oligonucleotides | ||
| See below | N/A | |
| Software and Algorithms | ||
| FGSEA | (Korotkevich et al., 2019) | https://bioconductor.org/packages/release/bioc/html/fgsea.html |
| gcrma | (Wu et al., 2020) | https://www.bioconductor.org/packages/release/bioc/html/gcrma.html |
| limma | (Ritchie et al., 2015) | http://bioconductor.org/packages/release/bioc/html/limma.html |
| MAGMA | (de Leeuw et al., 2015) | https://ctg.cncr.nl/software/magma/ |
| METAL | (Willer et al., 2010) | http://csg.sph.umich.edu/abecasis/metal/ |
| PrediXcan | (Gamazon et al., 2015) | https://github.com/hakyimlab/PrediXcan |
| S-PrediXcan | (Barbeira et al., 2018) | https://github.com/hakyimlab/MetaXcan |
Transcriptomic Imputation (TI) and PTSD-association testing
For the prediction of genetically regulated gene expression (GReX) we used publicly available TI-models derived from Genotype-Tissue Expression (GTEx) project (v6 release) and CMC (v1 release) eQTL reference panels (Gamazon et al., 2015; Huckins et al., 2019). Briefly, PrediXcan TI-models were created from matched genotype and gene expression data. Elastic net regression was used to identify SNPs within the cis-region (1Mb) that jointly predict the expression of a given gene. For each gene, dosages of SNPs included in the TI model are weighted and combined to produce an estimate of GReX. These TI-models may then be applied to genotype data, for example from GWAS studies, to estimate the relationship of GReX to disease.
An extension of PrediXcan is S-PrediXcan (Barbeira et al., 2018), which converts SNP association statistics to tissue-specific genic association statistics, using model weights and LD between variants involved. We have previously shown that results obtained using PrediXcan (raw genotype based) and S-PrediXcan (summary statistic based) are analogous (Barbeira et al., 2018; Huckins et al., 2019). Results are highly correlated (r≈.99) when applied to European populations, and high in other ancestry populations (Barbeira et al., 2018). We used S-PrediXcan in this study using the summary statistics files described in Table S1A.
Meta-Analysis
We performed meta-analyses using an inverse variance based approach in METAL (Willer et al., 2010), for our overall analysis, and analyses delineated by (1) ancestry; (2) cohort-type (Military/Civilian); (3) sex; and (4) their combination. We required that (1) each meta-analysis included at least 1,000 cases and a total of 3,000 subjects; and (2) heterogeneity p > 0.05. We applied two multiple-test corrections to ascertain significance, following previous PrediXcan literature (Barbeira et al., 2018; Huckins et al., 2019). First, a study-wide threshold, using a Bonferroni correction for all genes and tissues tested (p = 2.36e-7; based on 211,466 tissue-gene pairs, across all tissues). Second, a within-tissue significance threshold, accounting for all genes tested in each tissue (Table S1B). It is likely that the study-wide threshold is overly conservative, given the high degree of eQTL sharing and gene expression correlation between genes and across tissues. Consequently, it is likely that we are performing far fewer independent tests than assumed under a Bonferroni correction. However, applying a less stringent threshold would risk identification of many false positive results, which we are careful to avoid.
Primary Pathway analysis
We performed gene set enrichment tests using an adaptation of MAGMA (de Leeuw et al., 2015). We created a set of associations statistics using S-PrediXcan-based meta-analyses p values from the overall, C-PTSD, and M-PTSD transethnic meta-analyses. For each set of results, we selected the best (most significant) p value per gene, applying a Bonferroni correction to account for the number of tissues tested.
Note as our analysis does not use MAGMA to create gene-level p values, we did not input GWAS SNP-level p values. After that the MAGMA analysis is then run in the standard way. As our trans-ethnic meta-analyses are ~80%–90% EA (Table S1), for calculations of LD in these analyses, we used the European-subset of the 1000 Genomes Reference Panel Phase 3 (“EUR” 1KGPv3; (Sudmant et al., 2015)).
We performed three gene set enrichment analyses for each of our association statistics:
First, we tested for enrichment of genes from PTSD literature. We downloaded from PubMed (https://www.ncbi.nlm.nih.gov/pubmed/) the 700+ publication list according to “PTSD” & “gene” search (November 1, 2017). From these publications, we discarded the ones that were not original investigations. From the remaining 511 publications (Tables S3A and S3B), we were able to extract 143 unique gene symbols from the publication title irrespective if the reported findings were positive or negative. The most frequent being the serotonin transporter gene (SLC6A4 in 35 publications). Of these 143 genes, 103 were included in our GReX analyses. External validation of our PTSD gene set was the highly significant enrichment (adjusted p [adj.p] = 1.395e-65) for PTSD gene set from DisGeNET, the largest publicly available collection of genetic association with disease (Piñero et al., 2017).
Second, we tested for enrichment of 92 hypothesis-driven pathways, including gene sets associated with other psychiatric disorders, stress hormones, and genes with H3K4me3 or H3K27ac peaks in neurons, or non-neurons (Girdhar et al., 2018).
Third, we tested 8,582 “agnostic” gene sets collated from publicly available databases including KEGG, GO, REACTOME, PANTHER, BIOCARTA, and MGI.
For all gene set analyses, we included only gene sets with at least ten genes and used the “competitive” P-value from MAGMA. We applied an FDR-correction within each experiment to correct for multiple testing.
Since eQTLs are highly conserved across ancestries (Stranger et al., 2012), and our analysis includes largely EA individuals, we do not expect the selection of the EUR 1KGPv3 subpopulation to substantially influence our gene-set enrichment results. However, we performed a post hoc analysis to test whether selection of the African-American (i.e., “ASW” 1KGPv3) or Latino-American (i.e., “MXL” 1KGPv3) subpopulations, or proportional combination of the three reference panels (based on ancestry proportions in Table S1A), influences our results. We repeated our MAGMA agnostic gene set analysis for our overall trans-ethnic meta-analyses with each of these four reference panels. We see significant correlation in association statistics across all four reference panels; correlation of −log10 p values are highly significant across all pairwise comparison (r > 0.99, p < 2.2×10⁻¹⁶), and gene set ranking were identical across all analyses. However, there are fluctuations in the number of gene-sets reaching nominal significance across reference panels (e.g., ASW: 636, MXL: 889, EUR: 772, mixed: 648); these do not represent large changes in associations, but rather small fluctuation around the p = 0.05 threshold. We do not think these minor changes influence our overall results.
MRS gene expression analysis
MRS gene expression data pre-processing (Figure S6): Data from each dataset were processed, normalized and quality treated independently. Affymetrix arrays underwent robust multi-array average (RMA) normalization with additional GC-correction when possible [affy, oligo, gcrma (Wu et al., 2020)]. When multiple microarray probes mapped to the same HGNC symbol, the probes with the highest average expression across all samples was selected. RNA-sequencing were mapped and counted as described previously. Genes with with > 2 count per million (cpm) in at least 50% of all samples were retained and subsequently normalized using VOOM in limma (Ritchie et al., 2015), a variance-stabilization transformation method resulting in a normally distributed data matrix. For each dataset, normalized data were inspected for outlying samples using unsupervised hierarchical clustering of samples (based on Pearson’s correlation coefficient and average distance metric) and principal component analysis to identify potential outliers outside two standard deviations from these grand averages; ten outliers were removed in total. A total of 11,090 genes were expressed in both microarray and RNA-sequencing datasets. Combat batch correction (Leek et al., 2012) was applied to combine the two datasets and reduce systematic sources of variability other than case/control status, such as technical variability, forming the basis for subsequent case-control analytic comparisons.
We used PrediXcan (Gamazon et al., 2015) to impute, based on genotype dosages, GReX for the 21 GTeX tissues included in our S-PrediXcan meta-analysis. For 6,295 genes (56.7%) out of the 11,090 genes with observed expression we also had GReX expression. MRS differential gene expression analysis (Figure S7) was performed using the limma package (Ritchie et al., 2015) to detect relationships between gene expression levels and diagnostic status or deployment stress (with individual as a repeated-measure). The covariates ancestry (genetic PC1), age, traumatic brain injury (TBI), alcohol and nicotine were included in all models to adjust for their potential confounding influence on gene expression between main group effects. Predicted and observed differential expression results were compared.
MRS Gene Set Enrichment Analysis (GSEA)
The GSEA (Subramanian et al., 2005) implementation in R (Korotkevich et al., 2019), called “FGSEA,” was used to test concordance of MRS deployment-stress induction effects with gene expression signatures from two datasets:
Microarray-based gene expression measured in whole blood before and 3 hours after per os 1.5 mg dexamethasone administration (N = 160) (Arloth et al., 2015).
RNA sequencing-based expression measured in PBMCs after in vitro culture for 72 hours at 0 nM, 2.5, 5 and 50 nM DEX in 10 PTSD and 10 control subjects (Breen et al., 2019). Additional details about culture conditions were described previously in detail (Yehuda et al., 2003).
We transformed the two gene sets for the GSEA taking into account that enrichment score normalization is not very accurate for extremely small or extremely large gene sets. For both datasets we first used a threshold of adj.p < 0.05 and then we selected the top 500 ranked genes based on the GSEA ranking metric that is the product of the sign of the ‘direction’ in the expression change and the p value.
CMC Gene Ontology (GO) analysis
For the 152 genes, which are included to CMC DLPFC ivory module (https://www.synapse.org/#!Synapse:syn7118802), we ran goana, a limma function, in R. Goana is a test for over-representation of gene ontology (GO) terms pathways. From the 22,272 available pathways we produced results only for 3,345 pathways (DE > 0, number of genes in the set), with 269 out of the 3,345 with adj.p < 0.05. Finally, we computed normalized enrichment against enrichment distribution of 1000 random sets sampled from the DLPFC dataset following an analogous normalization procedure as in GSEA.
Supplementary Material
Highlights.
Transcriptomic imputation applied to the PTSD GWAS identifies tissue-gene associations
Blood ZNF140 is predicted to be upregulated in PTSD in European populations
Prefrontal SNRNP35 is predicted to be downregulated in European military cohorts
The splicing regulator SNRNP35 is downregulated by stress and glucocorticoids
ACKNOWLEDGMENTS
We thank the research participants worldwide who shared their life experiences and biological samples with the PGC-PTSD investigators. We thank Jessica Johnson, MPH, for formatting suggestions about the graphical abstract. PGC-PTSD was funded by Cohen Veterans Bioscience, the National Institute of Mental Health (NIMH)/U.S. Army Medical Research and Materiel Command grant R01MH106595, and One Mind Institute to I.L., K.C.K., C.M.N., and K.J.R.; and was additionally supported by NIMH grant U01MH109539 to the Psychiatric Genomics Consortium. Genotyping of samples was supported in part through the Stanley Center for Psychiatric Genetics at the Broad Institute of MIT and Harvard. This research has been conducted using the UK Biobank resource under application number 16577. MRS and MRS-II (including gene expression data) were funded by the Marine Corps and Navy Bureau of Medicine and Surgery, and VA Health Research and Development. L.M.H. was supported by NIMH grant R01MH118278, a 2017 NARSAD Young Investigator grant from Brain & Behavior Research Foundation, and a Faculty Scholar Award from Seaver Foundation. C.C. was supported by the 2019 Seed Grant from Silvio O. Conte Center for Stress Peptide Advanced Research, Education, & Dissemination (NIMH P50MH115874). H.K.I. was supported by two NIMH grants (R01MH107666, R01MH101820), and National Institute of Diabetes and Digestive and Kidney Diseases grant P30DK20595. P.S. and E.A.S. were supported by a NIMH grant U01MH109536. N.P.D. was supported by a 2015 and a 2018 NARSAD Young Investigator grants from BBRF, a Jonathan Edward Brooking mental health research fellowship from McLean Hospital and an appointed KL2 award from Harvard Catalyst | The Harvard Clinical and Translational Science Center (National Center for Advancing Translational Sciences KL2TR002542, UL1TR002541). The content is solely the responsibility of the authors and does not necessarily represent the official views of Harvard Catalyst, Harvard University and its affiliated academic healthcare centers, or the National Institutes of Health.
Footnotes
SUPPLEMENTAL INFORMATION
Supplemental Information can be found online at https://doi.org/10.1016/jcelrep.2020.107716.
DECLARATION OF INTERESTS
J.W.S. is an unpaid member of the Bipolar/Depression Research Community Advisory Panel of 23andMe. D.J.S. has received research grants and/or consultancy honoraria from Biocodex, Lundbeck, and Sun. R.Y. is a co-inventor of the following patent: “Genes associated with posttraumatic-stress disorder, WO 2010029176 A1.” I.L. has been a consultant for ARMGO Pharmaceuticals, Sunovion Pharmaceuticals, and Trimaran Pharma. K.J.R. has received consulting income from Alkermes and is on scientific advisory boards for Janssen, Verily, and Resilience Therapeutics. He has also received sponsored research support from Takeda and Brainsway. N.P.D. has held a part-time paid position at Cohen Veteran Bioscience. He has also been a consultant for Sunovion Pharmaceuticals.
REFERENCES
- Aiken MP, and Berry MJ (2015). Posttraumatic stress disorder: possibilities for olfaction and virtual reality exposure therapy. Virt. Real 19, 95–109. [Google Scholar]
- Arloth J, Bogdan R, Weber P, Frishman G, Menke A, Wagner KV, Balsevich G, Schmidt MV, Karbalai N, Czamara D, et al. ; Major Depressive Disorder Working Group of the Psychiatric Genomics Consortium (PGC); Major Depressive Disorder Working Group of the Psychiatric Genomics Consortium PGC (2015). Genetic Differences in the Immediate Transcriptome Response to Stress Predict Risk-Related Brain Function and Psychiatric Disorders. Neuron 86, 1189–1202. [DOI] [PMC free article] [PubMed] [Google Scholar]
- Averill LA, Purohit P, Averill CL, Boesl MA, Krystal JH, and Abdallah CG (2017). Glutamate dysregulation and glutamatergic therapeutics for PTSD: Evidence from human studies. Neurosci. Lett 649, 147–155. [DOI] [PMC free article] [PubMed] [Google Scholar]
- Baker DG, Nash WP, Litz BT, Geyer MA, Risbrough VB, Nievergelt CM, O’Connor DT, Larson GE, Schork NJ, Vasterling JJ, et al. ; MRS Team (2012). Predictors of risk and resilience for posttraumatic stress disorder among ground combat Marines: methods of the Marine Resiliency Study. Prev. Chronic Dis 9, E97. [DOI] [PMC free article] [PubMed] [Google Scholar]
- Barbeira AN, Dickinson SP, Bonazzola R, Zheng J, Wheeler HE, Torres JM, Torstenson ES, Shah KP, Garcia T, Edwards TL, et al. ; GTEx Consortium (2018). Exploring the phenotypic consequences of tissue specific gene expression variation inferred from GWAS summary statistics. Nat. Commun 9, 1825. [DOI] [PMC free article] [PubMed] [Google Scholar]
- Bipolar Disorder and Schizophrenia Working Group of the Psychiatric Genomics Consortium (2018). Genomic Dissection of Bipolar Disorder and Schizophrenia, Including 28 Subphenotypes. Cell 173, 1705–1715.e16. [DOI] [PMC free article] [PubMed] [Google Scholar]
- Bonanno GA (2004). Loss, trauma, and human resilience: have we underestimated the human capacity to thrive after extremely aversive events? Am. Psychol 59, 20–28. [DOI] [PubMed] [Google Scholar]
- Breen MS, Maihofer AX, Glatt SJ, Tylee DS, Chandler SD, Tsuang MT, Risbrough VB, Baker DG, O’Connor DT, Nievergelt CM, and Woelk CH (2015). Gene networks specific for innate immunity define post-traumatic stress disorder. Mol. Psychiatry 20, 1538–1545. [DOI] [PMC free article] [PubMed] [Google Scholar]
- Breen MS, Tylee DS, Maihofer AX, Neylan TC, Mehta D, Binder EB, Chandler SD, Hess JL, Kremen WS, Risbrough VB, et al. (2018). PTSD Blood Transcriptome Mega-Analysis: Shared Inflammatory Pathways across Biological Sex and Modes of Trauma. Neuropsychopharmacology 43, 469–481. [DOI] [PMC free article] [PubMed] [Google Scholar]
- Breen MS, Bierer LM, Daskalakis NP, Bader HN, Makotkine I, Chattopadhyay M, Xu C, Buxbaum Grice A, Tocheva AS, Flory JD, et al. (2019). Differential transcriptional response following glucocorticoid activation in cultured blood immune cells: a novel approach to PTSD biomarker development. Transl. Psychiatry 9, 201. [DOI] [PMC free article] [PubMed] [Google Scholar]
- Breslau N (2002). Gender differences in trauma and posttraumatic stress disorder. J. Gend. Specif. Med 5, 34–40. [PubMed] [Google Scholar]
- Capasso A, Pieretti S, Di Giannuario A, Loizzo A, and Sorrentino L (1992). Time- and dose-related influence of dexamethasone on morphine-induced hypermotility in mice. Agents Actions (Spec. No.), C121–C123. [PubMed] [Google Scholar]
- Charney AW, Ruderfer DM, Stahl EA, Moran JL, Chambert K, Belliveau RA, Forty L, Gordon-Smith K, Di Florio A, Lee PH, et al. (2017). Evidence for genetic heterogeneity between clinical subtypes of bipolar disorder. Transl. Psychiatry 7, e993. [DOI] [PMC free article] [PubMed] [Google Scholar]
- Chatzinakos C, Lee D, Cai N, Vladimirov V, Webb BT, Riley B, Flint J, Kendler K, Ressler KJ, Daskalakis NP, et al. (2020). Increasing the resolution and precision of psychiatric GWAS by re-imputing summary statistics using a large, diverse reference panel. bioRxiv. 10.1101/496570. [DOI] [PMC free article] [PubMed]
- Daniels JK, and Vermetten E (2016). Odor-induced recall of emotional memories in PTSD-Review and new paradigm for research. Exp. Neurol 284 (Pt B), 168–180. [DOI] [PubMed] [Google Scholar]
- Daskalakis NP, Provost AC, Hunter RG, and Guffanti G (2018a). Non-coding RNAs: Stress, Glucocorticoids, and Posttraumatic Stress Disorder. Biol. Psychiatry 83, 849–865. [DOI] [PubMed] [Google Scholar]
- Daskalakis NP, Rijal CM, King C, Huckins LM, and Ressler KJ (2018b). Recent Genetics and Epigenetics Approaches to PTSD. Curr. Psychiatry Rep 20, 30. [DOI] [PMC free article] [PubMed] [Google Scholar]
- de Leeuw CA, Mooij JM, Heskes T, and Posthuma D (2015). MAGMA: generalized gene-set analysis of GWAS data. PLoS Comput. Biol 11, e1004219. [DOI] [PMC free article] [PubMed] [Google Scholar]
- Duncan LE, Ratanatharathorn A, Aiello AE, Almli LM, Amstadter AB, Ashley-Koch AE, Baker DG, Beckham JC, Bierut LJ, Bisson J, et al. (2018). Largest GWAS of PTSD (N=20 070) yields genetic overlap with schizophrenia and sex differences in heritability. Mol. Psychiatry 23, 666–673. [DOI] [PMC free article] [PubMed] [Google Scholar]
- Fromer M, Roussos P, Sieberts SK, Johnson JS, Kavanagh DH, Peru-mal TM, Ruderfer DM, Oh EC, Topol A, Shah HR, et al. (2016). Gene expression elucidates functional impact of polygenic risk for schizophrenia. Nat. Neurosci 19, 1442–1453. [DOI] [PMC free article] [PubMed] [Google Scholar]
- Gamazon ER, Wheeler HE, Shah KP, Mozaffari SV, Aquino-Michaels K, Carroll RJ, Eyler AE, Denny JC, Nicolae DL, Cox NJ, and Im HK; GTEx Consortium (2015). A gene-based association method for mapping traits using reference transcriptome data. Nat. Genet 47, 1091–1098. [DOI] [PMC free article] [PubMed] [Google Scholar]
- Gelernter J, Sun N, Polimanti R, Pietrzak R, Levey DF, Bryois J, Lu Q, Hu Y, Li B, Radhakrishnan K, et al. ; Department of Veterans Affairs Cooperative Studies Program (#575B) and Million Veteran Program (2019). Genome-wide association study of post-traumatic stress disorder reexperiencing symptoms in >165,000 US veterans. Nat. Neurosci 22, 1394–1401. [DOI] [PMC free article] [PubMed] [Google Scholar]
- Girdhar K, Hoffman GE, Jiang Y, Brown L, Kundakovic M, Hauberg ME, Francoeur NJ, Wang YC, Shah H, Kavanagh DH, et al. (2018). Cell-specific histone modification maps in the human frontal lobe link schizophrenia risk to the neuronal epigenome. Nat. Neurosci 21, 1126–1136. [DOI] [PMC free article] [PubMed] [Google Scholar]
- Girgenti MJ, and Duman RS (2018). Transcriptome Alterations in Posttraumatic Stress Disorder. Biol. Psychiatry 83, 840–848. [DOI] [PubMed] [Google Scholar]
- Glatt SJ, Tylee DS, Chandler SD, Pazol J, Nievergelt CM, Woelk CH, Baker DG, Lohr JB, Kremen WS, Litz BT, and Tsuang MT; Marine Resiliency Study Investigators (2013). Blood-based gene-expression predictors of PTSD risk and resilience among deployed marines: a pilot study. Am. J. Med. Genet. B. Neuropsychiatr. Genet 162B, 313–326. [DOI] [PubMed] [Google Scholar]
- Graham J, Legarreta M, North L, DiMuzio J, McGlade E, and Yurgelun-Todd D (2016). A Preliminary Study of DSM–5 PTSD Symptom Patterns in Veterans by Trauma Type. Mil. Psychol 28, 115–122. [Google Scholar]
- GTEx Consortium; Biospecimen collection; Pathology; eQTL manuscript working group (2017). Genetic effects on gene expression across human tissues. Nature 550, 204–213. [DOI] [PMC free article] [PubMed] [Google Scholar]
- Gusev A, Ko A, Shi H, Bhatia G, Chung W, Penninx BW, Jansen R, de Geus EJ, Boomsma DI, Wright FA, et al. (2016). Integrative approaches for large-scale transcriptome-wide association studies. Nat. Genet 48, 245–252. [DOI] [PMC free article] [PubMed] [Google Scholar]
- Huckins LM, Dobbyn A, Ruderfer DM, Hoffman G, Wang W, Pardiñas AF, Rajagopal VM, Als TD, T Nguyen H, Girdhar K, et al. ; CommonMind Consortium; Schizophrenia Working Group of the Psychiatric Genomics Consortium; iPSYCH-GEMS Schizophrenia Working Group (2019). Gene expression imputation across multiple brain regions provides insights into schizophrenia risk. Nat. Genet 51, 659–674. [DOI] [PMC free article] [PubMed] [Google Scholar]
- Jakob JM, Lamp K, Rauch SA, Smith ER, and Buchholz KR (2017). The Impact of Trauma Type or Number of Traumatic Events on PTSD Diagnosis and Symptom Severity in Treatment Seeking Veterans. J. Nerv. Ment. Dis 205, 83–86. [DOI] [PubMed] [Google Scholar]
- Kessler RC, Berglund P, Demler O, Jin R, Merikangas KR, and Walters EE (2005). Lifetime prevalence and age-of-onset distributions of DSM-IV disorders in the National Comorbidity Survey Replication. Arch. Gen. Psychiatry 62, 593–602. [DOI] [PubMed] [Google Scholar]
- Kessler RC, Aguilar-Gaxiola S, Alonso J, Benjet C, Bromet EJ, Cardoso G, Degenhardt L, de Girolamo G, Dinolova RV, Ferry F, et al. (2017). Trauma and PTSD in the WHO World Mental Health Surveys. Eur. J. Psychotraumatol 8 (sup5), 1353383. [DOI] [PMC free article] [PubMed] [Google Scholar]
- Korotkevich G, Sukhov V, and Sergushichev A (2019). Fast gene set enrichment analysis. bioRxiv. 10.1101/060012. [DOI]
- Leek JT, Johnson WE, Parker HS, Jaffe AE, and Storey JD (2012). The sva package for removing batch effects and other unwanted variation in high-throughput experiments. Bioinformatics 28, 882–883. [DOI] [PMC free article] [PubMed] [Google Scholar]
- Mogil LS, Andaleon A, Badalamenti A, Dickinson SP, Guo X, Rotter JI, Johnson WC, Im HK, Liu Y, and Wheeler HE (2018). Genetic architecture of gene expression traits across diverse populations. PLoS Genet. 14, e1007586. [DOI] [PMC free article] [PubMed] [Google Scholar]
- Morrison FG, Dias BG, and Ressler KJ (2015). Extinction reverses olfactory fear-conditioned increases in neuron number and glomerular size. Proc. Natl. Acad. Sci. USA 112, 12846–12851. [DOI] [PMC free article] [PubMed] [Google Scholar]
- Nemeroff CB, Bremner JD, Foa EB, Mayberg HS, North CS, and Stein MB (2006). Posttraumatic stress disorder: a state-of-the-science review. J. Psychiatr. Res 40, 1–21. [DOI] [PubMed] [Google Scholar]
- Niemelä EH, Oghabian A, Staals RH, Greco D, Pruijn GJ, and Frilander MJ (2014). Global analysis of the nuclear processing of transcripts with unspliced U12-type introns by the exosome. Nucleic Acids Res. 42, 7358–7369. [DOI] [PMC free article] [PubMed] [Google Scholar]
- Nievergelt CM, Maihofer AX, Mustapic M, Yurgil KA, Schork NJ, Miller MW, Logue MW, Geyer MA, Risbrough VB, O’Connor DT, and Baker DG (2015). Genomic predictors of combat stress vulnerability and resilience in U.S. Marines: A genome-wide association study across multiple ancestries implicates PRTFDC1 as a potential PTSD gene. Psychoneuroendocrinology 51, 459–471. [DOI] [PubMed] [Google Scholar]
- Nievergelt CM, Ashley-Koch AE, Dalvie S, Hauser MA, Morey RA, Smith AK, and Uddin M (2018). Genomic Approaches to Posttraumatic Stress Disorder: The Psychiatric Genomic Consortium Initiative. Biol. Psychiatry 83, 831–839. [DOI] [PMC free article] [PubMed] [Google Scholar]
- Nievergelt CM, Maihofer AX, Klengel T, Atkinson EG, Chen CY, Choi KW, Coleman JRI, Dalvie S, Duncan LE, Gelernter J, et al. (2019). International meta-analysis of PTSD genome-wide association studies identifies sex- and ancestry-specific genetic risk loci. Nat. Commun 10, 4558. [DOI] [PMC free article] [PubMed] [Google Scholar]
- Nishimura T, Narita T, Miyazaki E, Ito T, Nishimoto N, Yoshizaki K, Martial JA, Bellfroid EJ, Vissing H, and Taniyama T (2001). Characterization of the human Fc gamma RIIB gene promoter: human zinc-finger proteins (ZNF140 and ZNF91) that bind to different regions function as transcription repressors. Int. Immunol 13, 1075–1084. [DOI] [PubMed] [Google Scholar]
- Norrholm S, and Jovanovic T (2011). Translational Fear Inhibition Models as Indices of Trauma-related Psychopathology. Curr. Psychiatry Rev 7, 194–204. [Google Scholar]
- Olff M (2017). Sex and gender differences in post-traumatic stress disorder: an update. Eur. J. Psychotraumatol 8 (sup4), 1351204. [Google Scholar]
- Paxinos G, and Franklin KB (2019). Paxinos and Franklin’s The Mouse Brain in Stereotaxic Coordinates,, Fifth Edition (Academic Press; ). [Google Scholar]
- Penzes P, Cahill ME, Jones KA, VanLeeuwen JE, and Woolfrey KM (2011). Dendritic spine pathology in neuropsychiatric disorders. Nat. Neurosci 14, 285–293. [DOI] [PMC free article] [PubMed] [Google Scholar]
- Piñero J, Bravo À, Queralt-Rosinach N, Gutiérrez-Sacristán A, Deu-Pons J, Centeno E, García-García J, Sanz F, and Furlong LI (2017). DisGeNET: a comprehensive platform integrating information on human disease-associated genes and variants. Nucleic Acids Res. 45 (D1), D833–D839. [DOI] [PMC free article] [PubMed] [Google Scholar]
- Prescott MR (2012). The Differences Between War- and Civilian-Related Traumatic Events and the Presentation of Posttraumatic Stress Disorder and Suicidal Ideation in a Sample of National Guard Soldiers Doctoral dissertation (Ann Arbor: University of Michigan; ). [Google Scholar]
- Ritchie ME, Phipson B, Wu D, Hu Y, Law CW, Shi W, and Smyth GK (2015). limma powers differential expression analyses for RNA-sequencing and microarray studies. Nucleic Acids Res. 43, e47. [DOI] [PMC free article] [PubMed] [Google Scholar]
- Sareen J (2014). Posttraumatic stress disorder in adults: impact, comorbidity, risk factors, and treatment. Can. J. Psychiatry 59, 460–467. [DOI] [PMC free article] [PubMed] [Google Scholar]
- Stein MB, Chen CY, Ursano RJ, Cai T, Gelernter J, Heeringa SG, Jain S, Jensen KP, Maihofer AX, Mitchell C, et al. ; Army Study to Assess Risk and Resilience in Servicemembers (STARRS) Collaborators (2016). Genome-wide Association Studies of Posttraumatic Stress Disorder in 2 Cohorts of US Army Soldiers. JAMA Psychiatry 73, 695–704. [DOI] [PMC free article] [PubMed] [Google Scholar]
- Stranger BE, Montgomery SB, Dimas AS, Parts L, Stegle O, Ingle CE, Sekowska M, Smith GD, Evans D, Gutierrez-Arcelus M, et al. (2012). Patterns of cis regulatory variation in diverse human populations. PLoS Genet. 8, e1002639. [DOI] [PMC free article] [PubMed] [Google Scholar]
- Subramanian A, Tamayo P, Mootha VK, Mukherjee S, Ebert BL, Gillette MA, Paulovich A, Pomeroy SL, Golub TR, Lander ES, and Mesirov JP (2005). Gene set enrichment analysis: a knowledge-based approach for interpreting genome-wide expression profiles. Proc. Natl. Acad. Sci. USA 102, 15545–15550. [DOI] [PMC free article] [PubMed] [Google Scholar]
- Sudmant PH, Rausch T, Gardner EJ, Handsaker RE, Abyzov A, Huddleston J, Zhang Y, Ye K, Jun G, Fritz MH, et al. ; 1000 Genomes Project Consortium (2015). An integrated map of structural variation in 2,504 human genomes. Nature 526, 75–81. [DOI] [PMC free article] [PubMed] [Google Scholar]
- Turunen JJ, Niemelä EH, Verma B, and Frilander MJ (2013). The significant other: splicing by the minor spliceosome. Wiley Interdiscip. Rev. RNA 4, 61–76. [DOI] [PMC free article] [PubMed] [Google Scholar]
- Tylee DS, Chandler SD, Nievergelt CM, Liu X, Pazol J, Woelk CH, Lohr JB, Kremen WS, Baker DG, Glatt SJ, and Tsuang MT; Marine Resiliency Study Investigators (2015). Blood-based gene-expression biomarkers of post-traumatic stress disorder among deployed marines: A pilot study. Psychoneuroendocrinology 51, 472–494. [DOI] [PMC free article] [PubMed] [Google Scholar]
- Vafaei AA, Rashidy-Pour A, and Taherian AA (2008). Peripheral injection of dexamethasone modulates anxiety related behaviors in mice: an interaction with opioidergic neurons. Pak. J. Pharm. Sci 21, 285–289. [PubMed] [Google Scholar]
- Vasterling JJ, Brailey K, and Sutker PB (2000). Olfactory identification in combat-related posttraumatic stress disorder. J. Trauma. Stress 13, 241–253. [DOI] [PubMed] [Google Scholar]
- Veturi Y, and Ritchie MD (2018). How powerful are summary-based methods for identifying expression-trait associations under different genetic architectures? Pac. Symp. Biocomput 23, 228–239. [PMC free article] [PubMed] [Google Scholar]
- Visscher PM, Wray NR, Zhang Q, Sklar P, McCarthy MI, Brown MA, and Yang J (2017). 10 Years of GWAS Discovery: Biology, Function, and Translation. Am. J. Hum. Genet 101, 5–22. [DOI] [PMC free article] [PubMed] [Google Scholar]
- Wainberg M, Sinnott-Armstrong N, Mancuso N, Barbeira AN, Knowles DA, Golan D, Ermel R, Ruusalepp A, Quertermous T, Hao K, et al. (2019). Opportunities and challenges for transcriptome-wide association studies. Nat. Genet 51, 592–599. [DOI] [PMC free article] [PubMed] [Google Scholar]
- Wheeler HE, Shah KP, Brenner J, Garcia T, Aquino-Michaels K, Cox NJ, Nicolae DL, Im HK, and Im HK; GTEx Consortium (2016). Survey of the Heritability and Sparse Architecture of Gene Expression Traits across Human Tissues. PLoS Genet. 12, e1006423. [DOI] [PMC free article] [PubMed] [Google Scholar]
- Willer CJ, Li Y, and Abecasis GR (2010). METAL: fast and efficient meta-analysis of genomewide association scans. Bioinformatics 26, 2190–2191. [DOI] [PMC free article] [PubMed] [Google Scholar]
- Yehuda R, Yang RK, Guo SL, Makotkine I, and Singh B (2003). Relationship between dexamethasone-inhibited lysozyme activity in peripheral mononuclear leukocytes and the cortisol and glucocorticoid receptor response to dexamethasone. J. Psychiatr. Res 37, 471–477. [DOI] [PubMed] [Google Scholar]
- Wu J, Irizarry R, MacDonald J, and Gentry J (2020). Gcrma: background adjustment using sequence information. R package version 2.60.0 (Bio-conductor). [Google Scholar]
- Yehuda R, Hoge CW, McFarlane AC, Vermetten E, Lanius RA, Nievergelt CM, Hobfoll SE, Koenen KC, Neylan TC, and Hyman SE (2015). Post-traumatic stress disorder. Nat. Rev. Dis. Primers 1, 15057. [DOI] [PubMed] [Google Scholar]
- Zoladz PR, and Diamond DM (2013). Current status on behavioral and biological markers of PTSD: a search for clarity in a conflicting literature. Neurosci. Biobehav. Rev 37, 860–895. [DOI] [PubMed] [Google Scholar]
Associated Data
This section collects any data citations, data availability statements, or supplementary materials included in this article.
Supplementary Materials
Data Availability Statement
The full GWAS meta-analyses summary statistics (Nievergelt et al., 2019) from the Psychiatric Genomics Consortium for PTSD (PGC-PTSD) are available for download from the Psychiatric Genomics Consortium at https://www.med.unc.edu/pgc/results-and-downloads/. Access to individual-level data for available datasets may be requested through the PGC Data Access Portal at https://www.med.unc.edu/pgc/shared-methods/data-access-portal/.
The PGC-PTSD S-PrediXcan meta-analyses summary statistics generated by this study are available at: https://www.dropbox.com/sh/qjb2zlx8mcnz9cg/AADUBdFRP2hFnQHbwVTFADy3a?dl=0
The accession number for the Marine Resiliency Study (MRS) gene expression data reported in this paper is GEO: GSE64814.
The CommonMind Consortium(CMC) dorsolateral prefrontal cortex (DLPFC) Coexpression Networks from control subjects are available at: https://www.synapse.org/#!Synapse:syn7118802
Open source scripts used in this study include
FGSEA: https://bioconductor.org/packages/release/bioc/html/fgsea.html (Korotkevich et al., 2019);
gcrma: https://www.bioconductor.org/packages/release/bioc/html/gcrma.html (Wu et al., 2020);
limma: http://bioconductor.org/packages/release/bioc/html/limma.html (Ritchie et al., 2015);
MAGMA: https://ctg.cncr.nl/software/magma/ (de Leeuw et al., 2015);
METAL: http://csg.sph.umich.edu/abecasis/metal/ (Willer et al., 2010);
PrediXcan: https://github.com/hakyimlab/PrediXcan (Gamazon et al., 2015);
S-PrediXcan: https://github.com/hakyimlab/MetaXcan (Barbeira et al., 2018).