Abstract
It is well known that there exist preferred landing positions for eye fixations in visual word recognition. However, the existence of preferred landing positions in face recognition is less well established. It is also unknown how many fixations are required to recognize a face. To investigate these questions, we recorded eye movements during face recognition. During an otherwise standard face-recognition task, subjects were allowed a variable number of fixations before the stimulus was masked. We found that optimal recognition performance is achieved with two fixations; performance does not improve with additional fixations. The distribution of the first fixation is just to the left of the center of the nose, and that of the second fixation is around the center of the nose. Thus, these appear to be the preferred landing positions for face recognition. Furthermore, the fixations made during face learning differ in location from those made during face recognition and are also more variable in duration; this suggests that different strategies are used for face learning and face recognition.
Research on reading has consistently demonstrated the existence of preferred landing positions (PLPs; Rayner, 1979) in sentence reading and of optimal viewing positions (OVPs; O’Regan, Lévy-Schoen, Pynte, & Brugaillère, 1984) in isolatedword recognition. PLPs are the locations where people fixate their eyes most often during reading; OVPs are the locations where the initial fixation is directed when the best recognition performance for isolated words is obtained. For English readers, both PLPs and OVPs have been shown to be to the left of the word’s center (Brysbaert & Nazir, 2005). It has been argued that PLPs and OVPs reflect the interplay of multiple variables, including the difference in visual acuity between fovea and periphery, the information profiles of words, perceptual learning, and hemispheric asymmetry (Brysbaert & Nazir, 2005).
Like reading, face recognition is an overlearned skill, and it is learned even earlier in life. However, it remains unclear whether PLPs or OVPs also exist in face recognition. Faces are much larger than words, and thus more fixations may be required to recognize a face; nevertheless, eye movements might be unnecessary because faces are processed holistically (e.g., Farah, Wilson, Drain, & Tanaka, 1995). Yet studies have suggested that face-recognition performance is related to eye movement behavior (e.g., Althoff & Cohen, 1999). Henderson, Williams, and Falk (2005) restricted the locations of participants’ fixations during face learning and found that eye movements during face recognition did not change as a result of this restriction. They concluded that eye movements during recognition have functional roles and are not just a recapitulation of those produced during learning (cf. Mäntylä & Holm, 2006). However, the functional roles of eye movements in face recognition remain unclear: Do all fixations contribute to recognition performance? Specifically, how many fixations does one really need to recognize a face, and what are their preferred locations?
In the study reported here, we addressed these questions by manipulating the number of fixations that participants were allowed to make during face recognition. In contrast to the study of Henderson et al. (2005), in which fixations during face learning were restricted to the center of the face, participants were able to move their eyes freely in our experiment. However, during recognition, participants were restricted in the maximum number of fixations they were allowed (one, two, or three) on some trials; when there was a restriction, the face was replaced by a mask after the maximum number was reached. Thus, we were able to examine the influence of the number of fixations on face-recognition performance when participants made natural eye movements. Also, whereas Henderson et al. analyzed the total fixation time in each of several face regions and the number of trials in which each region received at least one fixation, we analyzed the exact locations and durations of the fixations.
Previous studies have shown that participants look most often at the eyes, nose, and mouth during face recognition (e.g., Barton, Radcliffe, Cherkasova, Edelman, & Intriligator, 2006), and studies using the Bubbles procedure have shown that the eyes are the most diagnostic features for face identification (e.g., Schyns, Bonnar, & Gosselin, 2002). Thus, one might predict that three to four fixations are required to recognize a face, and that the first two fixations are on the eyes. Recent computational models of face recognition have incorporated eye fixations (e.g., Lacroix, Murre, Postma, & Van den Herik, 2006). The NIMBLE model (Barrington, Marks, & Cottrell, 2007) achieves above-chance performance on face-recognition tasks when a single fixation is used (the area under the receiver-operating-characteristic curve is approximately 0.6, with chance level being 0.5), and performance improves and then levels off with an increasing number of fixations. Therefore, we predicted that participants would achieve above-chance performance with a single fixation, and have better performance when more fixations were allowed, up to some limit.
METHOD
Materials
The materials consisted of gray-scale, front-view images of the faces of 16 men and 16 women. The images measured 296 × 240 pixels and were taken from the FERET database (Phillips, Moon, Rauss, & Rizvi, 2000). Another 16 images of male faces and 16 images of female faces were used as foils. All images were of Caucasians with neutral expressions and no facial hair or glasses. We aligned the faces without removing configural information by rotating and scaling them so that the triangle defined by the eyes and mouth was at a minimum sum squared distance from a predefined triangle (Zhang & Cottrell, 2006). During the experiment, the face images were presented on a computer monitor. Each image was 6.6 cm wide on the screen, and participants’ viewing distance was 47 cm; thus, each face spanned about 8° of visual angle, equivalent to the size of a real face at a viewing distance of 100 cm (about the distance between two persons during a normal conversation; cf. Henderson et al., 2005). Approximately one eye on a face could be foveated at a time.
Participants
Sixteen Caucasian students from the University of California, San Diego (8 male, 8 female; mean age = 22 years 9 months), participated in the study. They were all right-handed according to the Edinburgh Handedness Inventory (Oldfield, 1971); all had normal or corrected-to-normal vision. They participated for course credit or received a small honorarium for their participation.
Apparatus
Eye movements were recorded with an EyeLink II eye tracker. Binocular vision was used; the data of the eye yielding less calibration error were used for analysis. The tracking mode was pupil only, with a sample rate of 500 Hz. A chin rest was used to reduce head movement. In data acquisition, three thresholds were used for saccade detection: The motion threshold was 0.1° of visual angle, the acceleration threshold was 8,000°/s2, and the velocity threshold was 301/s. These are the EyeLink II defaults for cognitive research. A Cedrus RB-830 (San Pedro, CA) response pad was used to collect participants’ responses.
Design
The experiment consisted of a study and a test phase. In the study phase, participants saw the 32 faces one at a time, in random order. Each face was presented for 3 s. In the test phase, they saw the same 32 faces plus the 32 foils one at a time and were asked to indicate whether or not they had seen each face in the study phase by pressing the “yes” or “no” button on the response pad. The time limit for response was 3 s. Between the study and test phases, participants completed a 20-min visual search task that did not contain any facelike images.
The design had one independent variable: number of permissible fixations at test (one, two, three, or no restriction). The dependent variable was discrimination performance, measured by A′, a bias-free nonparametric measure of sensitivity. The value of A′ varies from .5 to 1.0; higher A′ indicates better discrimination. Unlike d′, A′ can be computed when cells with zero responses are present.1 In the analysis of eye movement data, the independent variables were phase (study or test) and fixation (first, second, or third);2 the dependent variables were fixation location and fixation duration. During the test phase, the 32 studied faces were divided evenly into the four fixation conditions, counterbalanced through a Latin square design. To counterbalance possible differences between the two sides of the faces, we tested half of the participants with mirror images of the original stimuli.
Procedure
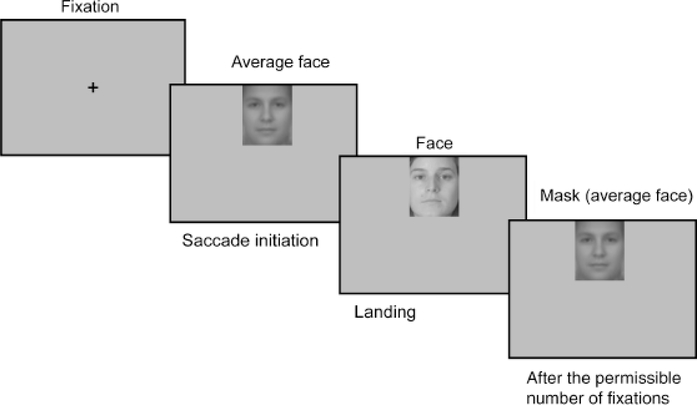
The standard nine-point EyeLink II calibration procedure was administered in the beginning of both phases, and was repeated whenever the drift-correction error was larger than 1° of visual angle. In both phases, each trial started with a solid circle at the center of the screen. For purposes of drift correction, participants were asked to accurately fixate the circle. The circle was then replaced by a fixation cross, which stayed on screen for 500 ms or until the participant accurately fixated it. The average face (the pixel-wise average of all the faces in the materials) was then presented either on the top or on the bottom of the screen, and was replaced by the target image as soon as a saccade from the cross toward the image was detected (see Fig. 1; the refresh rate of the monitor was 120 Hz). Thus, participants received reliable face-identity information only after the initial saccade. The direction of the initial saccade (up or down) for each image was counterbalanced across participants.
Fig. 1.
Display sequence in the test phase. After the fixation cross, the average face image was presented either on the top or on the bottom of the screen. It was replaced by the target image as soon as a saccade from the fixation cross toward the image was detected. The image remained on the screen until the participant’s eyes moved away from the last permissible fixation (if the number of fixations was restricted), the participant responded, or 3 s had elapsed. The image was masked by the average face after the permissible number of fixations or after 3 s had elapsed. The sequence ended after the participant’s response. The display sequence during the study phase was the same as that during the test phase except that the image always stayed on the screen for 3 s (i.e., there was no restriction on the number of fixations, and no response was required) and there was no mask.
During the study phase, the target image stayed on the screen for 3 s. During the test phase, the image remained on the screen until the participant’s eyes moved away from the last permissible fixation (if a restriction was imposed), the participant responded, or 3 s had elapsed. The image was replaced by the average face as a mask after the permissible number of fixations (if a restriction was imposed) or after 3 s had elapsed; the mask stayed on the screen until the participant responded (Fig. 1). The next trial began immediately after a response was made. Participants were asked to respond as quickly and accurately as possible, and were not told about the association between the mask and the number of fixations they made. The fixation conditions were randomized, so that even if participants were aware of this manipulation, they were not able to anticipate the fixation condition in each trial.
RESULTS
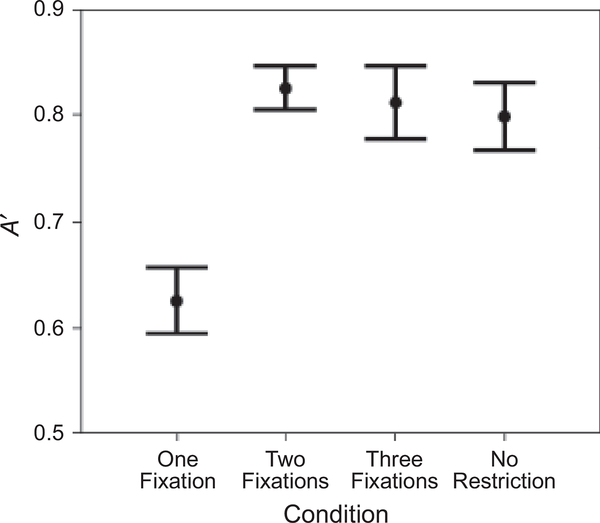
Repeated measures analyses of variance were conducted. Recognition performance, measured by A′, showed an effect of the number of permissible fixations, F(3, 45) = 11.722, p < .001, prep = .999, ηp2 = .439 (Fig. 2): A′ was significantly better in the two-fixation condition than in the one-fixation condition, F(1, 15) = 44.435, p < .001, prep = .999, ηp2 = .748; in contrast, A′ values in the two-fixation, three-fixation, and norestriction conditions were not significantly different from each other. Performance was above chance in the one-fixation condition, F(1, 15) = 16.029, p = .001, prep = .986, ηp2 = .517 (the average A′ was .63).
Fig. 2.
Participants’ discrimination performance (A′) in the four fixation conditions: one fixation, two fixations, three fixations, and no restriction. Error bars show standard errors.
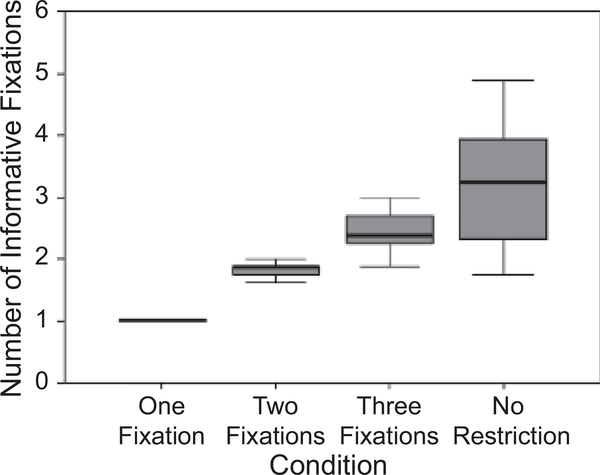
Figure 3 shows a box plot of the average number of informative fixations (i.e., fixations that landed on the face before the mask and the response; participants were allowed to respond before they reached the fixation limit) in each fixation condition. Because participants required at least one fixation to actually see the face, all participants made exactly one fixation in the one-fixation condition. The variability in the other conditions reflects the fact that, occasionally, participants did not use all the fixations available to them. When two fixations were allowed, participants made 1.81 fixations on average; in contrast, when there was no restriction, participants made 3.28 fixations on average. Nevertheless, performance did not improve when the average number of fixations was greater than 1.81.
Fig. 3.
Box plot of the average number of informative fixations (i.e., fixations that landed on the face stimulus before the mask appeared and before the response) in the four fixation conditions. For each condition, the shaded area constitutes 50% of the distribution.
The horizontal locations of fixations (x direction) showed that the distributions of the first two fixations in the test phase were both around the center of the nose, but significantly different from each other, F(1, 15) = 5.145, p = .039, prep = .894, ηp2 = .255. The first fixation was significantly to the left of the center (, SE = 3.2; X = 120.5 at the center because the image width was 240 in pixels; see Table 1), F(1, 15) = 5.208, p = .037, prep = .897, ηp2 = .258, whereas the second fixation was not significantly away from the center (, SE = 3.2). The first fixation during the study phase also had a leftward tendency (, SE = 2.6), F(1, 15) = 3.511, p = .081, prep = .839, ηp2 = .190.
TABLE 1.
Mean Locations and Durations of Fixations and Saccade Length During the Study and Test Phases
| Phase and fixation number | Coordinate (pixel) |
Duration (ms) | Length of saccade from the previous fixation (pixels) | |
|---|---|---|---|---|
| x | y | |||
| Study | ||||
| 1 | 115.6 (2.6) | 128.8 (5.3) | 235 (15) | — |
| 2 | 117.6 (4.6) | 119.3 (5.1) | 283 (28) | 55.7 (3.0) |
| 3 | 123.8 (5.4) | 116.0 (3.3) | 340 (26) | 49.0 (2.2) |
| Test | ||||
| 1 | 113.3 (3.2) | 131.2 (5.9) | 295 (23) | — |
| 2 | 118.7 (3.2) | 133.0 (3.0) | 315 (15) | 51.4 (4.1) |
| 3 | 119.3 (4.0) | 121.0 (3.8) | 287 (14) | 53.4 (6.2) |
Note. Standard errors are given in parentheses. The center of the image (in pixels) was at (x, y) = (120.5, 148.5); the size of the image was 240 pixels (width) × 296 pixels (height).
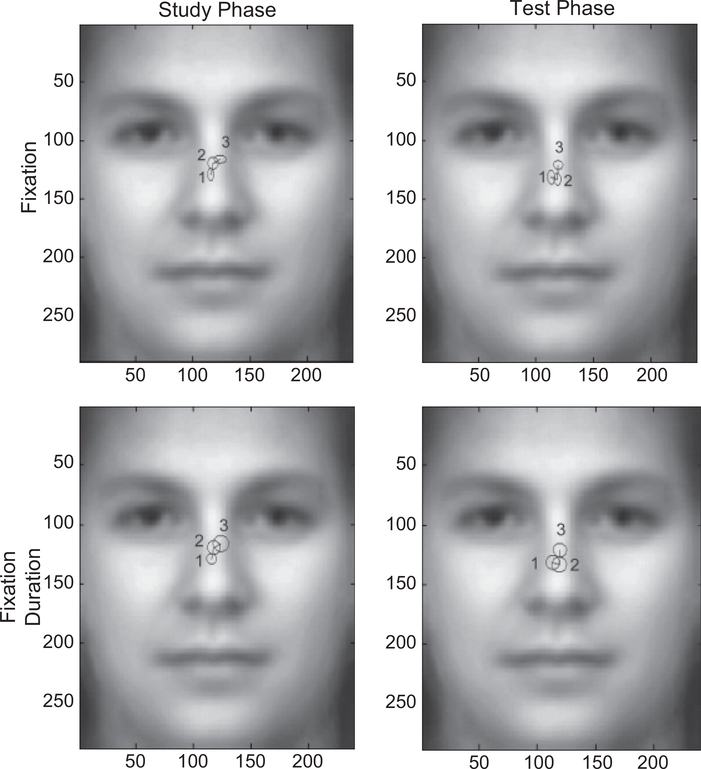
The vertical locations of fixations (y direction) showed an effect of phase, F(1, 15) = 5.288, p = .036, prep = .898, ηp2 = .261: Fixations were lower in the test phase than in the study phase (see Fig. 4, top panel). In addition, during the study phase, the three fixations differed significantly in their vertical location, F(2, 30) = 3.896, p = .040, prep = .892, ηp2 = .206, whereas during the test phase, they did not (F = 2.494). During the study phase, there was also a significant linear trend, F(1, 15) = 7.185, p = .017, prep = .933, ηp2 = .324, with eye movements moving upward from the first to the third fixation. These results suggest that participants adopted slightly different eye movement strategies in the two phases. In a separate analysis, we used a linear mixed model to examine all (informative) fixations from all participants without averaging them by subjects, and the same effects (in both the horizontal and the vertical directions) held (see Fig. 5).3
Fig. 4.
Average fixation locations (upper panel) and fixation durations (lower panel) of the first three fixations in the study (left) and test (right) phases. The numbers along the axes show locations in pixels. In the upper panel, the radii of the ellipses show standard errors of the locations. In the bottom panel, the radii of the circles show duration of the fixations at these locations (1 pixel = 50 ms).
Fig. 5.
Probability density distributions of the first three fixations and of all fixations (data not averaged by subjects) during the study and test phases. A Gaussian distribution with a standard deviation equal to 8 pixels was applied to each fixation to smooth the distribution.
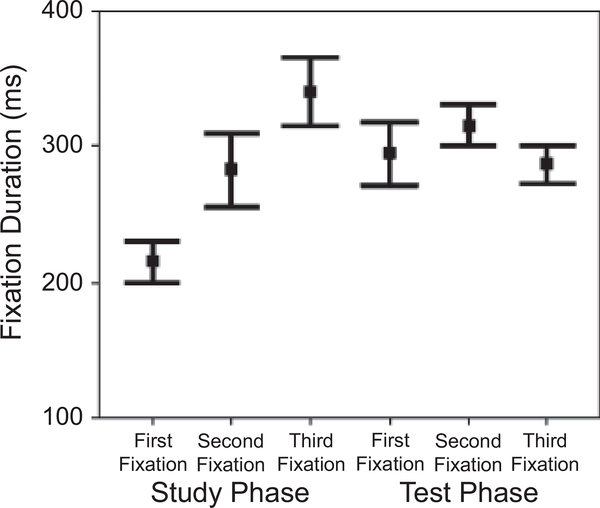
The fixation-duration data showed an interaction between phase and fixation, F(2, 30) = 13.292, p < .001, prep = .994, ηp2 = .470: The effect of fixation was significant during the study phase, F(2, 30) = 21.940, p < .001, prep = .999, ηp2 = .594, but not during the test phase (see Fig. 6; also see Fig. 4, bottom panel). During the study phase, participants first made a short fixation and then gradually increased the duration of subsequent fixations, whereas during the test phase, there was no significant difference among the three fixations. This result also suggests that participants adopted different strategies during the two phases.
Fig. 6.
Duration of the first three fixations during the study and test phases. Error bars show standard errors.
The results showed that participants performed better when given two fixations than when given one fixation; however, it is possible that this improvement was simply due to longer viewing time in the two-fixation condition. To examine whether this was the case, we conducted a follow-up experiment comparing one- and two-fixation conditions with the same total fixation duration. We recruited 6 male and 10 female Caucasian students at the University of California, San Diego (mean age = 22 years); all participants were right-handed and had normal or corrected-tonormal vision. The same apparatus, design, and procedure from the main experiment were used, except that there were only two fixation conditions at test. In each trial, the total fixation duration was 610 ms, which is the sum of the average durations of the first two fixations in the main experiment. In the one-fixation condition, after participants made the first fixation to the face image, the image moved with their gaze (i.e., the display became gaze contingent); thus, the location of their first fixation was the only location they could look at. In the two-fixation condition, the image became gaze contingent after a second fixation. Participants were told only that the image might move during the presentation, and we confirmed individually after the experiment that no participants were aware of the gaze-contingent design during the experiment.4
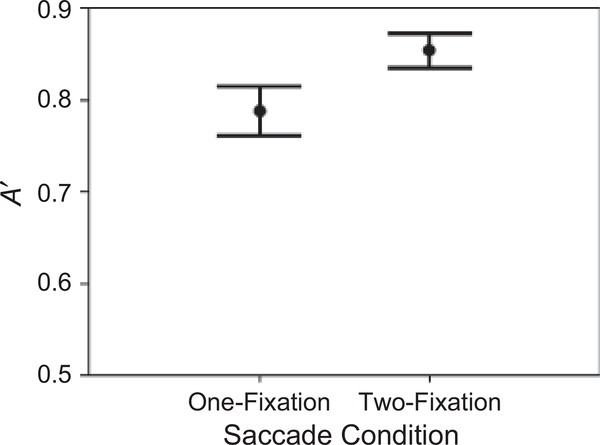
The results showed an effect of fixation condition on discrimination performance, F(1, 15) = 6.847, p < .05, prep = .929, ηp2 = .313 (see Fig. 7): A′ was significantly better in the two-fixation condition than in the one-fixation condition. This result indicates that, given the same total fixation duration, participants performed better when they were allowed to make a second fixation to obtain information from a second location than when they could look only at a single location. This suggests that the advantage of the two-fixation condition in the main experiment was not purely due to the longer total fixation duration.
Fig. 7.
Participants’ discrimination performance (A′) in the follow-up experiment, which compared one- and two-fixation conditions with the same total fixation duration. Error bars show standard errors.
DISCUSSION
We examined the influence of the number of eye fixations on face-recognition performance. We showed that when only one fixation was allowed, participants’ performance was above chance, which suggests that they were able to recognize a face with one fixation. Participants performed better when two fixations were allowed; there was no further performance improvement with more than two fixations, which suggests that two fixations suffice in face recognition.
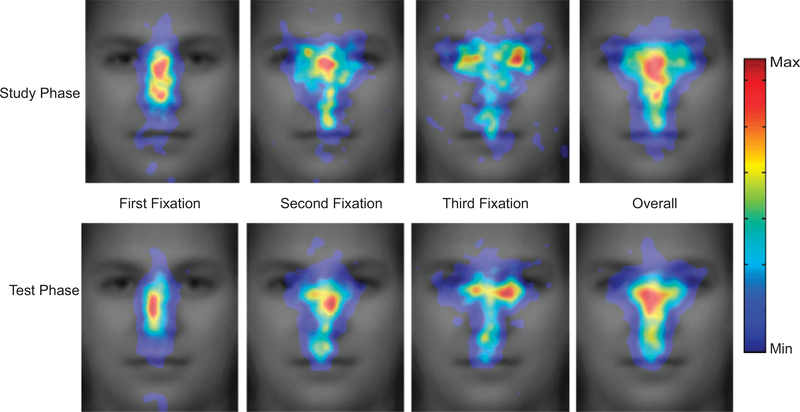
The distributions of the first two fixations were both around the center of the nose, with the first fixation being slightly to the left. Note that this result is different from the prediction we drew from the existing literature. A major difference between our study and previous ones is that in previous studies, a trial started from the center of the face, and hence the first saccade was usually away from the center (mostly to the eyes; e.g., Henderson et al., 2005). In our study, to examine the PLP of the first fixation, we initially presented the face parafoveally, so that participants had to make an initial saccade to the face. Thus, we were able to show that the first two fixations, which are critical to face-recognition performance, are around the center of the face. Participants did start to look at the eyes at the third fixation (Fig. 5), a result consistent with the existing literature.
Previous studies using the Bubbles procedure showed that the eyes are the most diagnostic features for face identification (e.g., Schyns et al., 2002). Standard approaches to modeling eye fixation and visual attention are usually based on a saliency map, calculated according to biologically motivated feature selection or information maximization (e.g., Itti, Koch, & Niebur, 1998; Yamada & Cottrell, 1995). These models predict fixations on the eyes when observers view faces; however, our results showed a different pattern and suggest that eye movements in face recognition are different from those in scene viewing or visual search. Also, recent research has suggested a dissociation between face and object recognition: Faces are represented and recognized holistically, so their representations are less part based than those of objects (e.g., Farah et al., 1995). Our finding that the first two fixations were around the center of the nose instead of the eyes is consistent with this previous finding. It is also consistent with previous successful computational models of face recognition that used a whole-face templatelike representation (e.g., Dailey & Cottrell, 1999; O’Toole, Millward, & Anderson, 1988).
Our results are consistent with the view that face-specific effects are, in fact, expertise-specific (e.g., Gauthier, Tarr, Anderson, Skudlarski, & Gore, 1999). Because of familiarity with the information profile of faces, fixations on individual features may only generate redundant processes; a more efficient strategy is to get as much information as possible with just one fixation. Given a perceptual span large enough to cover the whole stimulus, and given the fact that visual acuity drops from fovea to periphery, this fixation should be at the center of the information, where the information is balanced in all directions; the center of the information may also be the OVP in word recognition. Indeed, it has been shown that the OVP can be modeled by an algorithm that calculates the center of the information (Shillcock, Ellison, & Monaghan, 2000). Our data showed that the first two fixations were, indeed, around the center of the nose. Note that it is an artifact of averaging that they look very close to each other in Figure 4 (as Fig. 5 reveals); the distributions of their locations were significantly different from each other. To further quantify this difference, we compared the lengths of saccades (in pixels) from the first to the second fixation during the study and test phases (see Table 1), and found that the saccade lengths during the test phase were not significantly shorter than those during the study phase. In contrast, the two phases differed significantly in the durations of the first two fixations (see Table 1 and Fig. 6): Fixations were longer at test, F(1, 15) = 18.352, p = .001, prep = .988, ηp2 = .550. Hence, even though two fixations suffice in face recognition, they are relatively long fixations. Our follow-up experiment also shows that, given the same total fixation duration, participants perform better when they are allowed to make two fixations than when they are allowed to make only one. This suggests that the second fixation has functional significance: to obtain more information from a different location.
The fact that the first fixation is to the left of the center is consistent with the left-side bias in face perception (Gilbert & Bakan, 1973): A chimeric face made from two left half-faces from the viewer’s perspective is judged more similar to the original face than is a chimeric face made from two right half-faces. It has been argued that the left-side bias is an indicator of right-hemisphere involvement in face perception (Burt & Perrett, 1997; Rossion, Joyce, Cottrell, & Tarr, 2003). Mertens, Siegmund, and Grusser (1993) reported that, in a visual memory task, the overall time that the fixations remained in the left gaze field was longer than the overall time that the fixations remained in the right gaze field when subjects viewed faces, but not vases. Leonards and Scott-Samuel (2005) showed that participants made their initial saccades to one side, mostly the left, when viewing faces, but not when viewing landscapes, fractals, or inverted faces. Using the Bubbles procedure, Vinette, Gosselin, and Schyns (2004) showed that the earliest diagnostic feature in face identification was the left eye. Joyce (2001) found that fixations during the first 250 ms in face recognition tended to be on the left half-face. Our results are consistent with these previous results.
Gosselin and Schyns (2001) argued that, in their study, the left eye was more informative than the right eye in face identification because the left side of the images used had more shadows and thus was more informative as to face shape. However, this artifact was not present in our study because we mirror-reversed the images on half of the trials. Thus, it must be a subject-internal bias that drives the left-side bias. It may be due to the importance of low-spatial-frequency information in face recognition (e.g., Dailey & Cottrell, 1999; Whitman & Konarzewski-Nassau, 1997) and the right hemisphere’s advantage in processing such information (Ivry & Robertson, 1999; Sergent, 1982). Because of the contralateral projection from the visual hemifields to the hemispheres, the left half-face from the viewer’s perspective has direct access to the right hemisphere when the face is centrally fixated. It has been shown that each hemisphere plays a dominant role in processing the stimulus half to which it has direct access (e.g., Hsiao, Shillcock, & Lavidor, 2006). Thus, the representation of the left half-face may be encoded by and processed in the right hemisphere, so that it is more informative than the right half-face.
There may be other factors that influence the OVP for face recognition. For example, the OVP may be influenced by the information profile relevant to a given task. Thus, different tasks involving the same stimuli may have different OVPs, especially when the distributions of information required are very different. The left-side bias might also be due to a biologically based face asymmetry that is normally evident in daily life (i.e., it may be that the left side of a real face usually has more information for face recognition than the right side does). In addition, Heath, Rouhana, and Ghanem (2005) showed that the left-side bias in perception of facial affect can be influenced by both laterality and script direction: In their study, right-handed readers of Roman script demonstrated the greatest leftward bias, and mixed-handed readers of Arabic script (i.e., script read from right to left) demonstrated the greatest rightward bias (cf. Vaid & Singh, 1989). In our study, the participants scanned the faces from left to right, consistent with their reading direction (the participants were all English readers). Further examinations are required to see whether Arabic readers have a different scan path for face recognition.
In summary, we have shown that two fixations suffice in face recognition; the distributions of the two fixations are both around the center of the nose, with the first one slightly but significantly to the left of the center. We argue that this location may be the center of the information, or the OVP, for face recognition. Different tasks involving the same stimuli may have different OVPs and PLPs, because they may require different information from the stimuli. Further research is needed to examine whether the PLPs in other tasks are also the OVPs and whether they are indeed located at the center of the information, and to identify the factors that influence eye fixations during face recognition.
Acknowledgments
We are grateful to the National Institutes of Health (Grant MH57075 to G.W. Cottrell), the James S. McDonnell Foundation (Perceptual Expertise Network, I. Gauthier, principal investigator), and the National Science Foundation (Grant SBE-0542013 to the Temporal Dynamics of Learning Center, G.W. Cottrell, principal investigator). We thank the editor and two anonymous referees for helpful comments.
Footnotes
A′ is calculated as follows: , where H and F are the hit rate and false alarm rate, respectively. The d′ measure may be affected by response bias when assumptions of normality and equal standard deviations are not met (Stanislaw & Todorov, 1999). In the current study, there was a negative response bias; indeed, the percentage of “no” responses was marginally above chance (p = .06).
We analyzed only the first three fixations because some participants did not make more than three fixations during the test phase. Greenhouse-Geisser correction was applied whenever the test of sphericity did not reach significance.
This analysis showed that for vertical location (y direction), there were significant effects of both phase, F(1, 1867.005) = 11.026, p = .001, prep = .986, and fixation, F(2, 1933.095) = 12.633, p < .001, prep = .999. The analysis also showed an effect of fixation on horizontal location (x direction), F(2, 1991.670) = 21.845, p < .001, prep > .999: The participants scanned from left to right in both phases; however, this effect was not significant in the analysis in which data were averaged by subject.
In the one-fixation condition, the average duration of the first fixation (before participants moved their eyes away and the image moved with their gaze) was 308 ms, which was not significantly different from the average duration of the first fixation in the two-fixation condition (311 ms; t test, n.s.) or in the main experiment (295 ms; t test, n.s.). This shows that the participants did not attempt to make longer fixations because of the gaze-contingent design.
REFERENCES
- Althoff RR, & Cohen NJ (1999). Eye-movement-based memory effect: A reprocessing effect in face perception. Journal of Experimental Psychology: Learning, Memory, and Cognition, 25, 997–1010. [DOI] [PubMed] [Google Scholar]
- Barrington L, Marks T, & Cottrell GW (2007). NIMBLE: A kernel density model of saccade-based visual memory In McNamara DS & Trafton JG (Eds.), Proceedings of the 29th Annual Conference of the Cognitive Science Society (pp. 77–82). Austin, TX: Cognitive Science Society. [Google Scholar]
- Barton JJS, Radcliffe N, Cherkasova MV, Edelman J, & Intriligator JM (2006). Information processing during face recognition: The effects of familiarity, inversion, and morphing on scanning fixations. Perception, 35, 1089–1105. [DOI] [PubMed] [Google Scholar]
- Burt DM, & Perrett DI (1997). Perceptual asymmetries in judgements of facial attractiveness, age, gender, speech and expression. Neuropsychologia, 35, 685–693. [DOI] [PubMed] [Google Scholar]
- Brysbaert M, & Nazir T (2005). Visual constraints in written word recognition: Evidence from the optimal viewing-position effect. Journal of Research in Reading, 28, 216–228. [Google Scholar]
- Dailey MN, & Cottrell GW (1999). Organization of face and object recognition in modular neural networks. Neural Networks, 12, 1053–1074. [DOI] [PubMed] [Google Scholar]
- Farah MJ, Wilson KD, Drain M, & Tanaka JN (1995). What is “special” about face perception? Psychological Review, 105, 482–498. [DOI] [PubMed] [Google Scholar]
- Gauthier I, Tarr MJ, Anderson AW, Skudlarski P, & Gore JC (1999). Activation of the middle fusiform “face area” increases with expertise in recognizing novel objects. Nature Neuroscience, 2, 568–573. [DOI] [PubMed] [Google Scholar]
- Gilbert C, & Bakan P (1973). Visual asymmetry in perception of faces. Neuropsychologia, 11, 355–362. [DOI] [PubMed] [Google Scholar]
- Gosselin F, & Schyns PG (2001). Bubbles: A technique to reveal the use of information in recognition tasks. Vision Research, 41, 2261–2271. [DOI] [PubMed] [Google Scholar]
- Heath RL, Rouhana A, & Ghanem DA (2005). Asymmetric bias in perception of facial affect among Roman and Arabic script readers. Laterality, 10, 51–64. [DOI] [PubMed] [Google Scholar]
- Henderson JM, Williams CC, & Falk RJ (2005). Eye movements are functional during face learning. Memory & Cognition, 33, 98–106. [DOI] [PubMed] [Google Scholar]
- Hsiao JH, Shillcock R, & Lavidor M (2006). ATMS examination of semantic radical combinability effects in Chinese character recognition. Brain Research, 1078, 159–167. [DOI] [PubMed] [Google Scholar]
- Itti L, Koch C, & Niebur E (1998). A model of saliency based visual attention for rapid scene analysis. IEEE Transactions on Pattern Analysis and Machine Intelligence, 20, 1254–1259. [Google Scholar]
- Ivry RB, & Robertson LC (1999). The two sides of perception. Cambridge, MA: MIT Press. [Google Scholar]
- Joyce CA (2001). Saving faces: Using eye movement, ERP, and SCR measures of face processing and recognition to investigate eyewitness identification. Dissertation Abstracts International B: The Sciences and Engineering, 61 (08), 4440 (UMI No. 72775540) [Google Scholar]
- Lacroix JPW, Murre JMJ, Postma EO, & Van den Herik HJ (2006). Modeling recognition memory using the similarity structure of natural input. Cognitive Science, 30, 121–145. [DOI] [PubMed] [Google Scholar]
- Leonards U, & Scott-Samuel NE (2005). Idiosyncratic initiation of saccadic face exploration in humans. Vision Research, 45, 2677–2684. [DOI] [PubMed] [Google Scholar]
- Mäntylä T, & Holm L (2006). Gaze control and recollective experience in face recognition. Visual Cognition, 13, 365–386. [Google Scholar]
- Mertens I, Siegmund H, & Grusser OJ (1993). Gaze motor asymmetries in the perception of faces during a memory task. Neuropsychologia, 31, 989–998. [DOI] [PubMed] [Google Scholar]
- Oldfield RC (1971). The assessment and analysis of handedness: The Edinburgh Inventory. Neuropsychologia, 9, 97–113. [DOI] [PubMed] [Google Scholar]
- O’Regan JK, Lévy-Schoen A, Pynte J, & Brugaillère B (1984). Convenient fixation location within isolated words of different length and structure. Journal of Experimental Psychology: Human Perception and Performance, 10, 250–257. [DOI] [PubMed] [Google Scholar]
- O’Toole AJ, Millward RB, & Anderson JA (1988). A physical system approach to recognition memory for spatially transformed faces. Neural Networks, 1, 179–199. [Google Scholar]
- Phillips PJ, Moon H, Rauss PJ, & Rizvi S (2000). The FERET evaluation methodology for face recognition algorithms. IEEE Transactions on Pattern Analysis and Machine Intelligence, 22, 1090–1104. [Google Scholar]
- Rayner K (1979). Eye guidance in reading: Fixation locations within words. Perception, 8, 21–30. [DOI] [PubMed] [Google Scholar]
- Rossion B, Joyce CA, Cottrell GW, & Tarr MJ (2003). Early lateralization and orientation tuning for face, word, and object processing in the visual cortex. NeuroImage, 20, 1609–1624. [DOI] [PubMed] [Google Scholar]
- Schyns PG, Bonnar L, & Gosselin F (2002). Show me the features! Understanding recognition from the use of visual information. Psychological Science, 13, 402–409. [DOI] [PubMed] [Google Scholar]
- Sergent J (1982). The cerebral balance of power: Confrontation or cooperation? Journal of Experimental Psychology: Human Perception and Performance, 8, 253–272. [DOI] [PubMed] [Google Scholar]
- Shillcock R, Ellison TM, & Monaghan P (2000). Eye-fixation behavior, lexical storage, and visual word recognition in a split processing model. Psychological Review, 107, 824–851. [DOI] [PubMed] [Google Scholar]
- Stanislaw H, & Todorov N (1999). Calculation of signal detection theory measures. Behavior Research Methods, Instruments, & Computers, 31, 137–149. [DOI] [PubMed] [Google Scholar]
- Vaid J, & Singh M (1989). Asymmetries in the perception of facial affect: Is there an influence of reading habits? Neuropsychologia, 27, 1277–1287. [DOI] [PubMed] [Google Scholar]
- Vinette C, Gosselin F, & Schyns PG (2004). Spatio-temporal dynamics of face recognition in a flash: It’s in the eyes. Cognitive Science, 28, 289–301. [Google Scholar]
- Whitman D, & Konarzewski-Nassau S (1997). Lateralized facial recognition: Spatial frequency and masking effects. Archives of Clinical Neuropsychology, 12, 428. [Google Scholar]
- Yamada K, & Cottrell GW (1995). A model of scan paths applied to face recognition. In Proceedings of the 17th Annual Conference of the Cognitive Science Society, Pittsburgh, PA (pp. 55–60). Mahwah, NJ: Erlbaum. [Google Scholar]
- Zhang L, & Cottrell GW (2006). Look Ma! No network: PCA of Gabor filters models the development of face discrimination. In Proceedings of the 28th Annual Conference of the Cognitive Science Society, Vancouver, British Columbia, Canada (pp. 2428–2433). Mahwah, NJ: Erlbaum. [Google Scholar]


