Supplemental Digital Content is available in the text
Keywords: levocarnitine, liver cirrhosis, sarcopenia, skeletal muscle volume
Abstract
Sarcopenia has a negative impact on the prognosis of patients with liver cirrhosis (LC). We investigated the significance of skeletal muscle volume and its changes in LC patients taking levocarnitine (L-carnitine).
We retrospectively analyzed 51 LC patients taking L-carnitine from December 2012 to March 2019. Skeletal mass index was calculated as the left-right sum of the major × minor axis of psoas muscle at the third lumbar vertebra, divided by height squared (psoas muscle index [PMI]). Patients were classified into 2 groups (low and normal PMI) depending on PMI < 6.0 and < 3.4 cm2/m2 for men and women, respectively. Changes in PMI per month during L-carnitine administration (ΔPMI/m) were calculated, and we classified the patients into 2 groups (severe and mild muscle atrophy) depending on ΔPMI/m below the lower quartile. We assessed overall survival (OS).
At the start of L-carnitine administration, there were no significant differences in OS between groups with low and normal PMI. Multivariate analysis showed that ΔPMI/m (hazard ratio [HR], 0.007; P = .005) and L-carnitine administration period (HR, 0.956; P = .021) were significantly associated with OS. Patients with severe muscle atrophy had a significantly lower OS than those with mild muscle atrophy. There was the positive correlation relationship between ΔPMI/m and L-carnitine administration period.
Among LC patients taking L-carnitine, progressive muscle volume loss was a predictor of poor prognosis. L-carnitine administration for longer may be able to prevent muscle volume loss and lead to a better prognosis in LC patients.
1. Introduction
Sarcopenia is defined as skeletal muscle volume loss and a decrease of muscle strength.[1] One report showed that skeletal muscle mass decreased by 2.2% per year in patients with liver cirrhosis (LC), and the rate of decrease increased in parallel with the severity of cirrhosis.[2] Sarcopenia has a negative impact on mortality in patients with LC or hepatocellular carcinoma (HCC).[3–6]
Levocarnitine (L-carnitine) transports long chain fatty acids from the cytosol into the mitochondorial matrix for subsequent β-oxidation. About 75% of L-carnitine is absorbed from food such as beef, lamb, fish and milk, and 25% is synthesized in the kidney and liver.[7–10] Most L-carnitine in the body is maintained in the skeletal muscle.[7–10] Deficiency of L-carnitine is classified as primary, due to organic cation transporter 2 deficiency, and secondary, due to LC, Fanconi syndrome, dialysis, or other factors.[11] L-carnitine deficiency leads to metabolic disorders that impact fatty acids and carbohydrates.[12] L-carnitine administration is effective not only for these symptoms but also for sarcopenia in elderly persons.[13] Previous studies reported that L-carnitine administration prevented skeletal muscle volume loss in patients with LC.[14,15] However, these studies did not show an association between L-carnitine administration and prognosis. The present study aimed to investigate whether L-carnitine administration improved muscle volume loss or prognosis in patients with LC.
2. Methods
2.1. Patients
We retrospectively analyzed 70 patients with LC who took L-carnitine between December 2012 and March 2019 at Fukushima Medical University Hospital. The patients took L-carnitine because of hepatic encephalopathy (HE), hyperammonemia, muscle cramps, fatigue, or a combination of these conditions. When there was no effect, when the symptoms improved and the patients wanted to stop taking L-carnitine, or when administration of L-carnitine became difficult due to deterioration of the condition, administration of L-carnitine was discontinued. The dose of L-carnitine was determined at the discretion of the attending physician. All patients had undergone computed tomography (CT) within 3 months before or after the start of L-carnitine administration. Furthermore, they had undergone CT again within 3 months before or after the end of L-carnitine administration. We excluded 19 patients who had not undergone 2 CTs.
We diagnosed patients as having LC based on laboratory data, imaging such as CT or magnetic resonance imaging (MRI), elastography such as MRI or share wave imaging in ultrasonography, and liver biopsy. The ethics committee of Fukushima Medical University School of Medicine approved the study protocol (No. 2019–203), which complied with the Helsinki Declaration.
2.2. Evaluation of HCC, skeletal muscle volume loss, and other variables
The Japan Society of Hepatology (JSH) guidelines for sarcopenia in liver disease recommend using grip strength and skeletal mass index (SMI, muscle mass of all 4 limbs determined using bioelectrical impedance analysis [BIA] divided by height squared) for a diagnosis of sarcopenia.[16] Because this study was a retrospective study, and grip strength was not measured in all patients, we identified skeletal muscle volume loss by SMI alone. SMI calculated as the left-right sum of the major × minor axis of the psoas muscle at the third lumber vertebra (L3) on CT, divided by height squared (psoas muscle index [PMI]) is regarded as simple method to assess SMI (Fig. 1A) .[16] This measuring method is indirectly correlated with SMI using BIA.[16] Thus, we used PMI in the present study. Patients were classified into a low PMI group (PMI < 6.0 cm2/m2 for men and < 3.4 cm2/m2 for women), and a normal PMI group (PMI ≥ 6.0 cm2/m2 for men and ≥ 3.4 cm2/m2 for women), based on the Japanese guidelines for sarcopenia in liver disease.[16] We defined the administration period (months) as the period from the time of start of L-carnitine administration (Pre) to the time of end of L-carnitine administration or observation (Post) (Fig. 1B). The monthly change in PMI during the administration period (ΔPMI/month [ΔPMI/m]) was calculated using the following formula: (L3 PMI [Post CT] - L3 PMI [Pre CT])/administration period as an index of progressive muscle atrophy. Patients were classified into 2 groups (severe and mild muscle atrophy) depending on ΔPMI/m below or above the lower quartile. We evaluated overall survival (OS, months), characteristics including age, liver function reserves, presence of HCC, stage of HCC, and laboratory findings. HCC was diagnosed and evaluated by CT or MRI. Tumor node metastasis stage was determined based on the Japanese criteria.[17]
Figure 1.
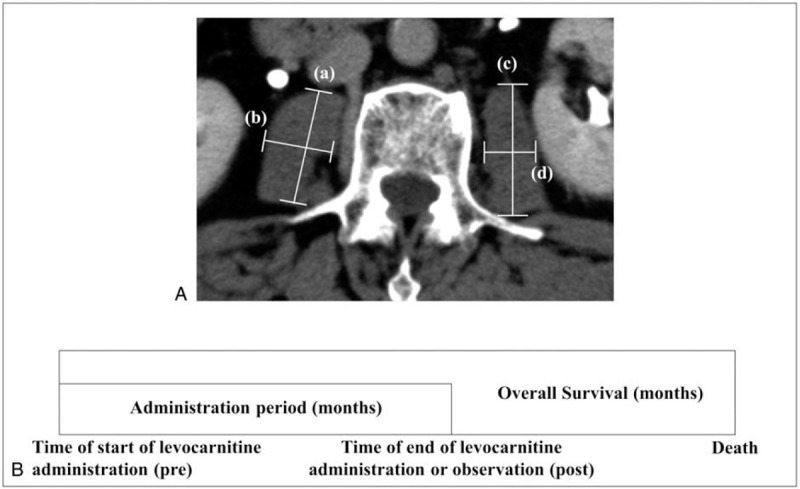
A. Computed tomography showing the psoas muscle at the third lumber vertebra. The length of the major or minor axis was indicated as (A)-(D). B. Overall survival was defined as the period from the time of start of levocarnitine (L-carnitine) administration to death. Administration period was defined as the period from the time of start of L-carnitine administration (Pre) to the end of L-carnitine administration (Post).
2.3. Statistical analysis
Continuous variables were expressed as medians and ranges. The 2 PMI groups were compared using the χ2 test and Fisher exact test for categorical variables and the Mann-Whitney U-test for continuous variables. OS was evaluated by the Kaplan-Meier analysis (using the log-rank test). We determined risk factors for OS using Cox hazard analysis. If there were missing values, statistical analysis was performed with available data. All P-values were 2-tailed, and P-values < .05 were considered statistically significant. Statistical analyses were performed using Easy R (Available at: http://www.jichi.ac.jp/saitama-sct/SaitamaHP.files/statmed.html).[18]
3. Results
3.1. Baseline characteristics
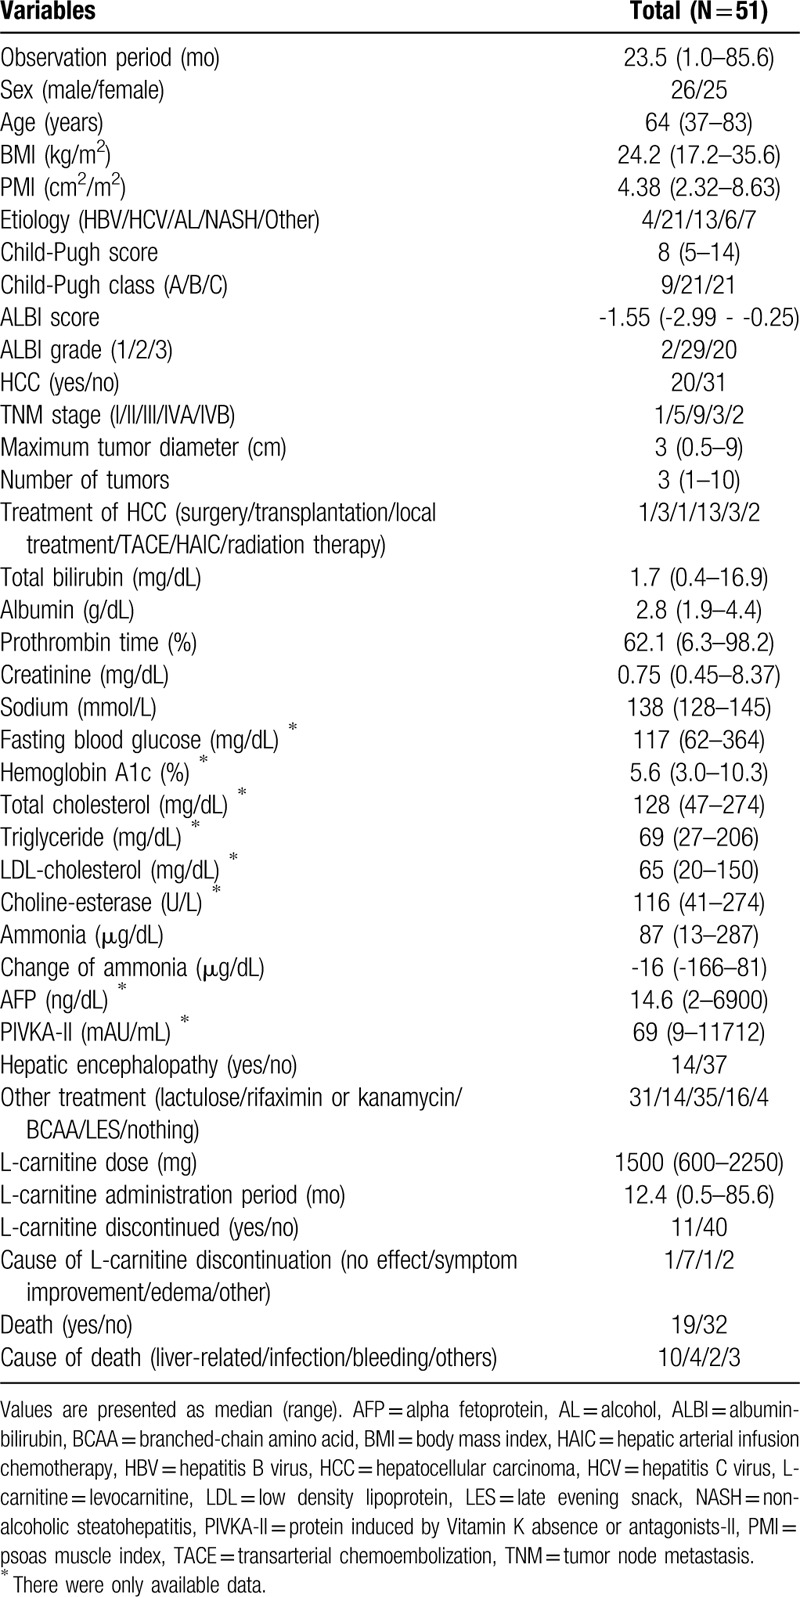
Table 1 shows baseline characteristics of all patients at the start of L-carnitine administration. The median age was 64 years (range, 37–83 years), and 26 patients (50.9%) were men. The median observation period was 23.5 months (range, 1.0–85.6 months). There were only 2 patients with good liver function reserves of albumin-bilirubin (ALBI) grade 1. Twenty patients (39.2%) had HCC, and 14 patients (27.5%) had hepatic encephalopathy. The median dose of L-carnitine was 1500 mg (600–2250 mg). The median administration period of L-carnitine was 12.4 months (0.5–85.6 months). Eleven patients (21.6%) discontinued L-carnitine due to lack of effect in 1 patient (9.1%), symptom improvement in 7 patients (63.6%), edema in 1 patient (9.1%), and other causes in 2 patients (18.2%). Nineteen patients (37.3%) died during the follow-up period. Causes of death were liver-related in 10 patients (52.6%), infection in 4 patients (21.1%), gastrointestinal bleeding in 2 patients (10.5%), and other causes in 3 patients (15.8%). Sixteen patients (31.4%) were treated with late evening snack administration with branched chain amino acids.
Table 1.
Baseline characteristics of participants.
Supplemental digital content (Table S1) shows baseline characteristics of patients who have never had HCC during observation period at the start of L-carnitine administration. Although observation period was longer than 1 of all patients, other characteristics were similar to those of all patients.
3.2. Changes in ammonia levels
In all patients, the median serum ammonia levels at Pre were 87 μg/dL (13–287 μg/dL) and those at Post were 62 μg/dL (-166–81 μg/dL). There was a significant difference in serum ammonia between Pre and Post (P = .001) (Fig. 2). In logistic regression analysis, there were no significant factors including age, sex, liver function reserves, dose and administration period of L-carnitine, or muscle volume loss in changes of ammonia between Pre and Post.
Figure 2.
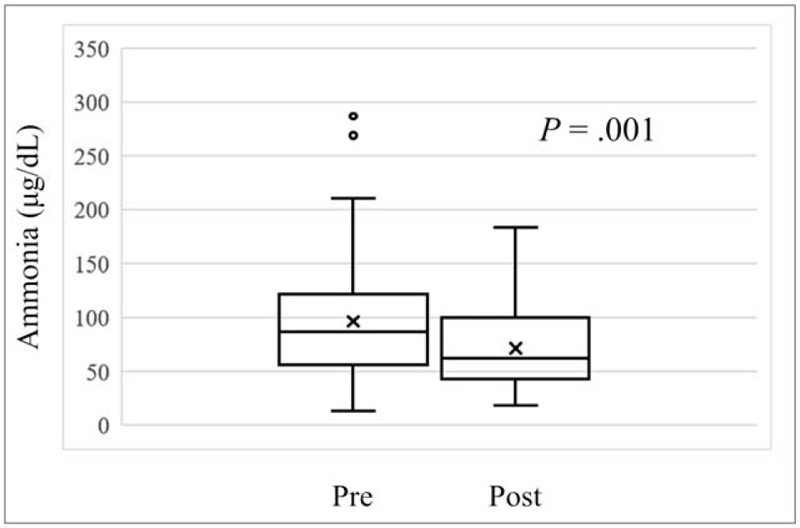
Serum ammonia levels at the end of levocarnitine (L-carnitine) administration (post) was significantly reduced compared to the start of L-carnitine (Pre) (P = .001).
There was also a significant difference in serum ammonia between Pre (median; 95 μg/dL, range; 13–189 μg/dL) and Post (median; 57 μg/dL, range; 20–136 μg/dL) in the patients who have never had HCC during observation period (P = .004) (Supplemental digital content [Figure S1]).
3.3. Comparison between groups with low and normal baseline PMI
Among all 51 patients, 33 (64.7%) were classified as having low PMI. There were no significant differences in age, liver function reserves such as Child-Pugh classification and ALBI grade, morbidity of HCC, stage of HCC (including number and size), laboratory findings including ammonia and its changes, or dose and administration period of L-carnitine between patients with low and normal PMI. Significantly more men had low PMI than normal PMI (P = .016) (Table 2). Moreover, BMI was significantly lower in those with low PMI than in those with normal PMI (median, 23.1 vs. 26.1 kg/m2; P = .043). There was no significant difference in OS between the low PMI group and the normal PMI group (P = .56) (Fig. 3A). In the subgroup analysis, there were no significant differences in OS between PMI groups in men (P = .83) or women (P = .727).
Table 2.
Comparisons between groups with low (< 6.0 and < 3.4 cm2/m2 for men and women, respectively) and normal (≥ 6.0 and ≥ 3.4 cm2/m2 for men and women, respectively) baseline psoas muscle index (PMI).
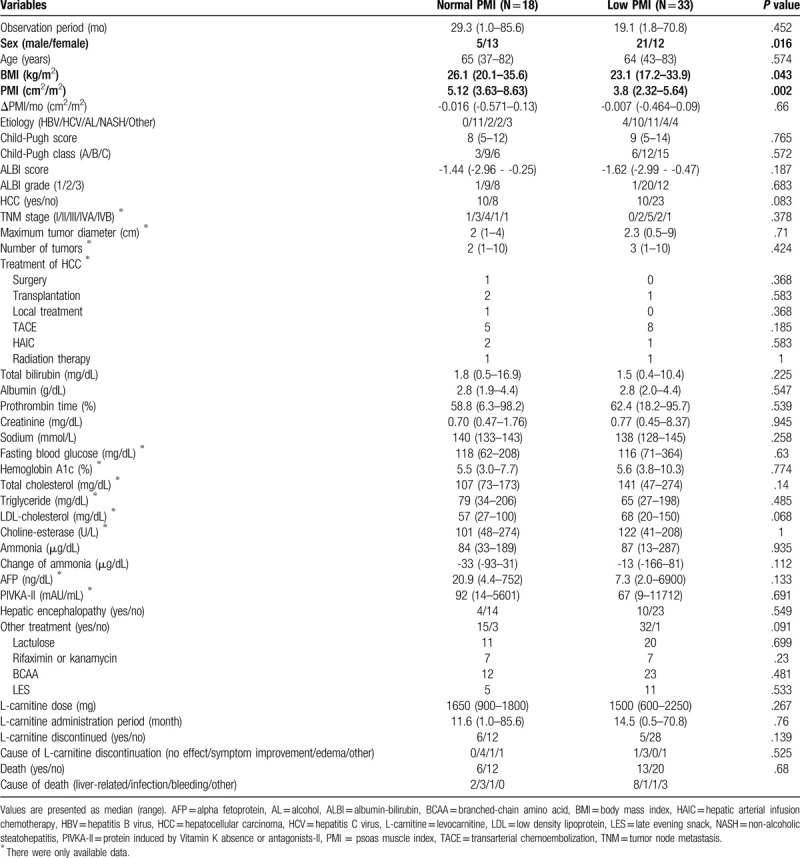
Figure 3.
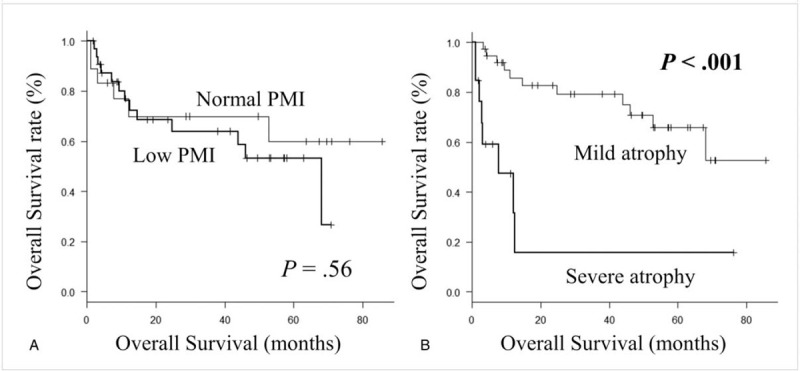
A. Kaplan-Meier curve for overall survival between the patients with normal psoas muscle index (PMI) (≥ 6.0 cm2/m2 for men and ≥ 3.4 cm2/m2 for women) and low PMI (< 6.0 cm2/m2 for men and < 3.4 cm2/m2 for women). B. Kaplan-Meier curve for overall survival between patients with mild (ΔPMI/month above the lower quartile) and severe atrophy (ΔPMI/month below the lower quartile) group.
In the patients who have never had HCC during observation period, 23 (74.2%) were classified as having low PMI. Significantly more men had low PMI than normal PMI (P = .022) (Supplemental digital content [Table S2]). Although serum ammonia level was higher in the normal PMI group (median; 106 μg/dL, range; 50–189 μg/dL) than in the low PMI group (median; 86 μg/dL, range; 13–153 μg/dL) (P = .027), it decreased more in normal PMI group (median; -53 μg/dL, range; -93–9 μg/dL) than in the low PMI group (median; -5 μg/dL, range; -130–81 μg/dL). There was no significant difference in OS between the low PMI group and the normal PMI group (P = .531) (Supplemental digital content [Figure S2A]).
3.4. Predictive factors of OS
Univariate analysis revealed that ALBI grade, administration period of L-carnitine, and ΔPMI/m were significantly associated with OS (Table 3). Multivariate analysis indicated that ΔPMI/m (hazard ratio [HR], 0.007; 95% confidence interval [CI], 0.0002–0.221; P = .005) and L-carnitine administration period (HR, 0.956; 95% CI, 0.921–0.993; P = .021) were significantly associated with OS. Thirteen patients (25.5%) with severe muscle atrophy had a significantly worse prognosis compared with patients with mild muscle atrophy (P < .001) (Fig. 3B). A positive correlation was observed between ΔPMI/m and L-carnitine administration period (R = .375; 95 CI, 0.111–0.59; P = .001) (Fig. 4). There was no significant association between ΔPMI/m and change in ammonia in logistic analysis.
Table 3.
Predictive factors for overall survival.
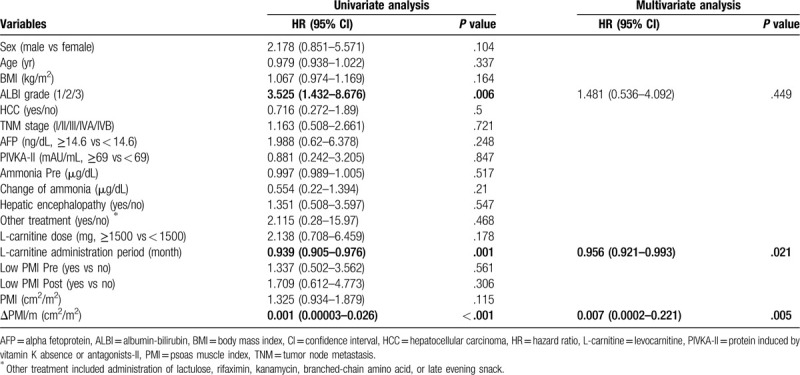
Figure 4.
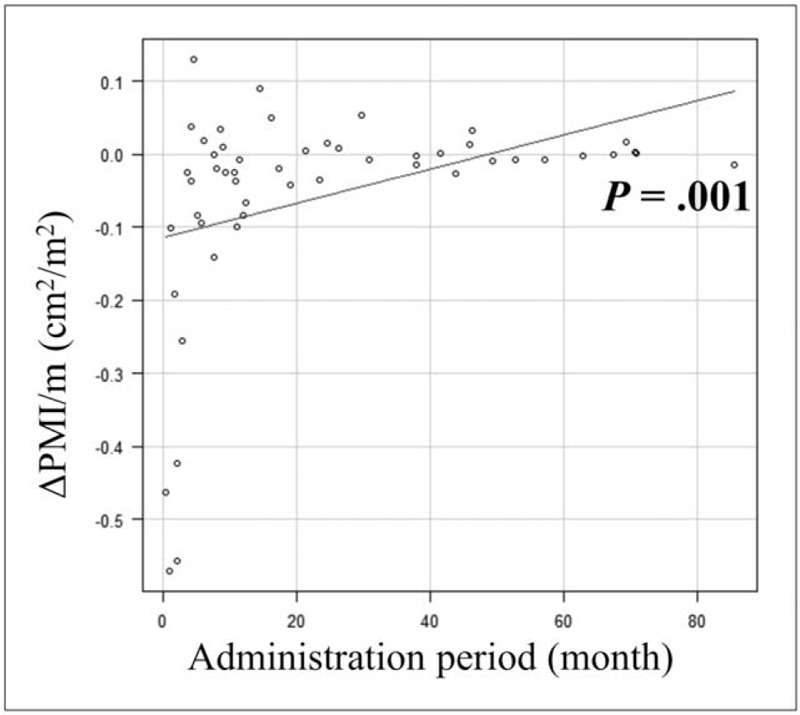
Positive correlation relationship between the monthly change in psoas muscle index (ΔPMI/m) and levocarnitine administration period.
In the patients who have never had HCC during observation period, sex, ALBI grade, administration period of L-carnitine, and ΔPMI/m were significantly associated with OS (Supplemental digital content [Table S3]). Multivariate analysis indicated that ΔPMI/m (HR, 0.012; 95% CI, 0.0002–0.893; P = .044) and L-carnitine administration period (HR, 0.929; 95% CI, 0.858–0.986; P = .016) were significantly associated with OS. Eight patients (25.8%) with severe muscle atrophy had a significantly worse prognosis compared with patients with mild muscle atrophy (P < .001) (Supplemental digital content [Figure S2B]). A positive correlation was observed between ΔPMI/m and L-carnitine administration period (R = 0.466; 95 CI, 0.134–0.704; P = .008) (Supplemental digital content [Figure S3]).
4. Discussion
Sarcopenia is associated with unfavorable mortality in patients with LC or HCC, independent of liver function reserves.[2–6] In terms of HCC treatment, a previous report showed the negative impact of sarcopenia at the time treatment began in patients undergoing curative treatments such as hepatectomy and radiofrequency ablation.[3] On the other hand, the impact of skeletal muscle mass at the start of non-curative treatment such as transarterial chemoembolization (TACE) and sorafenib may be less compared with its impact during curative treatment. In fact, a few reports regarding sorafenib treatment showed no significant association between muscle volume mass at the time sorafenib treatment began and OS, although they showed progressive muscle volume loss as a significant prognostic factor for OS.[4,5] In terms of TACE, we previously reported no significant association between muscle volume loss at baseline and OS and a significant association between psoas muscle volume loss by month during the TACE treatment period and OS.[19] These reports imply that changes in muscle volume mass during non-curative treatment such as sorafenib and TACE may be a useful predictor of prognosis in patients with HCC receiving non-curative treatment. In the present study, there was no association between muscle volume loss at the start of L-carnitine administration and OS but there was an association between progressive muscle volume loss during the L-carnitine administration period and OS. Thus, in patients with LC, with or without HCC, there may be association between muscle volume loss not only at diagnosis of LC but also during the follow-up period and in terms of prognosis.
L-carnitine is indicated for various symptoms caused by LC such as muscle cramps, anorexia, fatigue, and HE due to hyperammonemia. A previous study reported that in LC patients with muscle cramps, L-carnitine was taken for 8 weeks and symptoms improved.[20] Another study reported that L-carnitine administration (1800 mg/d, 3 months) significantly reduced serum ammonia in LC patients with hyperammonemia (serum ammonia > 80 μg/dL).[21] Similarly, in our study, hyperammonemia improved with L-carnitine administration. Hyperammonemia causes elevation of myostatin, which suppresses muscle synthesis.[22] Thus, a reduction of ammonia with administration of L-carnitine might be 1 way to prevent muscle volume loss in patients with LC. However, in the present study, changes in ammonia were not associated with ΔPMI/m in the logistic analysis. Furthermore, another study reported that L-carnitine administration prevented monthly skeletal muscle volume loss, regardless of whether L-carnitine administration reduced serum ammonia.[14] In patients with LC, inflammation due to radical oxygen species causes skeletal muscle volume loss.[23] A previous study reported that L-carnitine administration had a positive impact on oxidative stress.[13,24] Thus, L-carnitine may prevent muscle volume loss via multiple effects including a reduction in serum ammonia and hepatic oxidative stress.
Two previous studies showed an association between L-carnitine administration and skeletal muscle volume loss in patients with LC.[14,15] In the present study, we retrospectively investigated these associations only in LC patients originally receiving L-carnitine. However, in the present study, ΔPMI/m and L-carnitine administration period had a significant association with OS in LC patients with or without HCC in Cox-Hazard analysis. Furthermore, there was a positive correlation between ΔPMI/m and L-carnitine administration period. These results imply that L-carnitine administration for longer might prevent skeletal muscle volume loss and lead to longer OS.
There were several limitations in the present study. First, this study was a retrospective single-center study, and the number of patients was small. Second, we did not measure muscular strength in patients; thus, a diagnosis of sarcopenia according to JSH guidelines for sarcopenia in liver disease was impossible. Third, because we measured the long or short axis of the psoas muscle at the L3 vertebra using manual tracing, there were likely some errors in PMI values. Prospective, large-scale studies to overcome the above-mentioned limitations, along with interventional studies to prevent sarcopenia, are needed to improve prognosis in patients with LC taking L-carnitine.
In conclusion, progressive loss of skeletal muscle volume was an important predictor of poor prognosis in LC patients treated with L-carnitine. L-carnitine administration for longer may be able to prevent skeletal muscle volume loss and lead to a better prognosis in patients with LC.
Acknowledgments
We gratefully acknowledge the work of past and present members of our department.
Author contributions
All authors participated in study conception and design. M. Fujita performed statistical analysis of the data. H. Ohira and K. Abe supervised the project. All authors participated in interpretation of the results and drafting of the manuscript, and approved the final version.
Supplementary Material
Supplementary Material
Supplementary Material
Supplementary Material
Supplementary Material
Supplementary Material
Footnotes
Abbreviations: LC = liver cirrhosis, L-carnitine = levocarnitine, PMI = psoas muscle index, OS = overall survival, HR = hazard ratio.
How to cite this article: Fujita M, Abe K, Hayashi M, Takahashi A, Ohira H. Skeletal muscle volume loss among liver cirrhosis patients receiving levocarnitine predicts poor prognosis. Medicine. 2020;99:28(e21061).
The authors have no conflicts of interest to disclose.
Supplemental Digital Content is available for this article.
All data generated or analyzed during this study are included in this published article [and its supplementary information files].
References
- [1].Thompson DD. Aging and sarcopenia. J Musculoskel Neuro Interact 2007;7:344–5. [PubMed] [Google Scholar]
- [2].Hanai T, Shiraki M, Ohnishi S, et al. Rapid skeletal muscle wasting predicts worse survival in patients with liver cirrhosis. Hepatol Res 2016;46:743–51. [DOI] [PubMed] [Google Scholar]
- [3].Chang KV, Chen JD, Wu WT, et al. Association between loss of skeletal muscle mass and mortality and tumor recurrence in hepatocellular carcinoma: a systematic review and meta-analysis. Liver Cancer 2018;7:90–103. [DOI] [PMC free article] [PubMed] [Google Scholar]
- [4].Takada H, Kurosaki M, Nakanishi H, et al. Impact of pre-sarcopenia in sorafenib treatment for advanced hepatocellular carcinoma. PLoS One 2018;13:e0198812. [DOI] [PMC free article] [PubMed] [Google Scholar]
- [5].Yamashima M, Miyaaki H, Honda T, et al. Significance of psoas muscle thickness as an indicator of muscle atrophy in patients with hepatocellular carcinoma treated with sorafenib. Mol Clin Oncol 2017;7:449–53. [DOI] [PMC free article] [PubMed] [Google Scholar]
- [6].Dodson RM, Firoozmand A, Hyder O, et al. Impact of sarcopenia on outcomes following intra-arterial therapy of hepatic malignancies. J Gastrointest Surg 2013;17:2123–32. [DOI] [PMC free article] [PubMed] [Google Scholar]
- [7].Stanley CA. Carnitine deficiency disorders in children. Ann NY Acad Sci 2004;1033:42–51. [DOI] [PubMed] [Google Scholar]
- [8].Schreiber B. Levocarnitine and dialysis: a review. Nutr Clin Pract 2005;20:218–43. [DOI] [PubMed] [Google Scholar]
- [9].Evans A. Dialysis-related carnitine disorder and levocarnitine pharmacology. Am J Kidney Dis 2003;41: Suppl 4: S13–26. [DOI] [PubMed] [Google Scholar]
- [10].Pekala J, Sokola BP, Bodkowski R, et al. L-carnitine – metabolic functions and meaning in human life. Curr Drug Metab 2011;12:667–78. [DOI] [PubMed] [Google Scholar]
- [11].Pons R, De Vivo DC. Primary and secondary carnitine deficiency syndromes. J Child Neurol 1995;10: Suppl 2: S8–24. [PubMed] [Google Scholar]
- [12].Ringseis R, Keller J, Eder K. Role of carnitine in the regulation of glucose homeostasis and insulin sensitivity: evidence from in vivo and in vitro studies with carnitine supplementation and carnitine deficiency. Eur J Nutr 2012;51:1–8. [DOI] [PubMed] [Google Scholar]
- [13].Malaguarnera M, Cammalleri L, Gargante MP, et al. L-carnitine treatment reduces severity of physical and mental fatigue and increases cognitive functions in centenarians: a randomized and controlled clinical trial. Am J Clin Nutr 2007;86:1738–44. [DOI] [PubMed] [Google Scholar]
- [14].Ohara M, Ogawa K, Suda G, et al. L-carnitine suppresses loss of skeletal muscle mass in patients with liver cirrhosis. Hepatol Commun 2018;2:910–22. [DOI] [PMC free article] [PubMed] [Google Scholar]
- [15].Hiramatsu A, Aikata H, Uchikawa S, et al. Levocarnitine use is associated with improvement in sarcopenia in patients with liver cirrhosis. Hepatol Commun 2019;3:348–55. [DOI] [PMC free article] [PubMed] [Google Scholar]
- [16].Nishikawa H, Shiraki M, Hiramatsu A, et al. Japan Society of Hepatology guidelines for sarcopenia in liver disease (1st edition): recommendation from the working group for creation of sarcopenia assessment criteria. Hepatol Res 2016;46:951–63. [DOI] [PubMed] [Google Scholar]
- [17].Liver Cancer Study Group of Japan. General Rules for the Clinical and Pathological Study of Primary Liver Cancer. 3rd English ed.2010;Tokyo: Kanehara & CO., Ltd, 26-7. [Google Scholar]
- [18].Kanda Y. Investigation of the freely available easy-to-use software ‘EZR’ for medical statistics. Bone Marrow Transplant 2013;48:452–8. [DOI] [PMC free article] [PubMed] [Google Scholar]
- [19].Fujita M, Takahashi A, Hayashi M, et al. Skeletal muscle volume loss during transarterial chemoembolization predicts poor prognosis in patients with hepatocellular carcinoma. Hepatol Res 2019;49:778–86. [DOI] [PubMed] [Google Scholar]
- [20].Nakanishi H, Kurosaki M, Tsuchiya K, et al. L-carnitine reduces muscle cramps in patients with cirrhosis. Clin Gastroenterol Hepatol 2015;13:1540–3. [DOI] [PubMed] [Google Scholar]
- [21].Shiraki M, Shimizu M, Moriwaki H, et al. Carnitine dynamics and their effects on hyperammonemia in cirrhotic Japanese patients. Hepatol Res 2017;47:321–7. [DOI] [PubMed] [Google Scholar]
- [22].McPherron AC, Lawier AM, Lee SJ. Regulation of skeletal muscle mass in mice by a new TGF-beta superfamily member. Nature 1997;387:83–90. [DOI] [PubMed] [Google Scholar]
- [23].Lin SY, Chen WY, Lee FY, et al. Activation of ubiquitin-proteasome pathway is involved in skeletal muscle wasting in a rat model with biliary cirrhosis: potential role of TNF-alpha. Am J Physiol Endocrinol Metab 2005;288:493–501. [DOI] [PubMed] [Google Scholar]
- [24].Ishikawa H, Takaki A, Tsuzaki R, et al. L-carnitine prevents progression of non-alcoholic steatohepatitis in a mouse model with upregulation of mitochondrial pathway. PLoS ONE 2014;9. [DOI] [PMC free article] [PubMed] [Google Scholar]
Associated Data
This section collects any data citations, data availability statements, or supplementary materials included in this article.


