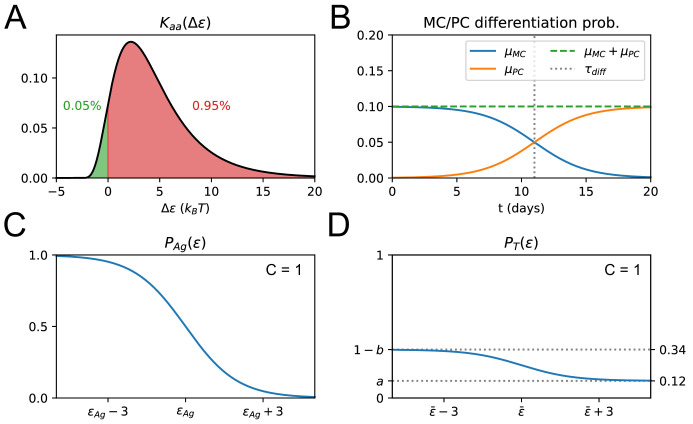
Appendix 1—figure 1. Effect of affinity-affecting mutations, differentiation time-switch and survival probability.
(A) Plot of the affinity-affecting kernel . Only around 5% of the affinity-affecting mutations increase affinity (green part of the curve for ). (B) Probability of MC and PC differentiation as a function of time from Ag injection ( in days). (C) Probability that a B-cell survives Ag-binding selection process as a function of its binding energy , see Equation 19. On the x-axis we mark the threshold energy . (D) Probability that a B-cell survives the T-cell selection process as a function of its binding energy , see Equation 20. On the x-axis we mark the threshold binding energy , which depends on the binding energy distribution of the rest of the B-cell population, see Equation 20.

