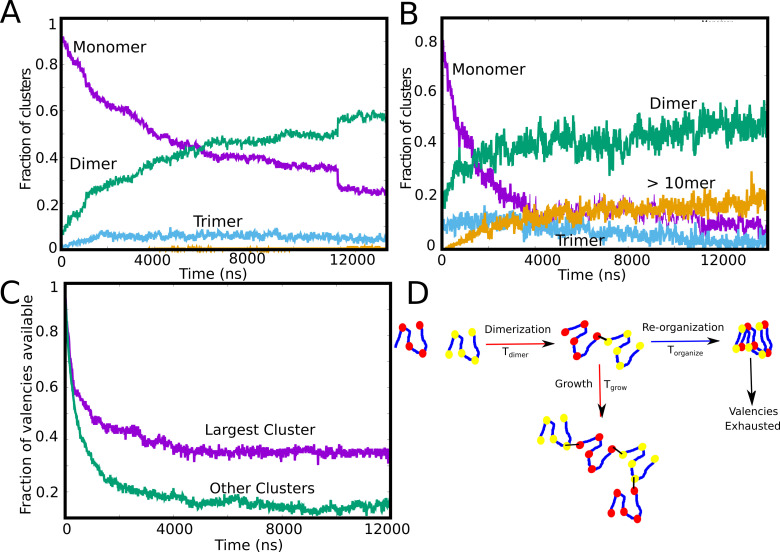
Figure 3. Tracking cluster formation at early timescales.
A and B show the temporal evolution of specific contacts for a free monomer concentration of 10, and 50 μM, respectively. For a low concentration of 10 μM, there is an initial decrease in the monomer population (purple curve) which is concomitant with an increase in the dimer population. A negligible fraction of the clusters is in the form of large-mers (size > = 10, orange curve) at these low concentration since the available valencies for growth are consumed by the smaller aggregated species. An increase in concentration from 10μM to 50μM results in an increase in the large-mer (orange curve, 50 μM) population as the monomer fraction decreases during the simulation. A higher free monomer concentration allows the larger clusters to grow due to consumption of free monomers (with unsatisfied valencies) before they get converted into smaller clusters (dimers, trimers) with satisfied valencies. (C) Time evolution of available valencies within the single largest cluster and outside the single largest cluster, for a of 50 μM, of 0.1 kcal/mol and linker bending rigidity of 2 kcal/mol. (D) A schematic figure showing the possible mechanisms of cluster growth and arrest and the competing timescales that could punctuate the process.


