

ABSTRACT
The prevalence of overweight, obesity, and their related complications is increasing worldwide. The purpose of this umbrella review was to summarize and critically evaluate the effects of different diets on anthropometric parameters and cardiometabolic risk factors. Medline, Embase, Scopus, Cochrane Database of Systematic Reviews, and Web of Science, from inception to April 2019, were used as data sources to select meta-analyses of randomized controlled trials that examined the effects of different diets on anthropometric parameters and cardiometabolic risk factors. Strength and validity of the evidence were assessed through a set of predefined criteria. Eighty articles reporting 495 unique meta-analyses were examined, covering a wide range of popular diets: low-carbohydrate (n = 21 articles), high-protein (n = 8), low-fat (n = 9), paleolithic (n = 2), low-glycemic-index/load (n = 12), intermittent energy restriction (n = 6), Mediterranean (n = 11), Nordic (n = 2), vegetarian (n = 9), Dietary Approaches to Stop Hypertension (DASH) (n = 6), and portfolio dietary pattern (n = 1). Great variability in terms of definition of the intervention and control diets was observed. The methodological quality of most articles (n = 65; 81%), evaluated using the “A MeaSurement Tool to Assess systematic Reviews-2” questionnaire, was low or critically low. The strength of evidence was generally weak. The most consistent evidence was reported for the Mediterranean diet, with suggestive evidence of an improvement in weight, BMI, total cholesterol, glucose, and blood pressure. Suggestive evidence of an improvement in weight and blood pressure was also reported for the DASH diet. Low-carbohydrate, high-protein, low-fat, and low-glycemic-index/load diets showed suggestive and/or weak evidence of a reduction in weight and BMI, but contrasting evidence for lipid, glycemic, and blood pressure parameters, suggesting potential risks of unfavorable effects. Evidence for paleolithic, intermittent energy restriction, Nordic, vegetarian, and portfolio dietary patterns was graded as weak. Among all the diets evaluated, the Mediterranean diet had the strongest and most consistent evidence of a beneficial effect on both anthropometric parameters and cardiometabolic risk factors. This review protocol was registered at www.crd.york.ac.uk/PROSPERO/ as CRD42019126103.
Keywords: diet, review, meta-analysis, weight, risk factors
Introduction
With the increasing numbers of overweight and obese people worldwide (1), there is a growing public health concern on body size and dietary habits. Current data show that ∼42% of adults worldwide have tried to lose weight at some point in life (2). In response to the ubiquity of weight-loss efforts, diets that promise rapid and easy weight loss by limiting certain foods or macronutrients are constantly emerging, attracting public attention, and generating considerable debate. The effectiveness of a diet, however, is measured not only by its ability to induce weight loss in a short time. Several other factors such as their overall nutritional quality and the long-term effects on cardiometabolic risk factors should be carefully considered (3). As reported by both observational and intervention studies, there is supporting evidence for potential causal relations between dietary patterns, health status, and occurrence of chronic degenerative diseases (4, 5).
Numerous epidemiological studies and clinical trials have evaluated the impact of dietary interventions on weight and biomarkers related to metabolic disorders so far (6), and many meta-analyses have been published (5, 7–9). Meta-analyses are powerful tools that can overcome difficulties in performing large-scale randomized controlled trials (RCTs), but are subject to the possibility of bias related to variation in quality and empirical validation. It has been reported that over half of the meta-analyses published are flawed and unnecessary (10), and that the production of poor-quality and redundant meta-analyses can contribute to the spread of misleading dietary concepts (11).
The assessment of the quality and credibility of existing evidence may have implications for both clinical practice and public health. Umbrella reviews are overviews of systematic reviews and meta-analyses that provide a comprehensive and systematic evaluation of the scientific literature available for a specific research topic and offer the possibility to understand the strength of evidence and extent of potential biases (12). To the best of our knowledge, no previous umbrella reviews have assessed the strength and validity of the evidence available on dietary approaches to the treatment of obesity and overweight. Our aim, therefore, was to describe and critically evaluate the impact of different diets and/or dietary patterns on human health, by considering their effects on anthropometric parameters and cardiometabolic risk factors.
Methods
An umbrella review of meta-analyses of RCTs (CRD42019126103) was conducted according to the Joanna Briggs Institute Umbrella Review Methodology (13).
Search strategy
The systematic literature search was independently conducted by 2 authors (DM and DA). Any discrepancy was resolved through consultation with a third independent reviewer (LL). The systematic computerized literature search was performed in the Medline, Embase, Scopus, Cochrane Database of Systematic Reviews, and Web of Science databases, from inception to April 2019. Additional studies were searched by checking references of the identified articles and by consulting experts in the field. The following search terms were used in combination as Medical Subject Headings (MeSH) terms and text words: “diet*” and its variants, with the words “weight,” “body mass index,” “BMI,” “plasma lipids,” “cholesterol,” “LDL-cholesterol,” “HDL-cholesterol,” “triglycerides,” “glycated hemoglobin,” “insulin,” “blood pressure,” and their variants, and the words “meta-analysis,” “systematic reviews,” and their variants. A more exhaustive search strategy list, for each database, is provided in Supplemental Table 1. The most updated or complete publication was used when >1 article was present for a meta-analysis. If an article presented meta-analyses for >1 health outcome, each of these was included separately. Missing data or additional information were requested from the corresponding authors of the articles.
Data selection
Supplemental Table 2 summarizes the eligibility criteria, following the PICOS (Population, Intervention, Comparison, Outcome, Study design) format. Inclusion criteria were the following: 1) Population: adults (aged ≥18 y); 2) Intervention: all diets or dietary patterns; 3) Comparison: any other dietary intervention; 4) Outcome: weight, BMI, total cholesterol, LDL cholesterol, HDL cholesterol, triglycerides, glucose, insulin, glycated hemoglobin (HbA1c), systolic blood pressure, or diastolic blood pressure; 5) Study design: meta-analyses of RCTs.
Exclusion criteria were the following: 1) Population: nonadults (aged < 18 y), pregnancy, or postpartum; 2) Intervention: not a specific diet or dietary pattern; 3) Outcome: any other outcome outside of the inclusion criteria; 4) Study design: systematic reviews of RCTs without quantitative analysis, meta-analyses not reporting comprehensive data (e.g., effect sizes and 95% CIs), or meta-analyses of observational studies. The decision to include studies was based on the title, abstract, and full-text screening.
Data extraction and quality assessment
Three independent researchers (AR, MDA, and LB) achieved consensus on which data to extract from each eligible meta-analysis, using a standard form. The following data were extracted: first author and year of publication, number of included studies, intervention diet, control diet, number of subjects assigned to the intervention group, number of subjects assigned to the control group, duration of the intervention, study population, outcomes of interest, effect size measurements, and quality of the studies included in each meta-analysis. Data were grouped according to the type of dietary intervention. Within each diet, outcomes were categorized as follows: body weight (kg), BMI (kg/m2), total cholesterol (mmol/L), LDL cholesterol (mmol/L), HDL cholesterol (mmol/L), triglycerides (mmol/L), glucose (mmol/L), insulin (μU/mL), HbA1c (%), systolic blood pressure (mm Hg), and diastolic blood pressure (mm Hg). When data were provided in milligrams per deciliter or picomoles per liter, they were transformed into millimoles per liter or micro-International Units per milliliter for consistency of results.
Three authors (CDB, DN, and EM) independently evaluated the methodological quality of the included meta-analyses. Disagreements were resolved by discussion with a fourth investigator (MD). The “A MeaSurement Tool to Assess systematic Reviews 2” (AMSTAR-2) questionnaire was used to identify the high-quality meta-analyses (14). This instrument has 16 items in total, with an overall rating based on weaknesses in critical domains. Critical domains were as follows: adequacy of the literature search, risk of bias from individual studies included in the review, appropriateness of meta-analytical methods, consideration of risk of bias when interpreting the results of the review, and assessment of presence of publication bias.
Data analysis
For each unique meta-analysis, we estimated the summary effect and 95% CIs using both fixed-effect and random-effect models (DerSimonian and Laird method). Heterogeneity among studies was evaluated using the I² statistic (15). Where I² exceeded 50% or 75%, the heterogeneity was considered substantial or considerable, respectively. The 95% prediction interval (PI) was calculated to predict the range of effect sizes that would be expected in a new original study, after accounting for both the uncertainty of the summary effect estimated in the random-effect model and the heterogeneity among individual studies (16). The possible presence of small-study effects was estimated by using Egger's regression asymmetry test (17). We investigated if small studies tended to give larger estimates of effect size than large studies by calculating the SE of the effect size (under the random-effect model) for the largest study of each meta-analysis. The largest study was defined on the basis of the smallest SE. If the P value for Egger's test was <0.10 and the largest study had a smaller effect size than the summary effect size, both criteria for the existence of small-study effects were fulfilled (18). All statistical analyses were conducted using Review Manager (RevMan, version 5.3 for Macintosh; The Cochrane Collaboration) and the statistical package PASW 20.0 for Macintosh (SPSS Inc.).
As previously proposed (19, 20), observed associations were categorized as convincing or not by using the following criteria: significance at P ≤ 0.05 and P ≤ 0.001; inclusion of ≥2500 or ≥5000 total participants; absence of considerable heterogeneity (I2 < 50%); 95% PI excluding the null value; and absence of small-study effects. Convincing evidence was assigned to associations with a significance of P ≤ 0.001 for both random- and fixed-effect models, ≥5000 total participants, not large heterogeneity between studies (I2 < 50%), 95% PI excluding the null value, and no evidence of small-study effects (if it could be tested). Highly suggestive evidence was assigned to associations with a significance of P ≤ 0.001 for both random- and fixed-effect models, ≥5000 total participants, and not considerable heterogeneity between studies (I2 = 50–75%). Suggestive evidence was assigned to associations with a significance of P ≤ 0.001 for the random-effect model and 2500–5000 total participants. Weak evidence was assigned to associations with a significance of P ≤ 0.05 for the random-effect model. No-evidence was assigned to associations where the significance threshold was not reached (P > 0.05).
Results
Search results
The selection process is shown in Figure 1, in accordance with the Preferred Reporting Items for Systematic Reviews and Meta-Analyses guidelines. Initial database and other searches yielded 27,627 articles. After eliminating duplicates, 12,469 articles were excluded on the basis of their title and abstract, and 105 on the basis of full-text assessment. A total of 80 articles (7–9, 21–97) met the inclusion criteria and were included in the analysis, covering a wide range of diets: low-carbohydrate (n = 21 articles), high-protein (n = 8), low-fat (n = 9), paleolithic (n = 2), low-glycemic-index/load (n = 12), intermittent energy restriction (n = 6), Mediterranean (n = 11), Nordic (n = 2), vegetarian (n = 9), Dietary Approaches to Stop Hypertension (DASH) (n = 6), and portfolio dietary pattern (n = 1).
Figure 1.

Flow diagram of the study selection process. RCT, randomized controlled trial.
Study characteristics and quality
Table 1 reports the characteristics and methodological quality of the meta-analyses included. There was great variability in terms of definition of the intervention diets: as regards low-carbohydrate diets, for example, some studies defined as “low-carbohydrate” diets containing ≤45% of total energy from carbohydrates (23, 28, 34, 36, 38), others diets that included carbohydrates totalling ≤26% (33) or even less (≤10%) (26) of the total energy, whereas others did not define the amount of carbohydrates included (22, 24, 25, 27, 31, 32, 35, 40). Similarly, for high-protein diets, in some meta-analyses the high-protein content was defined as >20% of total energy (42), in others >25% (43) or between 25% and 35% (41, 45), and in others it was not defined at all (8, 25, 44, 46). High variability was also observed among vegetarian diets, where some meta-analyses included lacto-ovo-vegetarian and vegan diets altogether (85, 86, 89–91), whereas others considered lacto-ovo-vegetarian (84, 87, 88) or vegan (87, 88, 92) diets specifically. A consistent heterogeneity was also present for control diets. In fact, most meta-analyses had as “control” any other dietary intervention, without specific indication. The study population was mainly composed of subjects with overweight/obesity or type 2 diabetes. Overweight was defined as a BMI between 25 and 29.9 and obesity as a BMI ≥ 30. A greater number of RCTs and a bigger sample size (≥2500 subjects) were observed in meta-analyses on Mediterranean (74–76, 79, 80, 82) and low-carbohydrate (23, 24, 28, 38, 39) diets. Conversely, the number of RCTs and the study population were small (≤500 subjects) in meta-analyses on paleolithic (55, 56), intermittent energy restriction (68–73), Nordic (81, 83), and portfolio dietary patterns (97). The methodological quality of the included meta-analyses, determined by the AMSTAR-2 questionnaire, was moderate-to-high only in 6 meta-analyses on low-carbohydrate diets (7, 26, 27, 36, 37, 39), in 2 meta-analyses on low-glycemic-index/load (58, 64) and vegetarian diets (91, 92), and in 1 meta-analysis on each of low-fat diet (52), intermittent energy restriction (71), Mediterranean diet (9), Nordic diet (83), and portfolio dietary pattern (97). There were no meta-analyses with moderate or high methodological quality for high-protein, paleolithic, and DASH diets. Although most meta-analyses (n = 73; 91%) performed a quality/risk of bias assessment using validated tools or criteria set by the authors, only 27 (34%) accounted for risk of bias in individual studies when interpreting/discussing the results of the meta-analysis.
TABLE 1.
Characteristics of meta-analyses of RCTs included in the umbrella review according to dietary interventions1
| Meta-analyses | Intervention diet | Control diet | n Intervention | n Control | Study population (age ≥ 18 y) | Duration | Quality/risk of bias assessment | Outcomes | Quality of meta-analyses (AMSTAR-2) |
|---|---|---|---|---|---|---|---|---|---|
| LCs | |||||||||
| Nordmann et al. (21) | LC (≤60 g CHO) | LF (≤30% of TE) | 222 | 225 | OW/OB | >6 mo, >12 mo | Criteria set by authors | Weight, TC, LDL-C, HDL-C, TG, SBP, DBP | Critically low |
| Hession et al. (22) | LC/HP2 | HC/LF3 | 375 | 367 | OW/OB | >6 mo, >12 mo | Criteria set by authors | Weight, TC, LDL-C, HDL-C, TG, glucose, SBP, DBP | Critically low |
| Hu et al. (23) | LC (≤45% of TE) | LF (≤30% of TE) | 1396 | 1392 | OW/OB | 6–24 mo | No | Weight, TC, LDL-C, HDL-C, TG, glucose, insulin, SBP, DBP | Critically low |
| Santos et al. (24) | LC4 | Other | 2394 | 4346 | OB | 3–24 mo | Criteria set by authors | Weight, BMI, LDL-C, HDL-C, TG, glucose, insulin, HbA1c, SBP, DBP | Critically low |
| Ajala et al. (25) | LC4 | Other | NA | NA | T2DM | 6–12 mo | Cochrane RoB | HbA1c | Critically low |
| Bueno et al. (26) | VLCKD (≤50 g CHO or ≤10% of TE) | LF (≤30% of TE) | 712 | 703 | OW/OB | 12–24 mo | Cochrane RoB | Weight, LDL-C, HDL-C, TG, SBP, DBP | High |
| Naude et al. (27) | LC4 | Balanced energy-restricted diets | 837 | 872 | OW/OB, T2DM | 3–6 mo, 12–24 mo | Cochrane RoB | Weight | Moderate |
| Alexandraki et al. (28) | LC (≤45% of TE) | LF (≤30% of TE) | 1548 | 1543 | OW/OB | 6 mo, 12 mo | Cochrane RoB | Weight | Critically low |
| Sackner-Bernstein et al. (29) | LC (≤120 g CHO) | LF (≤30% of TE) | 895 | 902 | OW/OB | 2–24 mo | No | Weight | Critically low |
| Fan et al. (30) | LC (≤130 g CHO) | Other | 567 | 569 | T2DM | 3–48 mo | Jadad scale | Weight, HbA1c | Critically low |
| Hashimoto et al. (31) | LC4 | Other | 697 | 719 | OW/OB | 2–24 mo | AMSTAR | Weight | Critically low |
| Mansoor et al. (7) | LC (≤20% of TE) | LF (≤30% of TE) | 688 | 681 | OW/OB | 6–24 mo | Cochrane RoB | Weight, TC, LDL-C, HDL-C, TG, glucose, insulin, SBP, DBP | High |
| Steckhan et al. (32) | LC4 | Other | 96 | 90 | MetS | 1–24 mo | Cochrane RoB | Weight, insulin | Low |
| Meng et al. (33) | LC (≤26% of TE) or ≤130 g CHO/d | HC (45–60% of TE) | 366 | 368 | T2DM | 3–24 mo | Jadad scale | Weight, TC, LDL-C, HDL-C, TG, glucose, HbA1c | Critically low |
| Snorgaard et al. (34) | LC (≤45% of TE) | HC (45–60% of TE) | 414 | 425 | T2DM | <12 mo, ≥12 mo | Cochrane RoB | Weight, BMI, LDL-C, HbA1c | Critically low |
| Huntriss et al. (35) | LC4 | Other | 330 | 315 | T2DM | 12 mo | Cochrane RoB | Weight, TC, LDL-C, HDL-C, TG, HbA1c, SBP, DBP | Critically low |
| Sainsbury et al. (36) | LC (≤45% of TE) | HC (>45% of TE) | NA | NA | T2DM | 6 mo, 12 mo | Cochrane RoB | Weight, HbA1c | Moderate |
| van Zuuren et al. (37) | LC (≤40% of TE) | LF (≤30% of TE) | 269 | 270 | T2DM | <2 mo, 2–4 mo, 4–6 mo, >6 mo, 24 mo | Cochrane RoB/ROBINS-I tool | Weight, BMI, LDL-C, HDL-C, TG, glucose, HbA1c, SBP, DBP | Moderate |
| Gjuladin-Hellon et al. (38) | LC (≤45% of TE) | LF (≤35% of TE) | 1680 | 1678 | OW/OB | 6–24 mo | Cochrane RoB | TC, LDL-C, HDL-C, TG | Critically low |
| Korsmo-Haugen et al. (39) | LC (≤40% of TE) | HC (>40% of TE) | 15875 | NA | T2DM | 3–24 mo | Cochrane RoB | Weight, TC, LDL-C, HDL-C, TG, HbA1c, SBP, DBP | High |
| McArdle et al. (40) | LC4 | Other | 1006 | 1126 | T2DM | 3–52 mo | Cochrane RoB | Weight, HbA1c | Critically low |
| HPs | |||||||||
| Santesso et al. (8) | HP4 | LP | 1158 | 1160 | Different health status | >1 mo | No | Weight, BMI, TC, LDL-C, HDL-C, TG, glucose, insulin, HbA1c, SBP, DBP | Critically low |
| Wycherley et al. (41) | HP (25–35% of TE) | LP (12–18% of TE) | 494 | 516 | Different health status | 1–13 mo | Cochrane RoB | Weight, TC, LDL-C, HDL-C, TG, glucose, insulin, SBP, DBP | Critically low |
| Ajala et al. (25) | HP44 | Other | 72 | 65 | T2DM | 6–12 mo | Cochrane RoB | HbA1c | Critically low |
| Dong et al. (42) | HP (>20% of TE) | LP (15–20% of TE) | NA | NA | T2DM | 1–6 mo | Criteria set by authors | Weight, TC, LDL-C, HDL-C, TG, glucose, HbA1c, SBP, DBP | Critically low |
| Schwingshackl and Hoffmann (43) | HP (≥25% of TE) | LP (≤20% of TE) | 533 | 599 | Different health status | 12–24 mo | Cochrane RoB/Jadad scale | Weight, TC, LDL-C, HDL-C, TG, glucose, insulin, HbA1c, SBP, DBP | Critically low |
| Clifton et al. (44) | HP4 | LCD | 1681 | 1811 | Different health status | 13–52 mo | Cochrane RoB | Weight, TC, LDL-C, HDL-C, TG, glucose, insulin, HbA1c, SBP, DBP | Critically low |
| Johansson et al. (45) | HP (25–30% of TE) | Other | 451 | 414 | Different health status | 0.8–2 mo | Criteria set by authors | Weight | Critically low |
| Zhao et al. (46) | HP4 | LP | 520 | 539 | T2DM | 1–24 mo | Cochrane RoB | Weight, BMI, TC, LDL-C, HDL-C, TG, glucose, insulin, HbA1c, SBP, DBP | Critically low |
| LFs | |||||||||
| Astrup et al. (47) | Reduced fat4 | Other | 1101 | 869 | Nondiabetic | 2–12 mo | No | Weight | Critically low |
| Avenell et al. (48) | LF4 | Other | 665 | 688 | OW/OB | 12 mo | Criteria set by authors | Weight | Critically low |
| Schwingshackl and Hoffmann (49) | LF (≤30% of TE) | Other, HF (>30% of TE), LC (<50 g CHO), LGI/LGL, MUFA | 3793 | 4249 | OW/OB | >3 mo | Cochrane RoB/Jadad scale | TC, LDL-C, HDL-C, TG | Critically low |
| Wu et al. (50) | LF (≤30% of TE) | Usual diet | 900 | 636 | Women | 1–12 mo | Jadad scale | TC, LDL-C, HDL-C, TG | Critically low |
| Boaz et al. (51) | LF (≤30% of TE) | LC (≤45% of TE) | 569 | 592 | OW/OB | 1–8.7 y | No | Weight | Critically low |
| Hooper et al. (52) | LF (≤30% of TE) | HF (>30% of TE) | 22,316 | 31,331 | Different health status | 0.5–8 y | Cochrane RoB | Weight, BMI, TC, LDL-C, HDL-C, TG, SBP, DBP | High |
| Tobias et al. (53) | LF4 | Other, HF, LC, usual diet | NA | NA | Different health status | 1–10 y | Cochrane RoB | Weight | Low |
| Steckhan et al. (32) | LF4 | Other | 116 | 111 | MetS | 1–24 mo | Cochrane RoB | Weight | Low |
| Lu et al. (54) | LF (≤30% of TE) | HF (>30% of TE) | NA | NA | OW/OB | 2–24 mo | Cochrane RoB/Jadad scale | TC, LDL-C, HDL-C, TG, SBP, DBP | Low |
| Paleolithic diet | |||||||||
| Manheimer et al. (55) | Paleolithic | Other | 73 | 64 | MetS | 0.5–6 mo | Cochrane RoB | HDL-C, TG, glucose, SBP, DBP | Low |
| Ghaedi et al. (56) | Paleolithic | Other | 115 | 98 | Different health status | 0.5–24 mo | Cochrane RoB | Weight, BMI, TC, LDL-C, HDL-C, TG, SBP, DBP | Low |
| LGI/LGLs | |||||||||
| Opperman et al. (57) | LGI4 | HGI | 206 | 200 | Different health status, T2DM | <6 mo | Criteria adapted from the Cochrane EPOC Group | TC, LDL-C, HDL-C, TG, HbA1c | Critically low |
| Thomas et al. (58) | LGI/LGL4 | HGI/HGL | 82 | 81 | OW/OB | 1.3–6 mo | Criteria set by authors | Weight, BMI, TC, HDL-C, TG, glucose, insulin | High |
| Thomas and Elliott (59) | LGI4 | HGI | 238 | 219 | T2DM | 1–6 mo | Criteria set by authors | HbA1c | Critically low |
| Ajala et al. (25) | LGI/LGL4 | Other | 181 | 172 | T2DM | 6–12 mo | Cochrane RoB | HbA1c | Critically low |
| Fleming and Godwin (60) | LGI4 | HGI | 107 | 105 | OW/OB | <3 mo | US Preventive Services Task Force Quality Rating Criteria | TC, LDL-C, HDL-C, TG | Critically low |
| Goff et al. (61) | LGI4 | HGI | 733 | 679 | Different health status, T2DM | >1 mo | Jadad scale | TC, LDL-C, HDL-C, TG | Low |
| Schwingshackl and Hoffmann (62) | LGI/LGL4 | HGI/HGL | 913 | 857 | Different health status | 6–17 mo | Cochrane RoB | Weight, TC, LDL-C, HDL-C, TG, glucose, insulin, HbA1c, SBP, DBP | Critically low |
| Wang et al. (63) | LGI4 | HGI | 421 | 409 | T2DM | <36 mo | Jadad scale | HbA1c | Critically low |
| Clar et al. (64) | LGI4 | HGI | NA | NA | CVD | >3 mo | Cochrane RoB | Weight, BMI, TC, LDL-C, HDL-C, TG, SBP, DBP | High |
| Evans et al. (65) | LGI/LGL4 | HGI/HGL | NA | NA | Healthy adults | <18 mo | Cochrane RoB | SBP, DBP | Low |
| Ojo et al. (66) | LGI4 | HGI | 291 | 283 | T2DM | <22 mo | Cochrane RoB/CASP RCT Checklist | Glucose, HbA1c | Critically low |
| Zafar et al. (67) | LGI4 | Other | 3333 | 3241 | OW/OB | <26 mo | Cochrane RoB | Weight, BMI, TC, LDL-C, HDL-C, TG, glucose | Low |
| IER | |||||||||
| Alhamdan et al. (68) | ADF | VLCD | 915 | NA | OW/OB | 2–3 mo | Downs and Black checklist | Weight | Critically low |
| Headland et al. (69) | IER | CER | 230 | 216 | Different health status | >12 mo | Cochrane RoB | Weight | Critically low |
| Cioffi et al. (70) | IER6 | CER | 343 | 222 | Different health status | 2–6 mo | Cochrane RoB | Weight, TC, LDL-C, HDL-C, TG, glucose, insulin, HbA1c, SBP, DBP | Critically low |
| Harris et al. (71) | IER7 | Ad libitum/CER8 | 180 | 137 | OW/OB | 3–12 mo | Cochrane RoB | Weight | Moderate |
| Harris et al. (72) | IER7 | Ad libitum/CER8 | 161 | 126 | OW/OB | 3 mo | JBI SUMARI | Weight, TC, LDL-C, HDL-C, TG, glucose, insulin | Critically low |
| Roman et al. (73) | IER | CER | 329 | 337 | OW/OB | 3–13 mo | Cochrane RoB | Weight | Critically low |
| MDs | |||||||||
| Esposito et al. (74) | MD | Other | 1937 | 1588 | Different health status | 1–60 mo | Jadad scale | Weight, BMI | Critically low |
| Kastorini et al. (75) | MD | Other | 2202 | 1903 | OW/OB | 1–48 mo | Criteria set by authors | HDL-C, TG, glucose, SBP, DBP | Critically low |
| Nordmann et al. (76) | MD | LF (≤30% of TE) | 1641 | 1009 | OW/OB | 24 mo | Criteria set by authors | Weight, BMI, TC, LDL-C, HDL-C, glucose, insulin, SBP, DBP | Critically low |
| Ajala et al. (25) | MD | Other | 308 | 280 | T2DM | 6–12 mo | Cochrane RoB | HbA1c | Critically low |
| Huo et al. (77) | MD | Other | 568 | 521 | T2DM | 1–48 mo | Cochrane RoB | Weight, BMI, TC, LDL-C, HDL-C, TG, glucose, insulin, HbA1c, SBP, DBP | Critically low |
| Esposito et al. (78) | MD | Other | 395 | 278 | Different health status | 1–60 mo | Cochrane RoB | HbA1c | Low |
| Garcia et al. (79) | MD | Other | 32625 | NA | Different health status | 1–52 mo | Cochrane RoB | HDL-C, TG, glucose, SBP, DBP | Low |
| Gay et al. (80) | MD | Other | 5148 | 5013 | Different health status | 6–48 mo | Cochrane RoB | SBP, DBP | Critically low |
| Ndanuko et al. (81) | MD | Other | 310 | 225 | Different health status | 2–24 mo | Cochrane RoB | SBP, DBP | Critically low |
| Nissensohn et al. (82) | MD | Other | 5226 | 5111 | OW/OB | 24 mo | Cochrane RoB | SBP, DBP | Critically low |
| Rees et al. (9) | MD | Other | 692 | 662 | Primary/secondary prevention | ≥3 mo | Cochrane RoB | TC, LDL-C, HDL-C, TG, SBP, DBP | High |
| Nordic diet | |||||||||
| Ndanuko et al. (81) | Nordic | Other | 306 | NA | Different health status | 2–24 mo | Cochrane RoB | SBP, DBP | Critically low |
| Ramezani-Jolfaie et al. (83) | Nordic | Typical/Danish diets | 5135 | NA | Different health status | 0.5–6 mo | Cochrane RoB | TC, LDL-C, HDL-C, TG, SBP, DBP | High |
| VGTs | |||||||||
| Yokoyama et al. (84) | VGT, LOV | Non-VGT | 210 | 195 | Different health status | 1.5–13 mo | No | SBP, DBP | Critically low |
| Yokoyama et al. (85) | VGT | Non-VGT | 120 | 174 | T2DM | 1–18.5 mo | Cochrane RoB | Glucose, HbA1c | Critically low |
| Barnard et al. (86) | VGT | Non-VGT | 6895 | NA | Different health status | 3–26 mo | Cochrane RoB | Weight | Low |
| Huang et al. (87) | VGT, LOV, VGN | Non-VGT | 11515 | NA | Different health status | 2.3–24 mo | Jadad scale | Weight | Critically low |
| Wang et al. (88) | VGT, LOV, VGN | Non-VGT | 7855 | NA | Different health status | 2.3–24 mo | Cochrane RoB | Weight, TC, LDL-C, HDL-C, TG | Critically low |
| Yokoyama et al. (89) | VGT | Non-VGT | 13295 | NA | Different health status | >1.5 mo | Jadad scale | TC, LDL-C, HDL-C, TG | Critically low |
| Picasso et al. (90) | VGT | Non-VGT | 350 | 339 | Different health status | 1.5–18.5 mo | Cochrane RoB | HDL-C, TG, glucose, SBP, DBP | Low |
| Viguiliouk et al. (91) | VGT | Non-VGT | 329 | 337 | T2DM | 1–18.5 mo | Cochrane RoB | Weight, BMI, LDL-C, HDL-C, TG, glucose, HbA1c, SBP, DBP | Moderate |
| Lopez et al. (92) | VGN | Non-VGN | 10785 | NA | Different health status | 0.8–18.5 mo | Cochrane RoB | SBP, DBP | High |
| DASH diet | |||||||||
| Shirani et al. (93) | DASH | Other | 815 | 813 | Different health status | 0.8–6 mo | No | Glucose, insulin | Critically low |
| Saneei et al. (94) | DASH | Other | 1281 | 1280 | Different health status | 0.5–6.5 mo | Criteria set by authors | SBP, DBP | Critically low |
| Siervo et al. (95) | DASH | Other | 964 | 964 | Different health status | 0.5–6 mo | Jadad scale | TC, LDL-C, HDL-C, TG, glucose, SBP, DBP | Critically low |
| Gay et al. (80) | DASH | Other | NA | NA | Different health status | 6–48 mo | Cochrane RoB | SBP, DBP | Critically low |
| Ndanuko et al. (81) | DASH | Other | 1399 | 1399 | Different health status | 2–24 mo | Cochrane RoB | SBP, DBP | Critically low |
| Soltani et al. (96) | DASH | LCD | 1291 | 1291 | Different health status | 2–13 mo | Cochrane RoB | Weight, BMI | Low |
| Portfolio dietary pattern9 | |||||||||
| Chiavaroli et al. (97) | Portfolio | Energy-matched diets | 4395 | NA | Dyslipidemia | 1–6 mo | Cochrane RoB | Weight, TC, LDL-C, HDL-C, TG, SBP, DBP | High |
ADF, alternate day fasting; AMSTAR, A MeaSurement Tool to Assess systematic Reviews; CASP, Critical Appraisal Skills Programme; CER, continuous energy restriction; CHO, carbohydrates; Cochrane RoB, the Cochrane risk-of-bias tool for randomized trials; CVD, cardiovascular disease; DASH, Dietary Approaches to Stop Hypertension; DBP, diastolic blood pressure; EPOC, Effective Practice and Organisation of Care; HbA1c, glycated hemoglobin; HC, high-carbohydrate diet; HDL-C, HDL cholesterol; HF, high-fat diet; HGI, high-glycemic-index; HGL, high-glycemic-load; HP, high-protein diet; IER, intermittent energy restriction; JBI SUMARI, Joanna Briggs Institute's System for the Unified Management, Assessment, and Review of Information critical appraisal tool; LC, low-carbohydrate diet; LCD, low-calorie diet; LDL-C, LDL cholesterol; LF, low-fat diet; LGI/LGL, low-glycemic-index/low-glycemic-load diet (total fat >30% of daily energy consumption, CHO <50% of daily energy consumption, and low-glycemic-index foods); LOV, lacto-ovo-vegetarian diet; LP, low-protein diet; MD, Mediterranean diet; MetS, metabolic syndrome; MUFA, high-MUFA diet (total fat >30% of daily energy consumption and MUFA >12% of daily energy consumption); NA, not available; OB, obese; OW, overweight; RCT, randomized controlled trial; ROBINS-I, Risk of Bias In Non-randomized Studies of Interventions; SBP, systolic blood pressure; TC, total cholesterol; TE, total energy; TG, triglyceride; T2DM, type 2 diabetes mellitus; VGN, vegan diet; VGT, vegetarian diet; VLCD, very-low-calorie dieting (<800 kcal/d); VLCKD, very-low-carbohydrate ketogenic diets (≤50 g/d of CHO or ≤10% of daily energy from CHO).
Low-carbohydrate (≤60 g/d of CHO)/ketogenic diets (<40 g/d of CHO).
Low-fat (≤30% of daily energy from fat)/high-carbohydrate conventional diets, energy restricted.
As defined by the investigators of each trial.
Number of total participants.
IER defined as 75% energy restriction on “fast” days, with a maximum cutoff of 500 and 660 kcal/d for females and males, respectively.
IER defined as consumption of ≤800 kcal on ≥1 d, but no more than 6 d in 1 wk.
Control defined as “ad libitum” diet (no intervention) or advice to continuously follow a reduced-calorie diet of ∼25% of estimated daily energy requirements.
Portfolio dietary pattern was defined as including the following components: 1–3 g plant sterols/d, 15–25 g viscous fibers/d (from oats, barley, psyllium, legumes, eggplants, and okra), 35–50 g plant protein/d, and 25–50 g nuts/d.
Supplemental Table 3 reports the effects of all the diets studied on body weight and cardiometabolic risk factors. By applying our evidence classification criteria, based on the evaluation of the level of significance for both random- and fixed-effect calculations, the sample size, the heterogeneity, the 95% PI, and the presence of small study effects, only a limited number of meta-analyses provided suggestive evidence and no meta-analyses provided highly suggestive or convincing evidence.
Anthropometric parameters
Figure 2 summarizes the characteristics and the strength of evidence of the meta-analyses of RCTs that evaluated the effects of diets on anthropometric parameters. With regard to body weight, suggestive evidence for a decrease in body weight was observed for low-carbohydrate, low-fat, Mediterranean, and DASH diets. The mean difference between intervention and control diets in meta-analyses reporting suggestive evidence ranged from −0.98 to −7.05 kg for low-carbohydrate diets (23, 24, 28), from −1.75 to −2.24 kg for the Mediterranean diet (74, 76), was −1.54 kg (95% CI: −1.97 to −1.12 kg) for low-fat diets (52), and −1.42 kg (95% CI: −2.03 to −0.82 kg) for the DASH diet (96). Weak or no evidence was reported for high-protein, paleolithic, low-glycemic-index/load, and vegetarian diets, as well as for intermittent energy restriction and portfolio dietary pattern. When the outcome BMI was analyzed, suggestive evidence was observed only in 1 meta-analysis (52) on low-fat diets (mean difference: −0.50; 95% CI: −0.74 to −0.26) and in 2 meta-analyses on the Mediterranean diet (74, 76) (mean difference: −0.57; 95% CI: −0.93 to −0.21 and mean difference: −0.56; 95% CI: −1.01 to −0.11, respectively).
FIGURE 2.

Summary and strength of evidence of meta-analyses of randomized controlled trials evaluating anthropometric parameters in adults. Green = suggestive evidence; orange = weak evidence; grey = no evidence. *Number of total participants. AMSTAR, A MeaSurement Tool to Assess systematic Reviews; CL, critically low; DASH, Dietary Approaches to Stop Hypertension; GI, glycemic index; GL, glycemic load; H, high; IER, intermittent energy restriction; L, low; M, medium; NA, not available.
Lipid profile
Figure 3 summarizes the characteristics and the strength of evidence of the meta-analyses of RCTs that evaluated the effects of diets on lipid profile. With regard to total cholesterol, suggestive evidence for a difference between intervention and control diets was reported for low-fat (mean difference: −0.20 mmol/L; 95% CI: −0.29 to −0.11 mmol/L) (52), low-glycemic-index/load (mean difference: −0.14 mmol/L; 95% CI: −0.22 to −0.09 mmol/L) (67), and Mediterranean (mean difference: −0.19 mmol/L; 95% CI: −0.27 to −0.11 mmol/L) (76) diets. Meta-analyses evaluating LDL cholesterol reported suggestive evidence for low-fat (mean difference: −0.08 mmol/L; 95% CI: −0.12 to −0.04 mmol/L) ( 49) and low-glycemic-index/load (mean difference: −0.14 mmol/L; 95% CI: −0.22 to −0.07 mmol/L) (67) diets. Meta-analyses evaluating HDL cholesterol reported suggestive evidence for low-carbohydrate (mean difference: 0.02–0.08 mmol/L) (23, 24, 38), low-fat (mean difference: −0.06 mmol/L; 95% CI: −0.09 to −0.03 mmol/L) (49), and Mediterranean (mean difference: 0.03 mmol/L; 95% CI: 0.01–0.05 mmol/L) (75) diets. Finally, suggestive evidence for triglycerides was reported in meta-analyses comparing low-carbohydrate with other dietary interventions (mean difference: −0.34 mmol/L; 95% CI: −0.36 to −0.31 mmol/L) (24) or low-fat diets (mean difference: −0.14 mmol/L; 95% CI: −0.18 to −0.11 mmol/L) (23, 38), in 1 meta-analysis (44) comparing high-protein with low-calorie diets (mean difference: −0.18 mmol/L; 95% CI: −0.30 to −0.07 mmol/L), and in 1 meta-analysis (49) comparing low-fat with other dietary interventions (mean difference: 0.09 mmol/L; 95% CI: 0.04–0.15 mmol/L).
FIGURE 3.

Summary and strength of evidence of meta-analyses of randomized controlled trials evaluating lipid profile in adults. Green = suggestive evidence; orange = weak evidence; grey = no evidence. *Number of total participants. AMSTAR, A MeaSurement Tool to Assess systematic Reviews; CL, critically low; DASH, Dietary Approaches to Stop Hypertension; GI, glycemic index; GL, glycemic load; H, high; HDL-C, HDL cholesterol; IER, intermittent energy restriction; L, low; LDL-C, LDL cholesterol; M, medium; NA, not available; TC, total cholesterol; TG, triglyceride.
Glycemic profile
Figure 4 summarizes the characteristics and the strength of evidence of the meta-analyses of RCTs that evaluated the effects of diets on glycemic profile. With regard to glucose, suggestive evidence for a difference between intervention and control diets was reported only for Mediterranean diet (mean difference: −0.37 mmol/L; 95% CI: −0.41 to −0.33 mmol/L) (79). On the other hand, 1 meta-analysis (24) comparing low-carbohydrate diets (as defined by the investigators of each trial) with other dietary interventions reported suggestive evidence for insulin (mean difference: −2.24 μU/mL; 95% CI: −2.66 to −1.82 μU/mL). Weak or no evidence was reported by all the meta-analyses evaluating HbA1c.
FIGURE 4.

Summary and strength of evidence of meta-analyses of randomized controlled trials evaluating glycemic profile in adults. Green = suggestive evidence; orange = weak evidence; grey = no evidence. AMSTAR, A MeaSurement Tool to Assess systematic Reviews; CL, critically low; DASH, Dietary Approaches to Stop Hypertension; GI, glycemic index; GL, glycemic load; H, high; HbA1c, glycated hemoglobin; IER, intermittent energy restriction; L, low; M, medium.
Blood pressure
Figure 5 summarizes the characteristics and the strength of evidence of the meta-analyses of RCTs that evaluated the effects of diets on systolic and diastolic blood pressure. Suggestive evidence for a difference between intervention and control diets was reported for low-carbohydrate, Mediterranean, and DASH diets. In particular, evidence from 1 meta-analysis (24) comparing low-carbohydrate diets (as defined by the investigators of each trial) with other dietary interventions (mean difference: −4.81 mm Hg; 95% CI: −5.33 to −4.29 mm Hg), 4 meta-analyses (75, 76, 79, 80) on the Mediterranean diet (ranging from −0.37 to −2.35 mm Hg), and 2 meta-analyses (81, 94) on the DASH diet (ranging from −2.63 to −6.74 mm Hg) were graded as suggestive.
FIGURE 5.

Summary and strength of evidence of meta-analyses of randomized controlled trials evaluating blood pressure in adults. Green = suggestive evidence; orange = weak evidence; grey = no evidence. *Number of total participants. AMSTAR, A MeaSurement Tool to Assess systematic Reviews; BP, blood pressure; CL, critically low; DASH, Dietary Approaches to Stop Hypertension; GI, glycemic index; GL, glycemic load; H, high; IER, intermittent energy restriction; L, low; M, medium; NA, not available.
Evaluation of methodological quality, bias, heterogeneity, and strength of evidence
Detailed information on the evaluation of the methodological quality of included meta-analyses and the assessment of the quality and/or risk of bias of original studies as reported by the authors of the meta-analyses is summarized in Supplemental Tables 4 and 5. Detailed information on the assessment of the strength of evidence is reported in Supplemental Tables 6 and 7.
Figure 6 depicts a summary of the results reported in the meta-analyses of RCTs included. Among all the diets evaluated, only the Mediterranean diet showed significant beneficial effects (i.e., reduction for all the outcomes except for HDL cholesterol, for which an increase is considered as beneficial) for all the parameters analyzed, without evidence of detrimental effects (i.e., increase for any of the outcomes except for HDL cholesterol). Figure 7 reports a forest plot with the summary effect for each outcome evaluated. When for an outcome overlapping meta-analyses existed, we retained the meta-analysis with the highest methodological quality as determined by the AMSTAR-2 questionnaire. When the overlapping meta-analyses had the same methodological quality, we reported the meta-analysis with the largest number of studies.
FIGURE 6.

Summary of the results reported in meta-analyses of randomized controlled trials in adults according to dietary interventions. Green = evidence of a beneficial effect (i.e., lowering for all outcomes except HDL-C); grey = evidence of no effect; red = evidence of a detrimental effect (i.e., increasing for all outcomes except HDL-C). The size of the circles reflects the number of unique meta-analyses available. BP, blood pressure; DASH, Dietary Approaches to Stop Hypertension; ER, energy restriction; GI, glycemic index; GL, glycemic load; HbA1c, glycated hemoglobin; HDL-C, HDL cholesterol; LDL-C, LDL cholesterol; TC, total cholesterol; TG, triglyceride.
FIGURE 7.
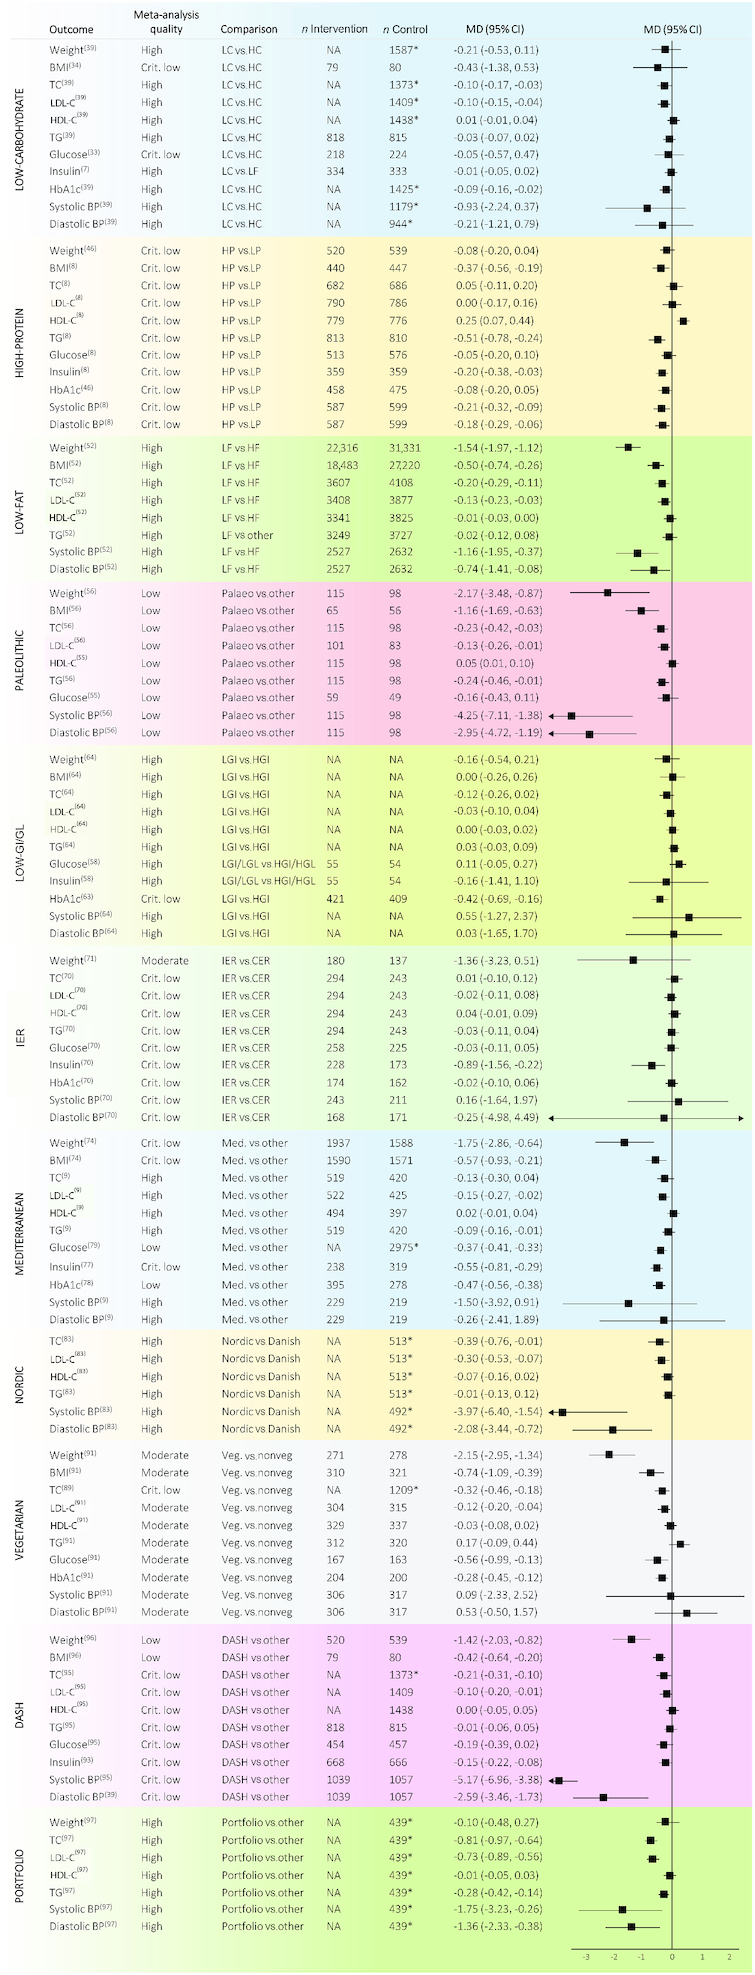
Forest plot of all nonoverlapping meta-analyses of randomized controlled trials in adults according to dietary interventions. *Number of total participants. BP, blood pressure; CER, continuous energy restriction; Crit., critically; DASH, Dietary Approaches to Stop Hypertension; HC, high-carbohydrate; HDL-C, HDL cholesterol; HF, high-fat; HGI, high-glycemic-index; HGL, high-glycemic-load; HP, high-protein; IER, intermittent energy restriction; LC, low-carbohydrate; LDL-C, LDL cholesterol; LF, low-fat; LGI, low-glycemic-index; LGL, low-glycemic-load; LP, low-protein; MD, mean difference; Med., Mediterranean; NA, not available; TC, total cholesterol; TG, triglyceride; Veg., vegetarian.
Discussion
The present is the first umbrella review providing a comprehensive overview and a critical evaluation of the effects of different popular diets on body weight and cardiometabolic risk factors. The overall analysis comprised 80 different meta-analyses of RCTs that evaluated low-carbohydrate, high-protein, low-fat, paleolithic, low-glycemic-index/load, intermittent energy restriction, Mediterranean, Nordic, vegetarian, DASH, and portfolio dietary patterns. Over 80% of the meta-analyses included showed low methodological quality and the strength of evidence, assessed using evidence classification criteria, was generally weak. Notably, the Mediterranean diet was the only diet that demonstrated significant and beneficial effects for all the parameters analyzed, without evidence of potential adverse effects.
Over the past few decades, a wide range of dietary strategies have been promoted to reduce body weight. Some of these diets have been characterized by the modulation of macronutrients (e.g., low-carbohydrate, high-protein, and low-fat diets), whereas others focused on dietary patterns as a whole (e.g., Mediterranean, Nordic, vegetarian, DASH, and portfolio dietary models). To date, several meta-analyses including dietary intervention trials have been published, but to the best of our knowledge no umbrella reviews evaluating the strength of evidence for such meta-analyses have been performed.
In the present umbrella review, the largest number of meta-analyses was found for low-carbohydrate diets. Their definition varied greatly, and cutoffs ranged from 50 to 130 g/d, or 26–45% energy from carbohydrates. Four meta-analyses (33, 34, 36, 39), conducted on participants with type 2 diabetes, compared low-carbohydrate with high-carbohydrate diets, reporting no significant effects on weight. The other meta-analyses compared low-carbohydrate with low-fat diets (7, 21–23, 28, 29, 37) or other dietary interventions (24, 27, 30–32, 35, 40), reporting contrasting results. Evidence of a significant reduction in body weight was observed, especially in the short term (6 mo) and in studies with more extreme carbohydrate restriction. When the follow-up period or the amount of carbohydrates increased, the effect was attenuated. As to the other parameters, we observed weak or suggestive evidence of an improvement in glycemic profile and blood pressure, and conflicting results for lipid profile, with an increase in total and LDL cholesterol reported in 12 meta-analyses. The detrimental effects of low-carbohydrate diets on lipid parameters may be related to the fact that people on low-carbohydrate diets tend to eat less vegetables and fruits rich in micronutrients and fiber, and more animal-derived foods (98).
As for high-protein diets, they are one of the most popular weight-loss strategies. Several mechanisms have been proposed to explain their supposed superiority over conventional weight-loss diets, including higher satiety and an increase in energy expenditure (99). Our analysis showed that the quality of published meta-analyses on high-protein diets is critically low and the number of participants is relatively small. Weak or no evidence of a reduction in anthropometric parameters and blood pressure was reported, whereas data on lipid and glycemic profiles were discordant. Increased saturated fat and lower fiber intake can potentially contribute to the observed increase in LDL cholesterol, glucose, and HbA1c, questioning the safety of high-protein diets in the long term.
With regard to low-fat diets, the proportion of fat in the present umbrella review was ≤30% of energy intake, according to the dietary recommendations from the WHO Healthy Diet Fact Sheet. Suggestive evidence of weight and BMI reduction was reported in the meta-analysis by Hooper et al. (52), which included the Women's Health Initiative Dietary Modification Trial and compared low-fat with high-fat diets. The other meta-analyses comparing low-fat with high-fat (53), low-carbohydrate (51, 53), and other dietary interventions (32, 47, 48, 53) reported weak or no evidence. As to the lipid profile, low-fat diets resulted in a greater reduction in total and LDL cholesterol than high-fat diets or other dietary interventions, but also in a significant worsening of HDL cholesterol and triglycerides. This negative effect is probably determined by the type of fat and the quality of carbohydrates consumed (100).
The most consistent findings were observed in studies that included dietary patterns such as the Mediterranean and DASH diets. Both dietary patterns are high in fruits, vegetables, fish, and nuts, and indexes measuring adherence to these diets have been associated with lower risk of cardiovascular events, diabetes, and cancer in epidemiological studies (5, 20). In the present analysis, the Mediterranean diet showed suggestive evidence of a reduction in weight, BMI, total cholesterol, glucose, and blood pressure, and weak evidence of an improvement in LDL and HDL cholesterol, triglycerides, insulin, and HbA1c. No meta-analyses reported detrimental effects. The DASH diet, on the other hand, reported suggestive evidence of a beneficial effect on weight and blood pressure, and weak evidence for BMI and total cholesterol. With regard to the other dietary patterns, the evidence was less consistent, because most studies had a limited sample size and many meta-analyses were of low methodological quality. We found weak evidence of an improvement in total, LDL cholesterol, and blood pressure with the Nordic diet; weak evidence of an improvement in anthropometric parameters, total and LDL cholesterol, glucose, HbA1c, and blood pressure with vegetarian diets; and weak evidence of an improvement in total and LDL cholesterol, triglycerides, and blood pressure with the portfolio dietary pattern. Altogether, these results corroborate observational findings indicating that dietary patterns that emphasize vegetables, fruits, whole grains, and plant-based protein, and limit sugar, sodium, and red and processed meat, are consistently associated with decreased risk of cardiovascular and metabolic diseases (20, 101).
As to the other popular diets studied, the present umbrella review showed many criticisms. For the paleolithic diet, a weight-loss plan based upon the premise of consuming only foods available during the Stone Age (102), the number of participants was very small and the follow-up was short. In addition, extensive publication bias, selective outcome reporting, and potential conflict of interests were detected. With regard to intermittent energy restriction, a dietary approach that has gained greater popularity as a way for losing weight alternative to conventional weight-loss diets, our systematic literature search led to the identification of 6 meta-analyses of RCTs published in the last 3 y. Intermittent energy restriction includes diverse interventions such as alternate day fasting, the 5:2 diet, and longer cyclic periods of restricting energy intake or fasting, interchanged by periods of ad libitum energy intake. The number of clinical trials and participants, however, was very small, most studies were performed by the same authors, and the follow-up was generally short. With the exception of a meta-analysis that reported weak evidence of a greater reduction in insulin (70), all the other meta-analyses evaluating weight, lipid profile, glucose metabolism, and blood pressure reported no evidence of a superiority of intermittent energy restriction over continuous energy restriction.
The present umbrella review has several limitations. First of all, the included meta-analyses showed relevant differences in terms of populations, methods, duration of interventions, study quality, and definition of intervention and control diets. Most meta-analyses included studies conducted on participants with overweight/obesity or other diseases, and this should be considered before extending these results to the general population. In any case, the choice of the diet should be made via a critical approach, by considering the effects of the diet on all the factors that may have a role in the development of the disease. Second, despite the relatively high number of meta-analyses published, a limited number of clinical trials were available for many diets evaluated. Third, when multiple meta-analyses of RCTs existed for an outcome, often the results were not concordant in terms of direction of effect and/or statistical significance. Such a difference in the final results could be explained mainly by the framing of the question and differences in the inclusion criteria, comparisons, populations, and statistical methods used. Lastly, as with any other systematic review, an umbrella review is dependent on the reporting of the included meta-analyses and does not account for potential omissions or overlapping of original studies.
Because meta-analyses have become an indispensable tool in clinical application for evidence-based decision making, it is extremely important to define and carefully standardize the criteria and the strategies to adopt. Although the number of meta-analyses included in the present umbrella review is high, their methodological quality appears to be mainly low or critically low. More efforts are needed to improve the quality of published articles and further research on the effects of popular diets on anthropometric and cardiometabolic parameters is needed before firm conclusions can be drawn. This will facilitate the understanding, meaning, and applicability of findings in clinical practice.
In conclusion, through a systematic and comprehensive search we were able to include a vast number of meta-analyses that assessed the effects of different popular diets on weight and cardiometabolic risk factors. Among all the diets and dietary patterns evaluated, the Mediterranean diet had the strongest and most consistent evidence, with no meta-analyses reporting detrimental effects. Suggestive evidence of an improvement in body weight and blood pressure was also reported for the DASH diet. Low-carbohydrate, high-protein, low-fat and low-glycemic-index/load diets, on the other hand, showed beneficial effects on weight loss, but also potential risks of unfavorable lipid, glycemic, or blood pressure parameters. The strength of evidence for the other diets evaluated was weak or not statistically significant. Overall, these findings highlight the strengths and limitations of most popular diets, confirming that the best results, in terms of weight and cardiometabolic risk amelioration, are obtained with balanced dietary patterns such as the Mediterranean diet.
Supplementary Material
ACKNOWLEDGEMENTS
The authors’ responsibilities were as follows—MD and FS: designed the study protocol; DM, DA, and LL: conducted the systematic literature search; CDB, DN, and EM: performed the quality assessment; AR, MDA, and LB: performed the data extraction; MD and GP: performed the statistical analysis; MD, GP, CF, MG, and JG: wrote the first draft of the manuscript; FS: critically reviewed the manuscript and contributed important intellectual content; MD: is the guarantor of the paper; and all authors: contributed to writing and reviewing the manuscript and read and approved the final manuscript.
Notes
The authors reported no funding received for this study.
Author disclosures: LL is employed by Janssen. All other authors report no conflicts of interest.
Janssen did not have any role in the study design, data collection and analysis, decision to publish, or preparation of the manuscript.
Supplemental Tables 1–7 are available from the “Supplementary data” link in the online posting of the article and from the same link in the online table of contents at https://academic.oup.com/advances/.
Abbreviations used: AMSTAR-2, A MeaSurement Tool to Assess systematic Reviews 2; DASH, Dietary Approaches to Stop Hypertension; HbA1c, glycated hemoglobin; MeSH, Medical Subject Headings; PI, prediction interval; RCT, randomized controlled trial.
Contributor Information
Monica Dinu, Department of Experimental and Clinical Medicine, University of Florence, Florence, Italy.
Giuditta Pagliai, Department of Experimental and Clinical Medicine, University of Florence, Florence, Italy.
Donato Angelino, Faculty of Bioscience and Technology for Food, Agriculture, and Environment, University of Teramo, Teramo, Italy.
Alice Rosi, Human Nutrition Unit, Department of Food and Drug, University of Parma, Parma, Italy.
Margherita Dall'Asta, Department of Animal Science, Food, and Nutrition, Università Cattolica del Sacro Cuore, Piacenza, Italy.
Letizia Bresciani, Human Nutrition Unit, Department of Veterinary Science, University of Parma, Parma, Italy.
Cinzia Ferraris, Human Nutrition and Eating Disorder Research Center, Department of Public Health, Experimental and Forensic Medicine, University of Pavia, Pavia, Italy.
Monica Guglielmetti, Human Nutrition and Eating Disorder Research Center, Department of Public Health, Experimental and Forensic Medicine, University of Pavia, Pavia, Italy.
Justyna Godos, Oasi Research Institute, Troina, Italy.
Cristian Del Bo’, Department of Food, Environmental, and Nutritional Sciences, Università degli Studi di Milano, Milan, Italy.
Daniele Nucci, Digestive Endoscopy Unit, Veneto Institute of Oncology, Padua, Italy.
Erika Meroni, Department of Food, Environmental, and Nutritional Sciences, Università degli Studi di Milano, Milan, Italy.
Linda Landini, Medical Affairs Janssen, Cologno-Monzese, Milan, Italy.
Daniela Martini, Department of Food, Environmental, and Nutritional Sciences, Università degli Studi di Milano, Milan, Italy.
Francesco Sofi, Department of Experimental and Clinical Medicine, University of Florence, Florence, Italy; Unit of Clinical Nutrition, University Hospital of Careggi, Florence, Italy; Don Carlo Gnocchi Foundation Italy, Onlus, Florence, Italy.
References
- 1. GBD 2015 Risk Factors Collaborators. Global, regional, and national comparative risk assessment of 79 behavioural, environmental and occupational, and metabolic risks or clusters of risks, 1990–2015: a systematic analysis for the Global Burden of Disease Study 2015. Lancet. 2016;388:1659–724. [DOI] [PMC free article] [PubMed] [Google Scholar]
- 2. Santos I, Sniehotta FF, Marques MM, Carraça EV, Teixeira PJ. Prevalence of personal weight control attempts in adults: a systematic review and meta-analysis. Obes Rev. 2017;18:32–50. [DOI] [PMC free article] [PubMed] [Google Scholar]
- 3. Wirt A, Collins CE. Diet quality – what is it and does it matter?. Public Health Nutr. 2009;12:2473–92. [DOI] [PubMed] [Google Scholar]
- 4. GBD 2017 Diet Collaborators. Health effects of dietary risks in 195 countries, 1990–2017: a systematic analysis for the Global Burden of Disease Study 2017. Lancet. 2019;393:1958–72. [DOI] [PMC free article] [PubMed] [Google Scholar]
- 5. Rodríguez-Monforte M, Sánchez E, Barrio F, Costa B, Flores-Mateo G. Metabolic syndrome and dietary patterns: a systematic review and meta-analysis of observational studies. Eur J Nutr. 2017;56:925–47. [DOI] [PubMed] [Google Scholar]
- 6. Shai I, Schwarzfuchs D, Henkin Y, Shahar DR, Witkow S, Greenberg I, Golan R, Fraser D, Bolotin A, Vardi H et al.. Weight loss with a low-carbohydrate, Mediterranean, or low-fat diet. N Engl J Med. 2008;359:229–41. [DOI] [PubMed] [Google Scholar]
- 7. Mansoor N, Vinknes KJ, Veierød MB, Retterstøl K. Effects of low-carbohydrate diets vs. low-fat diets on body weight and cardiovascular risk factors: a meta-analysis of randomised controlled trials. Br J Nutr. 2016;115:466–79. [DOI] [PubMed] [Google Scholar]
- 8. Santesso N, Akl EA, Bianchi M, Mente A, Mustafa R, Heels-Ansdell D, Schünemann HJ. Effects of higher- versus lower-protein diets on health outcomes: a systematic review and meta-analysis. Eur J Clin Nutr. 2012;66:780–8. [DOI] [PMC free article] [PubMed] [Google Scholar]
- 9. Rees K, Takeda A, Martin N, Ellis L, Wijesekara D, Vepa A, Das A, Hartley L, Stranges S. Mediterranean-style diet for the primary and secondary prevention of cardiovascular disease. Cochrane Database Syst Rev. 2019;3:CD009825. [DOI] [PMC free article] [PubMed] [Google Scholar]
- 10. Ioannidis JP. The mass production of redundant, misleading, and conflicted systematic reviews and meta analyses. Milbank Q. 2016;94:485–514. [DOI] [PMC free article] [PubMed] [Google Scholar]
- 11. Barnard ND, Willett WC, Ding EL. The misuse of meta-analysis in nutrition research. JAMA. 2017;318:1435–6. [DOI] [PubMed] [Google Scholar]
- 12. Aromataris E, Fernandez R, Godfrey CM, Holly C, Khalil H, Tungpunkom P. Summarizing systematic reviews: methodological development, conduct and reporting of an umbrella review approach. Int J Evid Based Healthc. 2015;13:132–40. [DOI] [PubMed] [Google Scholar]
- 13. Aromataris E, Fernandez R, Godfrey C, Holly C, Khalil H, Tungpunkom P. Chapter 10: Umbrella reviews. In: Joanna Briggs Institute Reviewer's Manual [Internet] Aromataris E, Munn Z. (Editors) The Joanna Briggs Institute; 2017. Available from:https://reviewersmanual.joannabriggs.org/. [Google Scholar]
- 14. Shea BJ, Reeves BC, Wells G, Thuku M, Hamel C, Moran J, Moher D, Tugwell P, Welch V, Kristjansson E et al.. AMSTAR 2: a critical appraisal tool for systematic reviews that include randomised or non-randomised studies of healthcare interventions, or both. BMJ. 2017;358:j4008. [DOI] [PMC free article] [PubMed] [Google Scholar]
- 15. Cochran WG. The combination of estimates from different experiments. Biometrics. 1954;10:101–29. [Google Scholar]
- 16. Riley RD, Higgins JP, Deeks JJ. Interpretation of random effects meta-analyses. BMJ. 2011;342:d549. [DOI] [PubMed] [Google Scholar]
- 17. Egger M, Davey Smith G, Schneider M, Minder C. Bias in meta-analysis detected by a simple, graphical test. BMJ. 1997;315:629–34. [DOI] [PMC free article] [PubMed] [Google Scholar]
- 18. Sterne JA, Sutton AJ, Ioannidis JP, Terrin N, Jones DR, Lau J, Carpenter J, Rücker G, Harbord RM, Schmid CH et al.. Recommendations for examining and interpreting funnel plot asymmetry in meta-analyses of randomised controlled trials. BMJ. 2011;343:d4002. [DOI] [PubMed] [Google Scholar]
- 19. Belbasis L, Bellou V, Evangelou E, Ioannidis JP, Tzoulaki I. Environmental risk factors and multiple sclerosis: an umbrella review of systematic reviews and meta-analyses. Lancet Neurol. 2015;14:263–73. [DOI] [PubMed] [Google Scholar]
- 20. Dinu M, Pagliai G, Casini A, Sofi F. Mediterranean diet and multiple health outcomes: an umbrella review of meta-analyses of observational studies and randomised trials. Eur J Clin Nutr. 2018;72:30–43. [DOI] [PubMed] [Google Scholar]
- 21. Nordmann AJ, Nordmann A, Briel M, Keller U, Yancy WS, Brehm BJ, Bucher HC. Effects of low-carbohydrate vs low-fat diets on weight loss and cardiovascular risk factors. Arch Intern Med. 2006;166:285–93. [DOI] [PubMed] [Google Scholar]
- 22. Hession M, Rolland C, Kulkarni U, Wise A, Broom J. Systematic review of randomized controlled trials of low-carbohydrate vs. low-fat/low-calorie diets in the management of obesity and its comorbidities. Obes Rev. 2009;10:36–50. [DOI] [PubMed] [Google Scholar]
- 23. Hu T, Mills KT, Yao L, Demanelis K, Eloustaz M, Yancy WS Jr, Kelly TN, He J, Bazzano LA. Effects of low-carbohydrate diets versus low-fat diets on metabolic risk factors: a meta-analysis of randomized controlled clinical trials. Am J Epidemiol. 2012;176:S44–54. [DOI] [PMC free article] [PubMed] [Google Scholar]
- 24. Santos FL, Esteves SS, Costa Pereira A, Yancy WS Jr, Nunes JPL. Systematic review and meta-analysis of clinical trials of the effects of low carbohydrate diets on cardiovascular risk factors. Obes Rev. 2012;13:1048–66. [DOI] [PubMed] [Google Scholar]
- 25. Ajala O, English P, Pinkney J. Systematic review and meta-analysis of different dietary approaches to the management of type 2 diabetes. Am J Clin Nutr. 2013;97:505–16. [DOI] [PubMed] [Google Scholar]
- 26. Bueno NB, Vieira de Melo IS, Lima de Oliveira S, da Rocha Ataide T. Very-low-carbohydrate ketogenic diet vs. low-fat diet for long-term weight loss: a meta-analysis of randomised controlled trials. Br J Nutr. 2013;110:1178–87. [DOI] [PubMed] [Google Scholar]
- 27. Naude CE, Schoonees A, Senekal M, Young T, Garner P, Volmink J. Low carbohydrate versus isoenergetic balanced diets for reducing weight and cardiovascular risk: a systematic review and meta-analysis. PLoS One. 2014;9:e100652. [DOI] [PMC free article] [PubMed] [Google Scholar]
- 28. Alexandraki I, Palacio C, Mooradian AD. Relative merits of low-carbohydrate versus low-fat diet in managing obesity. South Med J. 2015;108:401–16. [DOI] [PubMed] [Google Scholar]
- 29. Sackner-Bernstein J, Kanter D, Kaul S. Dietary intervention for overweight and obese adults: comparison of low-carbohydrate and low-fat diets. A meta-analysis. PLoS One. 2015;10:e0139817. [DOI] [PMC free article] [PubMed] [Google Scholar]
- 30. Fan Y, Di H, Chen G, Mao X, Liu C. Effects of low carbohydrate diets in individuals with type 2 diabetes: systematic review and meta-analysis. Int J Clin Exp Med. 2016;9:11166–74. [Google Scholar]
- 31. Hashimoto Y, Fukuda T, Oyabu C, Tanaka M, Asano M, Yamazaki M, Fukui M. Impact of low-carbohydrate diet on body composition: meta-analysis of randomized controlled studies. Obes Rev. 2016;17:499–509. [DOI] [PubMed] [Google Scholar]
- 32. Steckhan N, Hohmann CD, Kessler C, Dobos G, Michalsen A, Cramer H. Effects of different dietary approaches on inflammatory markers in patients with metabolic syndrome: a systematic review and meta-analysis. Nutrition. 2016;32:338–48. [DOI] [PubMed] [Google Scholar]
- 33. Meng Y, Bai H, Wang S, Li Z, Wang Q, Chen L. Efficacy of low carbohydrate diet for type 2 diabetes mellitus management: a systematic review and meta-analysis of randomized controlled trials. Diabetes Res Clin Pract. 2017;131:124–31. [DOI] [PubMed] [Google Scholar]
- 34. Snorgaard O, Poulsen GM, Andersen HK, Astrup A. Systematic review and meta-analysis of dietary carbohydrate restriction in patients with type 2 diabetes. BMJ Open Diabetes Res Care. 2017;5:e000354. [DOI] [PMC free article] [PubMed] [Google Scholar]
- 35. Huntriss R, Campbell M, Bedwell C. The interpretation and effect of a low-carbohydrate diet in the management of type 2 diabetes: a systematic review and meta-analysis of randomised controlled trials. Eur J Clin Nutr. 2018;72:311–25. [DOI] [PubMed] [Google Scholar]
- 36. Sainsbury E, Kizirian NV, Partridge SR, Gill T, Colagiuri S, Gibson AA. Effect of dietary carbohydrate restriction on glycemic control in adults with diabetes: a systematic review and meta-analysis. Diabetes Res Clin Pract. 2018;139:239–52. [DOI] [PubMed] [Google Scholar]
- 37. Van Zuuren EJ, Fedorowicz Z, Kuijpers T, Pijl H. Effects of low-carbohydrate compared with low-fat-diet interventions on metabolic control in people with type 2 diabetes: a systematic review including GRADE assessments. Am J Clin Nutr. 2018;108:300–31. [DOI] [PubMed] [Google Scholar]
- 38. Gjuladin-Hellon T, Davies IG, Penson P, Baghbadorani RA. Effects of carbohydrate-restricted diets on low-density lipoprotein cholesterol levels in overweight and obese adults: a systematic review and meta-analysis. Nutr Rev. 2019;77:161–80. [DOI] [PubMed] [Google Scholar]
- 39. Korsmo-Haugen HK, Brurberg KG, Mann J, Aas AM. Carbohydrate quantity in the dietary management of type 2 diabetes: a systematic review and meta-analysis. Diabetes Obes Metab. 2019;21:15–27. [DOI] [PubMed] [Google Scholar]
- 40. McArdle PD, Greenfield SM, Rilstone SK, Narendran P, Haque MS, Gill PS. Carbohydrate restriction for glycaemic control in type 2 diabetes: a systematic review and meta-analysis. Diabet Med. 2019;36:335–48. [DOI] [PubMed] [Google Scholar]
- 41. Wycherley TP, Moran LJ, Clifton PM, Noakes M, Brinkworth GD. Effects of energy-restricted high-protein, low-fat compared with standard-protein, low-fat diets: a meta-analysis of randomized controlled trials. Am J Clin Nutr. 2012;96:1281–98. [DOI] [PubMed] [Google Scholar]
- 42. Dong YJ, Zhang ZL, Wang PY, Qin LQ. Effects of high-protein diets on body weight, glycaemic control, blood lipids and blood pressure in type 2 diabetes: meta-analysis of randomised controlled trials. Br J Nutr. 2013;110:781–9. [DOI] [PubMed] [Google Scholar]
- 43. Schwingshackl L, Hoffmann G. Long-term effects of low-fat diets either low or high in protein on cardiovascular and metabolic risk factors: a systematic review and meta-analysis. Nutr J. 2013;12:48. [DOI] [PMC free article] [PubMed] [Google Scholar]
- 44. Clifton PM, Condo D, Keogh JB. Long term weight maintenance after advice to consume low carbohydrate, higher protein diets: a systematic review and meta-analysis. Nutr Metab Cardiovasc Dis. 2014;24:224–35. [DOI] [PubMed] [Google Scholar]
- 45. Johansson K, Neovius M, Hemmingsson E. Effects of anti-obesity drugs, diet, and exercise on weight-loss maintenance after a very-low-calorie diet or low-calorie diet: a systematic review and meta-analysis of randomized controlled trials. Am J Clin Nutr. 2014;99:14–23. [DOI] [PMC free article] [PubMed] [Google Scholar]
- 46. Zhao WT, Luo Y, Zhang Y, Zhou Y, Zhao TT. High protein diet is of benefit for patients with type 2 diabetes: an updated meta-analysis. Medicine. 2018;97:e13149. [DOI] [PMC free article] [PubMed] [Google Scholar]
- 47. Astrup A, Grunwald GK, Melanson El, Saris WHM, Hill JO. The role of low-fat diets in body weight control: a meta-analysis of ad libitum dietary intervention studies. Int J Obes. 2000;24:1545–52. [DOI] [PubMed] [Google Scholar]
- 48. Avenell A, Brown TJ, McGee MA, Campbell MK, Grant AM, Broom J, Jung RT, Smith WC. What are the long-term benefits of weight reducing diets in adults? A systematic review of randomized controlled trials. J Hum Nutr Diet. 2004;17:317–35. [DOI] [PubMed] [Google Scholar]
- 49. Schwingshackl L, Hoffmann G. Comparison of effects of long-term low-fat vs high-fat diets on blood lipid levels in overweight or obese patients: a systematic review and meta-analysis. J Acad Nutr Diet. 2013;113:1640–61. [DOI] [PubMed] [Google Scholar]
- 50. Wu L, Ma D, Walton-Moss B, He Z. Effects of low-fat diet on serum lipids in premenopausal and postmenopausal women: a meta-analysis of randomized controlled trials. Menopause. 2014;21:89–99. [DOI] [PubMed] [Google Scholar]
- 51. Boaz M, Raz O, Wainstein J. Low fat vs. low carbohydrate diet strategies for weight reduction: a meta-analysis. J Obes Weight Loss Ther. 2015;5:273. [Google Scholar]
- 52. Hooper L, Abdelhamid A, Bunn D, Brown T, Summerbell CD, Skeaff CM. Effects of total fat intake on body weight. Cochrane Database Syst Rev. 2015;8:CD011834. [DOI] [PMC free article] [PubMed] [Google Scholar]
- 53. Tobias DK, Chen M, Manson JE, Ludwig D, Willett W, Hu FB. Effect of low-fat diet interventions versus other diet interventions on long-term weight change in adults: a systematic review and meta-analysis. Lancet Diabetes Endocrinol. 2015;3:968–79. [DOI] [PMC free article] [PubMed] [Google Scholar]
- 54. Lu M, Wan Y, Yang B, Huggins CE, Li D. Effects of low-fat compared with high-fat diet on cardiometabolic indicators in people with overweight and obesity without overt metabolic disturbance: a systematic review and meta-analysis of randomised controlled trials. Br J Nutr. 2018;119:96–108. [DOI] [PubMed] [Google Scholar]
- 55. Manheimer EW, Van Zuuren EJ, Fedorowicz Z, Pijl H. Paleolithic nutrition for metabolic syndrome: systematic review and meta-analysis. Am J Clin Nutr. 2015;102:922–32. [DOI] [PMC free article] [PubMed] [Google Scholar]
- 56. Ghaedi E, Mohammadi M, Mohammadi H, Ramezani-Jolfaie N, Malekzadeh J, Hosseinzadeh M, Salehi-Abargouei A. Effects of a paleolithic diet on cardiovascular disease risk factors: a systematic review and meta-analysis of randomized controlled trials. Adv Nutr. 2019;10:634–46. [DOI] [PMC free article] [PubMed] [Google Scholar]
- 57. Opperman AM, Venter CS, Oosthuizen W, Thompson RL, Vorster HH. Meta-analysis of the health effects of using the glycaemic index in meal-planning. Br J Nutr. 2004;92:367–81. [DOI] [PubMed] [Google Scholar]
- 58. Thomas D, Elliott EJ, Baur L. Low glycaemic index or low glycaemic load diets for overweight and obesity. Cochrane Database Syst Rev. 2007;3:CD005105. [DOI] [PMC free article] [PubMed] [Google Scholar]
- 59. Thomas DE, Elliott EJ. The use of low-glycaemic index diets in diabetes control. Br J Nutr. 2010;104:797–802. [DOI] [PubMed] [Google Scholar]
- 60. Fleming P, Godwin M. Low-glycaemic index diets in the management of blood lipids: a systematic review and meta-analysis. Fam Pract. 2013;30:485–91. [DOI] [PubMed] [Google Scholar]
- 61. Goff LM, Cowland DE, Hooper L, Frost GS. Low glycaemic index diets and blood lipids: a systematic review and meta-analysis of randomised controlled trials. Nutr Metab Cardiovasc Dis. 2013;23:1–10. [DOI] [PubMed] [Google Scholar]
- 62. Schwingshackl L, Hoffmann G. Long-term effects of low glycemic index/load vs. high glycemic index/load diets on parameters of obesity and obesity-associated risks: a systematic review and meta-analysis. Nutr Metab Cardiovasc Dis. 2013;23:699–706. [DOI] [PubMed] [Google Scholar]
- 63. Wang Q, Xia W, Zhao Z, Zhang H. Effects comparison between low glycemic index diets and high glycemic index diets on HbA1c and fructosamine for patients with diabetes: a systematic review and meta-analysis. Prim Care Diabetes. 2015;9:362–9. [DOI] [PubMed] [Google Scholar]
- 64. Clar C, Al-Khudairy L, Loveman E, Kelly SAM, Hartley L, Flowers N, Germanò R, Frost G, Rees K. Low glycaemic index diets for the prevention of cardiovascular disease. Cochrane Database Syst Rev. 2017;7:CD004467. [DOI] [PMC free article] [PubMed] [Google Scholar]
- 65. Evans CEL, Greenwood DC, Threapleton DE, Gale CP, Cleghorn CL, Burley VJ. Glycemic index, glycemic load, and blood pressure: a systematic review and meta-analysis of randomized controlled trials. Am J Clin Nutr. 2017;105:1176–90. [DOI] [PubMed] [Google Scholar]
- 66. Ojo O, Ojo OO, Adebowale F, Wang XH. The effect of dietary glycaemic index on glycaemia in patients with type 2 diabetes: a systematic review and meta-analysis of randomized controlled trials. Nutrients. 2018;10:373. [DOI] [PMC free article] [PubMed] [Google Scholar]
- 67. Zafar MI, Mills KE, Zheng J, Peng MM, Ye X, Chen LL. Low glycaemic index diets as an intervention for obesity: a systematic review and meta-analysis. Obes Rev. 2019;20:290–315. [DOI] [PubMed] [Google Scholar]
- 68. Alhamdan AB, Garcia-Alvarez A, Alzahrnai AH, Karanxha J, Stretchberry DR, Contrera KJ, Utria AF, Cheskin LJ. Alternate-day versus daily energy restriction diets: which is more effective for weight loss? A systematic review and meta-analysis. Obes Sci Pract. 2016;2:293–302. [DOI] [PMC free article] [PubMed] [Google Scholar]
- 69. Headland M, Clifton PM, Carter S, Keogh JB. Weight-loss outcomes: a systematic review and meta-analysis of intermittent energy restriction trials lasting a minimum of 6 months. Nutrients. 2016;8:354. [DOI] [PMC free article] [PubMed] [Google Scholar]
- 70. Cioffi I, Evangelista A, Ponzo V, Ciccone G, Soldati L, Santarpia L, Contaldo F, Pasanisi F, Ghigo E, Bo S. Intermittent versus continuous energy restriction on weight loss and cardiometabolic outcomes: a systematic review and meta-analysis of randomized controlled trials. J Transl Med. 2018;16:371. [DOI] [PMC free article] [PubMed] [Google Scholar]
- 71. Harris L, Hamilton S, Azevedo LB, Olajide J, De Brún C, Waller G, Whittaker V, Sharp T, Lean M, Hankey C et al.. Intermittent fasting interventions for treatment of overweight and obesity in adults: a systematic review and meta-analysis. JBI Database System Rev Implement Rep. 2018;16:507–47. [DOI] [PubMed] [Google Scholar]
- 72. Harris L, McGarty A, Hutchison L, Ells L, Hankey C. Short-term intermittent energy restriction interventions for weight management: a systematic review and meta-analysis. Obes Rev. 2018;19:1–13. [DOI] [PubMed] [Google Scholar]
- 73. Roman YM, Dominguez MC, Easow TM, Pasupuleti V, White CM, Hernandez AV. Effects of intermittent versus continuous dieting on weight and body composition in obese and overweight people: a systematic review and meta-analysis of randomized controlled trials. Int J Obes. 2019;43:2017–27. [DOI] [PubMed] [Google Scholar]
- 74. Esposito K, Kastorini CM, Panagiotakos DB, Giugliano D. Mediterranean diet and weight loss: meta-analysis of randomized controlled trials. Metab Syndr Relat Disord. 2011;9:1–12. [DOI] [PubMed] [Google Scholar]
- 75. Kastorini CM, Milionis HJ, Esposito K, Giugliano D, Goudevenos JA, Panagiotakos DB. The effect of Mediterranean diet on metabolic syndrome and its components. A meta-analysis of 50 studies and 534,906 individuals. J Am Coll Cardiol. 2011;57:1299–313. [DOI] [PubMed] [Google Scholar]
- 76. Nordmann AJ, Suter-Zimmermann K, Bucher HC, Shai I, Tuttle KR, Estruch R, Briel M. Meta-analysis comparing Mediterranean to low-fat diets for modification of cardiovascular risk factors. Am J Med. 2011;124:841–51. [DOI] [PubMed] [Google Scholar]
- 77. Huo R, Du T, Xu Y, Xu W, Chen X, Sun K, Yu X. Effects of Mediterranean-style diet on glycemic control, weight loss and cardiovascular risk factors among type 2 diabetes individuals: a meta-analysis. Eur J Clin Nutr. 2015;69:1200–8. [DOI] [PubMed] [Google Scholar]
- 78. Esposito K, Maiorino MI, Bellastella G, Chiodini P, Panagiotakos D, Giugliano D. A journey into a Mediterranean diet and type 2 diabetes: a systematic review with meta-analyses. BMJ Open. 2015;5:e008222. [DOI] [PMC free article] [PubMed] [Google Scholar]
- 79. Garcia M, Bihuniak JB, Shook J, Kenny A, Kerstetter J, Huedo-Medina TB. The effect of the traditional Mediterranean-style diet on metabolic risk factors: a meta-analysis. Nutrients. 2016;8:168. [DOI] [PMC free article] [PubMed] [Google Scholar]
- 80. Gay HC, Rao SG, Vaccarino V, Ali MK. Effects of different dietary interventions on blood pressure. Hypertension. 2016;67:733–9. [DOI] [PubMed] [Google Scholar]
- 81. Ndanuko RN, Tapsell LC, Charlton KE, Neale EP, Batterham MJ. Dietary patterns and blood pressure in adults: a systematic review and meta-analysis of randomized controlled trials. Adv Nutr. 2016;7:76–89. [DOI] [PMC free article] [PubMed] [Google Scholar]
- 82. Nissensohn M, Román-Viñas B, Sánchez-Villegas A, Piscopo S, Serra-Majem L. The effect of the Mediterranean diet on hypertension: a systematic review and meta-analysis. J Nutr Educ Behav. 2016;48:42–53..e1. [DOI] [PubMed] [Google Scholar]
- 83. Ramezani-Jolfaie N, Mohammadi M, Salehi-Abargouei A. The effect of healthy Nordic diet on cardio-metabolic markers: a systematic review and meta-analysis of randomized controlled clinical trials. Eur J Clin Nutr. 2019;58:2159–74. [DOI] [PubMed] [Google Scholar]
- 84. Yokoyama Y, Nishimura K, Barnard ND, Takegami M, Watanabe M, Sekikawa A, Okamura T, Miyamoto Y. Vegetarian diets and blood pressure: a meta-analysis. JAMA Intern Med. 2014;174:577–87. [DOI] [PubMed] [Google Scholar]
- 85. Yokoyama Y, Barnard ND, Levin SM, Watanabe M. Vegetarian diets and glycemic control in diabetes: a systematic review and meta-analysis. Cardiovasc Diagn Ther. 2014;4:373–82. [DOI] [PMC free article] [PubMed] [Google Scholar]
- 86. Barnard ND, Levin SM, Yokoyama Y. A systematic review and meta-analysis of changes in body weight in clinical trials of vegetarian diets. J Acad Nutr Diet. 2015;115:954–69. [DOI] [PubMed] [Google Scholar]
- 87. Huang RY, Huang CC, Hu FB, Chavarro JE. Vegetarian diets and weight reduction: a meta-analysis of randomized controlled trials. J Gen Intern Med. 2015;31:109–16. [DOI] [PMC free article] [PubMed] [Google Scholar]
- 88. Wang F, Zheng J, Yang B, Jiang J, Fu Y, Li D. Effects of vegetarian diets on blood lipids: a systematic review and meta-analysis of randomized controlled trials. J Am Heart Assoc. 2015;4:e002408. [DOI] [PMC free article] [PubMed] [Google Scholar]
- 89. Yokoyama Y, Levin SM, Barnard ND. Association between plant-based diets and plasma lipids: a systematic review and meta-analysis. Nutr Rev. 2017;75:683–98. [DOI] [PMC free article] [PubMed] [Google Scholar]
- 90. Picasso MC, Lo-Tayraco JA, Ramos-Villanueva JM, Pasupuleti V, Hernandez AV. Effect of vegetarian diets on the presentation of metabolic syndrome or its components: a systematic review and meta-analysis. Clin Nutr. 2019;38:1117–32. [DOI] [PubMed] [Google Scholar]
- 91. Viguiliouk E, Kendall CWK, Kahleová H, Rahelić D, Salas-Salvadó J, Choo VL, Mejia SB, Stewart SE, Leiter LA, Jenkins DJ et al.. Effect of vegetarian dietary patterns on cardiometabolic risk factors in diabetes: a systematic review and meta-analysis of randomized controlled trials. Clin Nutr. 2019;38:1133–45. [DOI] [PubMed] [Google Scholar]
- 92. Lopez PD, Cativo EH, Atlas SA, Rosendorff C. The effect of vegan diets on blood pressure in adults: a meta-analysis of randomized controlled trials. Am J Med. 2019;132:875–883.e7. [DOI] [PubMed] [Google Scholar]
- 93. Shirani F, Salehi-Abargouei A, Azadbakht L. Effects of Dietary Approaches to Stop Hypertension (DASH) diet on some risk for developing type 2 diabetes: a systematic review and meta-analysis on controlled clinical trials. Nutrition. 2013;29:939–47. [DOI] [PubMed] [Google Scholar]
- 94. Saneei P, Salehi-Abargouei A, Esmaillzadeh A, Azadbakht L. Influence of Dietary Approaches to Stop Hypertension (DASH) diet on blood pressure: a systematic review and meta-analysis on randomized controlled trials. Nutr Metab Cardiovasc Dis. 2014;24:1253–61. [DOI] [PubMed] [Google Scholar]
- 95. Siervo M, Lara J, Chowdhury S, Ashor A, Oggioni C, Mathers JC. Effects of the Dietary Approach to Stop Hypertension (DASH) diet on cardiovascular risk factors: a systematic review and meta-analysis. Br J Nutr. 2015;113:1–15. [DOI] [PubMed] [Google Scholar]
- 96. Soltani S, Shirani F, Chitsazi MJ, Salehi-Abargouei A. The effect of dietary approaches to stop hypertension (DASH) diet on weight and body composition in adults: a systematic review and meta-analysis of randomized controlled clinical trials. Obes Rev. 2016;17:442–54. [DOI] [PubMed] [Google Scholar]
- 97. Chiavaroli L, Nishi SK, Khan TA, Braunstein CR, Glenn AJ, Blanco Mejia S, Rahelić D, Kahleová H, Salas-Salvadó J, Jenkins DJA et al.. Portfolio dietary pattern and cardiovascular disease: a systematic review and meta-analysis of controlled trials. Prog Cardiovasc Dis. 2018;61:43–53. [DOI] [PubMed] [Google Scholar]
- 98. Elidottir AS, Halldorsson TI, Gunnarsdottir I, Ramel A. Dietary intake and cardiovascular risk factors in Icelanders following voluntarily a low carbohydrate diet. PLoS One. 2016;11:e0156655. [DOI] [PMC free article] [PubMed] [Google Scholar]
- 99. Westerterp-Plantenga MS, Nieuwenhuizen A, Tomé D, Soenen S, Westerterp KR. Dietary protein, weight loss, and weight maintenance. Annu Rev Nutr. 2009;29:21–41. [DOI] [PubMed] [Google Scholar]
- 100. Forouhi NG, Krauss RM, Taubes G, Willett W. Dietary fat and cardiometabolic health: evidence, controversies, and consensus for guidance. BMJ. 2018;361:k2139. [DOI] [PMC free article] [PubMed] [Google Scholar]
- 101. Satija A, Bhupathiraju SN, Spiegelman D, Chiuve SE, Manson JE, Willett W, Rexrode KM, Rimm EB, Hu FB. Healthful and unhealthful plant-based diets and the risk of coronary heart disease in US adults. J Am Coll Cardiol. 2017;70:411–22. [DOI] [PMC free article] [PubMed] [Google Scholar]
- 102. Konner M, Eaton SB. Paleolithic nutrition: twenty-five years later. Nutr Clin Pract. 2010;25:594–602. [DOI] [PubMed] [Google Scholar]
Associated Data
This section collects any data citations, data availability statements, or supplementary materials included in this article.