

Abstract
Casein kinase 1 alpha (CK1α) is a serine/threonine kinase with numerous functions, including regulating the Wnt/β‐catenin and p53 pathways. CK1α has a well‐established role in inhibiting the p53 tumor suppressor by binding to MDMX and stimulating MDMX‐p53 interaction. MDMX purified from cells contains near‐stoichiometric amounts of CK1α, suggesting that MDMX may in turn regulate CK1α function. We present evidence that MDMX is a potent competitive inhibitor of CK1α kinase activity (K i = 8 nM). Depletion of MDMX increases CK1α activity and β‐catenin S45 phosphorylation, whereas ectopic MDMX expression inhibits CK1α activity and β‐catenin phosphorylation. The MDMX acidic domain and zinc finger are necessary and sufficient for binding and inhibition of CK1α. P53 binding to MDMX disrupts an intramolecular auto‐regulatory interaction and enhances its ability to inhibit CK1α. P53‐null mice expressing the MDMXW 200S/W201G mutant, defective in CK1α binding, exhibit reduced Wnt/β‐catenin target gene expression and delayed tumor development. Therefore, MDMX is a physiological inhibitor of CK1α and has a role in modulating cellular response to Wnt signaling. The MDMX‐CK1α interaction may account for certain p53‐independent functions of MDMX.
Keywords: CK1α, inhibitor, kinase, MDMX, β‐catenin
Subject Categories: Cancer; Post-translational Modifications, Proteolysis & Proteomics; Signal Transduction
While CK1α is known to inhibit tumor suppressor p53 through MDMX, suppression of CK1α‐mediated β‐catenin phosphorylation in turn exemplifies a p53‐independent pro‐tumorigenic activity of MDMX.
Introduction
The P53 tumor suppressor protein plays a critical role in regulating proliferation, cell death, and differentiation. P53 is activated by a plethora of cellular stress such as DNA damage, oncogene activation, replicative stress, and hypoxia (Vousden & Lane, 2007). The activated p53 binds to responsive DNA elements to stimulate the transcription of numerous target genes that orchestrate stress tolerance, DNA repair, cell cycle arrest, apoptosis, and tumor suppression (Vousden & Prives, 2009). P53 is mutated in > 50% of human tumors, and mutant p53 loses transcriptional activity and gains new functions that drive tumor progression (Freed‐Pastor & Prives, 2012).
The RING domain‐containing proteins MDM2 and MDMX control the cellular level and transcriptional activity of p53 (Karni‐Schmidt et al, 2016). Both MDM2 and MDMX are transcription targets of p53 and contain p53‐responsive elements in their promoters, thus forming negative feedback loops that regulate p53 during stress response (Wu et al, 1993; Li et al, 2010; Phillips et al, 2010). MDM2 binds to p53 N terminus to promote p53 ubiquitination and degradation in the absence of stress. MDMX has a less prominent role in regulating p53 ubiquitination, but its central acidic domain engages in second‐site interaction with p53 core domain and inhibits DNA binding (Wei et al, 2016). MDM2 knockout in the mouse causes early (embryonic day 4) lethality due to p53 accumulation and apoptosis (Montes de Oca Luna et al, 1995). MDMX knockout also leads to p53‐mediated embryonic lethality (embryonic day 7) due to inhibition of cell proliferation (Parant et al, 2001).
The embryonic lethal phenotypes of MDM2 and MDMX knockout can be rescued by codeletion of p53, suggesting the main functions of these proteins are to regulate p53. However, recent work implicated p53‐independent functions of MDM2 and MDMX that may contribute to control of cellular homeostasis and malignant transformation. MDM2 interacts with ribosomal proteins, chromatin modifying factors, and DNA repair factors. MDMX also interacts with several proteins including CK1α, 14‐3‐3, p73, Peli1, and Nbs1 (Chen et al, 2005b; Carrillo et al, 2015; Li et al, 2018). MDMX/p53 double knockout mice develop tumors at younger age compared to p53‐null mice, suggesting that MDMX has tumor‐suppressive activity (Matijasevic et al, 2008). MDMX overexpression causes genomic instability in the absence of p53 and promotes invasion by tumor cells with mutant p53, suggesting that MDMX has p53‐independent activity or cooperates with mutant p53 to promote transformation (Carrillo et al, 2015; Gao et al, 2019). Knockdown of MDMX attenuates the growth of basal breast tumor cell lines with p53 mutations, indicating that MDMX has oncogenic activity separate from inhibiting wild‐type p53 (Miranda et al, 2017). Furthermore, MDMX transgenic mice in a p53‐null background showed enhanced tumor development (Xiong et al, 2017).
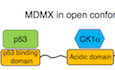
Although the molecular basis of p53‐independent MDMX functions remains unclear, it is likely to be mediated by MDMX interaction with other proteins. We previously identified CK1α as a stable binding partner of MDMX (Chen et al, 2005b). MDMX‐CK1α interaction is highly isoform‐specific. MDMX only binds to CK1α but not CK1δ and CK1ε, whereas MDM2 does not stably interact with any CK1 isoform (Wu et al, 2012). CK1α interacts with the central region of MDMX, requiring both the acidic domain and zinc finger. CK1α phosphorylates MDMX acidic domain on S289 and stimulates MDMX‐p53 binding by disrupting the intramolecular interaction between the p53 binding domain and a conserved W200/W201 sequence in the acidic domain (Chen et al, 2005b, 2015). DNA damage signaling causes Chk2‐mediated phosphorylation of MDMX S367 and disrupts MDMX‐CK1α interaction (Wu et al, 2012). Tissue‐specific knockout of CK1α in the mouse intestine causes p53 activation and cellular senescence, demonstrating that it is a physiological regulator of p53 (Elyada et al, 2011). We showed that several tumor‐derived CK1α point mutants located to the substrate‐binding cleft stimulated MDMX‐CK1α interaction, suggesting that MDMX may bind to the substrate‐binding site of CK1α (Liu et al, 2019). Whether the binding between MDMX and CK1α affects CK1α function has not been addressed.
CK1α is the smallest isoform of CK1 family serine/threonine kinases and is involved in regulating multiple cellular pathways (Knippschild et al, 2014). CK1α has a prominent role in Wnt/β‐catenin signaling by inducing priming phosphorylation of β‐catenin S45, which is needed for subsequent phosphorylation of T41/S37/S33 by GSK‐β, ubiquitination by the SCF β‐TrCP E3 ligase, and degradation by the proteasome (Winston et al, 1999; Clevers & Nusse, 2012). In the canonical Wnt signaling pathway, CK1α is recruited by Axin into a destruction complex containing Axin, APC, and GSK3 to promote phosphorylation of β‐catenin. Wnt ligand activation of the Fz/LRP coreceptor inhibits Axin1‐CK1α interaction and causes accumulation of free β‐catenin (Clevers & Nusse, 2012). Therefore, CK1α is required for suppressing β‐catenin transcription of cell proliferation genes. Several other pathways, such as NFκb and Foxo transcription factors, and circadian pathway are also regulated by CK1α (Knippschild et al, 2014; Zhang et al, 2018). CK1α contains a kinase domain and very little extra peptide sequence (~ 30 aa), thus appears to be constitutively active. Little is known whether CK1α activity is regulated in the cell. Recently, the RNA helicase DDX3 was shown to be an activator of CK1ε and CK1α in vitro (Cruciat et al, 2013). However, biosensor analysis showed that only CK1ε but not CK1α was activated by DDX3 in vivo (Dolde et al, 2018).
In this report, we describe evidence that MDMX acts as a potent inhibitor of CK1α kinase activity by forming a stable complex. Physiological level of MDMX expression has measurable effects on endogenous CK1α activity and substrate phosphorylation. The N terminal p53‐binding domain limits the ability of MDMX central region to inhibit CK1α. Mutational disruption of MDMX‐CK1α binding in mice down‐regulates Wnt signaling, reduces cell proliferation, and delays tumor development in a p53‐null background. The results identify a new activity of MDMX important for its p53‐independent functions.
Results
MDMX inhibits CK1α kinase activity
To test whether MDMX inhibits CK1α activity, Myc‐tagged β‐catenin was transfected with CK1α in p53‐null H1299 lung tumor cells. Transfection of CK1α stimulated β‐catenin S45 phosphorylation, and coexpression of MDMX blocked the increase of pS45 level despite causing CK1α accumulation (Fig 1A). The CK1α binding‐deficient mutant MDMXSG (W200S/W201G) or truncation mutant MDMX‐1‐300 had no effect. Three mutants that retain the CK1α binding domain (MDMX‐1‐361, MDMX‐100‐361, and MDMX‐101‐490) also inhibited β‐catenin phosphorylation (Fig 1A), suggesting that CK1α binding was required for the inhibition. MDMX‐CK1α binding caused significant increase in CK1α expression level (Fig 1A, addressed below). Certain mutants (1–361, 100–361) were more potent than wt MDMX in inhibiting β‐catenin phosphorylation, which will be addressed further below (Fig 4).
Figure 1. MDMX inhibits CK1α kinase activity.

- H1299 cells were transfected with Myc‐β‐catenin, CK1α, and MDMX mutants. Phosphorylation of β‐catenin S45 was determined by Western blot. Coexpression of MDMX blocked the increase of pS45 level. MDMXSG (W200S/W201G) and MDMX‐1‐300 were defective for CK1α binding.
- GST‐β‐catenin‐1‐200 was incubated with purified FLAG‐CK1α, FLAG‐MDMX, and ATP at indicated ratios. Phosphorylation of β‐catenin S45 was determined by Western blot. MDMXS289A contains mutation of CK1α phosphorylation site.
- Kinetic characterization of CK1α inhibition by MDMX. Reaction velocity as a function of β‐catenin peptide substrate and increasing MDMX concentrations at 100 μM ATP and 2 nM CK1α. Data were fitted to the Michaelis–Menten equation. The resulting parameter values are shown in the table. See Fig EV2A and B for same data fitted to competitive inhibition and allosteric sigmoidal models.
- Reaction velocity as a function of ATP and increasing MDMX concentrations at 800 μM peptide substrate and 2 nM CK1α. Data were fitted to the Michaelis–Menten equation. See Fig EV2C for same data fitted to mixed inhibition model.
Source data are available online for this figure.
To determine whether MDMX inhibits CK1α kinase activity in vitro, FLAG‐CK1α was expressed in H1299 cells and purified using M2 beads. FLAG‐MDMX was expressed and purified from Escherichia coli. The ability of CK1α to phosphorylate GST‐β‐catenin‐1‐200 in vitro was detected by pS45 Western blot. MDMX (but not the binding‐deficient MDMXSG) showed a dose‐dependent inhibition of CK1α (Fig 1B), detectable at 5:1 MDMX:CK1α ratio. Mutating the CK1α phosphorylation site on MDMX (S289A) did not affect its ability to inhibit CK1α (Fig 1B). MDM2 did not bind CK1α and showed no inhibition of CK1α activity (Fig EV1A). MDMX‐CK1α binding after mixing in vitro was confirmed by co‐IP analysis (Fig EV1B). The results suggest that MDMX‐CK1α interaction inhibits the kinase activity.
Figure EV1. MDMX inhibits CK1α kinase activity.

- GST‐β‐catenin‐1‐200 was incubated with purified FLAG‐CK1α, GST‐MDMX, GST‐MDM2, and ATP at indicated ratios. Phosphorylation of β‐catenin S45 was determined by Western blot.
- Purified recombinant FLAG‐MDMX and GST‐MDM2 were incubated with lysate of H1299 transfected with CK1α. MDMX was immunoprecipitated using FLAG antibody, and MDM2 was pulled down using glutathione beads; coprecipitation of CK1α was detected by Western blot.
Source data are available online for this figure.
Kinetic analysis was performed using a β‐catenin peptide (Cat45S, aa 38–61) as substrate. Data were fitted to several models to identify potential mechanism of inhibition and determine the major kinetic parameters. In the presence of 100 μM ATP, the K m of CK1α for the peptide substrate was 676 μM (Fig 1C). MDMX increased the K m and inhibited the reaction consistent with a competitive mode of action, in which MDMX competes with β‐catenin for binding to CK1α with an inhibition constant of K i = 8.2 nM (Fig EV2A). Peptide concentrations above 1.5 mM significantly inhibited the reaction, preventing product formation to reach saturation. The presence of MDMX also appeared to induce a sigmoidal curve shape (Fig EV2B), suggesting an allosteric mode of action in which MDMX increases cooperativity of β‐catenin binding, perhaps by priming the flexible activation loop toward more efficient interaction with substrate and/or the release of product. The K m value of CK1α for ATP was 9.6 μM and decreased with increasing MDMX concentrations along with a decrease of maximum velocity (Fig 1D). The data support a mixed inhibition model, in which MDMX preferentially binds to the CK1α‐ATP complex with a K i value of 23 nM (Fig EV2C). Overall, MDMX appeared to act mainly by two mechanisms: (i) preferential binding to CK1α‐ATP complex as an uncompetitive inhibitor of phosphorylation reaction and (ii) competitively blocking β‐catenin binding to CK1α.
Figure EV2. Kinetic characterization of CK1α inhibition by MDMX .

- Reaction velocity as a function of β‐catenin peptide substrate and increasing MDMX concentrations at 100 μM ATP and 2 nM CK1α. Data in Fig 1C were fitted to the competitive inhibition model.
- Same as (A) but data fitted to the allosteric sigmoidal model.
- Reaction velocity as a function of ATP and increasing MDMX concentrations at 800 μM peptide substrate and 2 nM CK1α. Data in Fig 1D were fitted to the mixed inhibition model. The value of the parameter Alpha determines the mechanism of inhibition, and Alpha < 1 indicates that the inhibitor preferentially binds to the enzyme–substrate complex. Equations used for data fitting are shown in the respective graph titles. The results are representative of 3 experiments.
MDMX expression inhibits CK1α activity in cells
To determine whether MDMX regulates endogenous CK1α activity, MDMX and MDMXSG were stably expressed in p53‐null H1299 cells and primary human foreskin fibroblast HFF. Similar to cotransfection experiments, endogenous CK1α accumulated after MDMX expression, but endogenous β‐catenin pS45 level was decreased (Fig 2A and B). In contrast, transfection of CK1α plasmid increased CK1α level and also stimulated β‐catenin pS45 level (Fig 2C). HFF cells overexpressing MDMX (but not MDMXSG) showed modestly increased expression of β‐catenin target Axin2 after stimulation with Wnt3a ligand (Fig EV3A), suggesting that MDMX regulation of CK1α activity leads to increased Wnt response in non‐transformed cells. For unknown reason, H1299 cells overexpressing MDMX did not show enhanced response to Wnt3a.
Figure 2. MDMX expression inhibits CK1α activity in cells.

-
A, BH1299 cells and human foreskin fibroblasts HFF were stably infected with lentivirus expressing MDMX and analyzed by Western blot.
-
CH1299 cells were transiently transfected with CK1α plasmid and analyzed for β‐catenin phosphorylation by Western blot.
-
DCytoplasmic and nuclear fractions of H1299 cells stably expressing MDMX were analyzed for indicated markers.
-
EExtract of H1299 expressing MDMX at indicated amounts were analyzed for β‐catenin S45 kinase activity in a titration assay.
-
FExtracts of H1299 cells separately transfected with MDMX or CK1α were mixed in the presence of CK1α inhibitors. In vitro formation of MDMX‐CK1α complex was detected by MDMX IP followed by CK1α Western blot.
Source data are available online for this figure.
Figure EV3. Ectopic expression of MDMX enhances response to Wnt ligand.
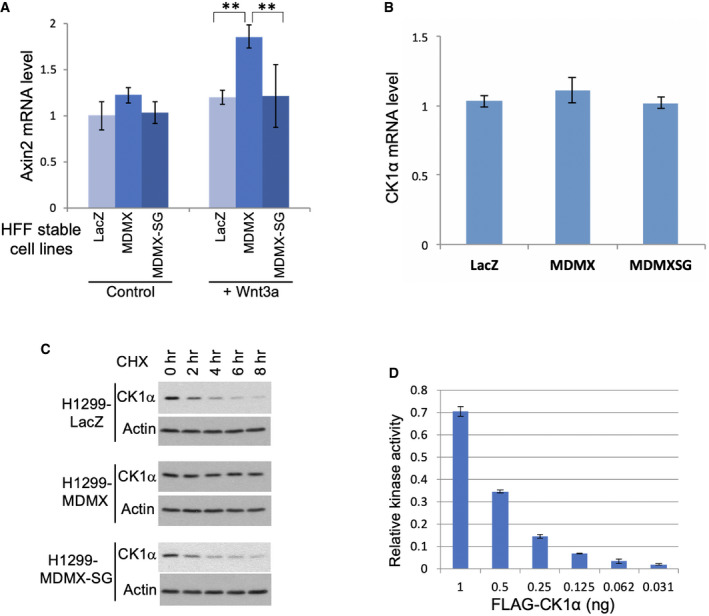
- HFF cells stably infected with lentivirus expressing MDMX in 4 ml cultures were treated with 20 μl conditioned medium containing Wnt3a for 24 h. Axin2 mRNA level was determined by RT–PCR (average of 3 experiments, mean ± SD). **P < 0.01 (Student's t‐test).
- CK1α mRNA level in H1299 cells with stable MDMX overexpression was determined by RT–PCR (average of 3 experiments, mean ± SD).
- CK1α protein degradation rate in H1299 cells with stable MDMX overexpression was determined by inhibiting protein synthesis using 100 μg/ml cycloheximide for indicated durations followed by Western blot.
- ELISA plates coated with GST‐β‐catenin‐1‐200 were incubated with 1 mM ATP and indicated amounts of CK1α. S45 phosphorylation level was detected by ELISA using pS45‐specific antibody as described in Materials and Methods (average of 3 experiments, mean ± SD).
Source data are available online for this figure.
RT–PCR and protein turnover analyses showed that MDMX did not affect CK1α mRNA level but increased the half‐life of CK1α protein, accounting for its accumulation (Fig EV3B and C). Cell fractionation analysis showed MDMX was predominantly cytoplasmic (Fig 2D). MDMX expression caused redistribution of CK1α into the cytoplasm and reduced nuclear CK1α level (Fig 2D). Both cytoplasmic and nuclear β‐catenin pS45 level were reduced by MDMX expression. The results suggest that MDMX inhibits CK1α activity and also sequesters CK1α in the cytoplasm.
To confirm that endogenous CK1α was inhibited by MDMX, the ability of cell extract to phosphorylate GST‐β‐catenin in vitro was determined. Titration analysis was performed to compare different amounts of cell extracts for CK1α kinase activity and CK1α protein level. H1299‐lacZ extract contained > 8‐fold higher CK1α kinase activity compared to H1299‐MDMX (Fig 2E, compare lanes 1 and 8 for similar pS45 signal.), but only contained 1/8 the amount of CK1α (Fig 2E, compare lanes 4 and 5 for similar CK1α level.). Therefore, the specific activity of CK1α in H1299‐lacZ extract was 64‐fold higher than H1299‐MDMX extract. The H1299‐MDMXSG extract had normal S45 kinase activity as expected (Fig 2E).
Kinetic analysis suggested MDMX preferentially binds to the CK1α‐ATP complex (Figs 1D and EV2C). Therefore, the ATP binding site of CK1α may directly or allosterically interact with MDMX. This hypothesis predicts that ATP‐competitive CK1α inhibitors may alter the ATP binding site conformation and affect MDMX binding. As expected, in an in vitro complex formation assay CK1α inhibitors IC‐261 and D4476 inhibited MDMX‐CK1α binding (Fig 2F), whereas CKI‐7 stimulated the interaction (Rena et al, 2004).
Endogenous MDMX expression inhibits CK1α activity
To determine whether endogenous MDMX regulates CK1α activity, MDMX in H1299 (p53‐null), 293T (wt p53), MDA468 (mutant p53) and A549 (wt p53) cells was knocked down using RNAi. Depletion of MDMX increased endogenous β‐catenin pS45 level (Fig 3A–D). To measure CK1α kinase activity in cell extract, an ELISA assay was established. Plates coated with GST‐β‐catenin‐1‐200 were incubated with cell extract and ATP, and pS45 level was detected by ELISA using specific antibody. The ability of the assay to quantitatively measure CK1α activity was validated using purified FLAG‐CK1α (Fig EV3D). The assay confirmed that knockdown of endogenous MDMX increased S45 kinase activity by ~ 30% in the cell extracts, whereas MDM2 siRNA had no effect (Fig 3E). Despite the increase in S45 kinase activity, CK1α protein level decreased slightly in H1299 after MDMX knockdown (Fig 3A), suggesting its catalytic activity increased after MDMX depletion. It should be noted that because cell extract preparation leads to dilution of MDMX, the in vitro kinase activity assay will underestimate the effect of MDMX in vivo. The results showed that endogenous MDMX played a role in inhibiting CK1α activity.
Figure 3. Endogenous MDMX expression inhibits CK1α activity.

-
A–DCells were treated with MDMX siRNA for 48 h and analyzed for β‐catenin pS45 level by Western blot.
-
EH1299 and 293T cells were treated with indicated siRNA for 48 h. The activity of β‐catenin S45 kinase in cell extracts was determined using an ELISA assay. The results are average of 3 experiments (mean ± SD). *P < 0.05 (Student's t‐test).
Source data are available online for this figure.
The p53‐binding domain and RING domain regulate MDMX ability to inhibit CK1α
We previously showed the p53 binding domain and RING domain of MDMX engage in intramolecular interactions with the acidic domain. CK1α binding to the acidic domain releases the p53‐binding domain and stimulates MDMX‐p53 interaction (Chen et al, 2015). Reciprocally, the N and C terminal domains may regulate MDMX inhibition of CK1α. To test this hypothesis, purified GST‐MDMX truncation mutants were compared for inhibition of CK1α in vitro (Fig 4A). The results showed that deleting the p53‐binding domain (MDMX‐181‐490) or RING domain (MDMX‐1‐361) each increased the CK1α inhibition potency by ~ 16‐fold (Fig 4B and C). Deletion of both N and C terminus (GST‐MDMX‐100‐361) only provided modest additional gain in potency (Fig 4D). The potency of MDMX in transfected H1299 cells was also increased after deletion of N and C terminal domains (Fig 1A). Therefore, MDMX inhibition of CK1α was negatively regulated by intramolecular interactions with N and C terminal domains.
Figure 4. The p53‐binding and RING domains regulate MDMX ability to inhibit CK1α.

-
ADiagram of MDMX mutant constructs and summary of CK1α inhibitory efficiency. The result of MDMXSG was based on Fig 1B (position of W200S/W201G mutation is marked with **).
-
B–DGST‐β‐catenin‐1‐200 was incubated with ATP, CK1α, and GST‐MDMX mutants at indicated ratios. The level of pS45 was determined by Western blot.
Source data are available online for this figure.
Mutant p53 cooperates with MDMX to inhibit CK1α
Previous work showed CK1α binding to MDMX acidic domain displaces the p53‐binding domain and stimulates MDMX‐p53 interaction (Fig 5A; Chen et al, 2015). To test whether p53 binding to MDMX N terminus stimulates inhibition of CK1α, the effect of a high affinity p53‐mimetic peptide pDI was tested (Hu et al, 2007). MDMX inhibition of CK1α in vitro was stimulated by pDI but not the control peptide pDI3A (Fig 5B). As expected, pDI had no effect on MDMX‐181‐490 without the p53 binding domain (Fig 5B). The result suggests that p53 binding stimulates the ability of MDMX to inhibit CK1α.
Figure 5. P53 cooperates with MDMX to inhibit CK1α.

- Diagram of MDMX intramolecular interactions and communication between p53 and CK1α binding.
- Purified FLAG‐CK1α was incubated with ATP, GST‐MDMX, GST‐β‐catenin‐1‐200, pDI peptide (LTFEHYWAQLTS, 5 μM), and pDI3A peptide (LTAEHYAAQATS, 5 μM). β‐catenin pS45 level were determined by Western blot.
- H1299 cells were cotransfected with MDMX, CK1α, and p53 mutants. MDMX‐CK1α binding was determined by IP‐Western blot.
- Endogenous p53 in A549 (wt) and Panc1 (R273H) cells were depleted by CRISPR/Cas9 knockout. β‐catenin pS45 level was determined by Western blot.
- The β‐catenin S45 kinase activity in A549 and Panc1 cells was determined using ELISA kinase activity assay. The results are average of 3 experiments (mean ± SD). *P < 0.05 (Student's t‐test).
Source data are available online for this figure.
In a cotransfection assay, p53 contact (R273H) and conformation (R175H, G245S, R249S, R282W) mutants stimulated MDMX‐CK1α complex formation (Fig 5C). The effect of wt p53 was inconclusive due to strong inhibition of MDMX and CK1α expression. To determine whether endogenous p53 affects CK1α activity, the p53 in A549 (wt) and Panc1 (R273H) cells were depleted using CRISPR/Cas9 targeting. Endogenous β‐catenin S45 phosphorylation increased modestly after p53 knockout in both cell lines (Fig 5D). The activity of β‐catenin S45 kinase in cell extracts increased 30‐45% after knockout of p53 (Fig 5E). The results suggest that p53 may regulate the ability of MDMX to bind and inhibit CK1α.
Tumor‐derived CK1α mutants are hypersensitive to inhibition by MDMX
Missense mutations of CK1α were detected in a variety of tumors at low frequency. We recently showed CK1α mutants E42A, E98K, and D140A increased MDMX binding to various degrees (Fig 6A; Liu et al, 2019). In the in vitro kinase assay, E42A was highly sensitive to inhibition by MDMX, consistent with its strong MDMX binding (Fig 6B). E98K and D140A had inherently weaker kinase activity toward β‐catenin in the absence of MDMX (Fig 6C). Furthermore, both E98K and D140A showed modestly increased sensitivity to inhibition by MDMX (Fig 6D). The combination of these two phenotypes may explain previous finding that E98K and D140A had significant deficiency in promoting β‐catenin S45 phosphorylation in cells (Liu et al, 2019). Therefore, the tumor‐derived CK1α mutations increase sensitivity to inhibition by MDMX. This feature may facilitate tumor progression by reducing β‐catenin S45 phosphorylation and increasing response to Wnt signaling (Liu et al, 2019).
Figure 6. Tumor‐derived CK1α mutants are hypersensitive to inhibition by MDMX .

- H1299 cells were transfected with MDMX and CK1α mutants. MDMX‐CK1α binding was determined by IP‐Western blot.
- GST‐β‐catenin‐1‐200 was incubated with ATP, CK1α, and GST‐MDMX. The level of pS45 was determined by Western blot.
- GST‐β‐catenin‐1‐200 was incubated with identical amounts of purified FLAG‐CK1α mutants and ATP. The level of pS45 was determined by Western blot.
- ELISA plates coated with GST‐β‐catenin‐1‐200 was incubated with purified FLAG‐CK1α mutants, ATP, and MDMX. The level of pS45 was determined by ELISA assay. The results are average of 3 experiments (mean ± SD).
Source data are available online for this figure.
Disruption of MDMX‐CK1α interaction in vivo reduces Wnt pathway expression
To investigate whether MDMX‐CK1α interaction has physiological effects in vivo, mutant mice with a targeted W200S/W201G mutation (MDMX SG) were crossed into p53‐null background. In a previous study, the MDMX SG mutation caused chronic activation of p53 in vivo due to increased p53 DNA binding (Huang et al, 2018). The mouse MDMXSG protein was defective for binding CK1α in tissues (Huang et al, 2018). The p53 −/− ;MDMX SG/SG homozygous mice were used here to determine the p53‐independent effect of MDMX‐CK1α interaction.
Corroborating the human cell line analyses, three MEF lines with p53 −/− ;MDMX SG/SG genotype showed modestly increased β‐catenin pS45 levels compared to 3 p53 −/− ;MDMX wt/wt lines (Fig 7A). ELISA kinase assay showed the p53 −/− ;MDMX SG/SG MEFs had increased CK1α activity (Fig 7B). The results suggest that MDMX binding also plays a role in suppressing CK1α activity and β‐catenin phosphorylation in non‐transformed cells.
Figure 7. Disruption of MDMX‐CK1α interaction in vivo down‐regulates Wnt pathway.

- MEF cell lines derived from 3 p53 −/− ;MDMX SG/SG and 3 p53 −/− ;MDMX wt/wt embryos were analyzed for β‐catenin pS45 level by Western blot.
- CK1α activity in MEF cell extracts was determined using ELISA kinase activity assay. The results are average of 3 experiments (mean ± SD). *P < 0.01 (Student's t‐test).
- Volcano plot of differential gene expression between p53 −/− ;MDMX SG/SG and p53 −/− ;MDMX wt/wt MEF lines.
- Multiple Wnt signaling genes were down‐regulated in p53 −/− ;MDMX SG/SG MEF cell lines.
- RT–PCR confirmation of Wnt pathway genes down‐regulated in p53 −/− ;MDMX SG/SG MEF (average of 3 cell lines, mean ± SD) and thymus from 1‐month‐old mice (average of 3 mice, mean ± SD). **P < 0.01, *P < 0.05 (Student's t‐test).
- p53 −/− ;MDMX SG/SG and p53 −/− ;MDMX wt/wt cells were treated with conditioned medium containing Wnt3a. Axin2 mRNA level was determined by RT–PCR (average of 3 experiments, mean ± SD). *P < 0.05 (Student's t‐test).
Source data are available online for this figure.
Differential gene expression analysis of p53 −/− ;MDMX SG/SG and p53 −/− ;MDMX wt/wt MEF cell lines by RNA‐seq (see Data Availability) identified 242 genes that were down‐regulated in p53 −/− ;MDMX SG/SG MEF lines by > 1.5‐fold (P < 0.05. Fig 7C). Pathway analysis of down‐regulated genes identified multiple hits (11 genes) in the Wnt pathway (Fig 7D), followed by cadherin signaling (5), inflammation (4), angiogenesis (3), gonadotropin pathway (3), and Alzheimer pathway (3). RT–PCR analysis of 6 Wnt pathway genes confirmed they were significantly down‐regulated in the p53 −/− ;MDMX SG/SG MEF cell lines (Fig 7E). Importantly, thymus tissues of p53 −/− ;MDMX SG/SG mice also showed significant reduction of Wnt pathway genes (Fig 7E).
The transcriptional output of β‐catenin in response to Wnt3a ligand stimulation was analyzed using Axin2 mRNA as readout. Axin2 expression in p53 −/− ;MDMX SG/SG MEFs remained lower than p53 −/− ;MDMX wt/wt MEFs after treatment with low levels of Wnt3a (Fig 7F, 4–20 μl). However, high levels of Wnt3a ligand rescued the Axin2 deficit in p53 −/− ;MDMX SG/SG MEFs (Fig 7F, 100–500 μl). The results demonstrate that disruption of MDMX‐CK1α binding increased CK1α activity, enhanced β‐catenin phosphorylation, and inhibited response to Wnt ligand. The emergence of Wnt pathway as a top hit from unbiased search suggests it was sensitive to the modest change in CK1α activity caused by the MDMX SG mutation.
Disruption of MDMX‐CK1α binding inhibits proliferation and delays tumor development
The p53 −/− ;MDMX SG/SG MEFs showed modestly reduced proliferation rate compared to p53 −/− ;MDMX wt/wt MEFs (Fig 8A). The p53 −/− ;MDMX SG/SG MEFs also formed smaller colonies after plating at single cell density (Fig 8B), suggesting that MDMX has p53‐independent growth‐promoting function by binding and inhibiting CK1α. Similar to previous studies of p53‐null mice, p53 −/− ;MDMX wt/wt mice were tumor‐prone and mainly succumb to thymic lymphomas with a median life span of 137 days. The p53 −/− ;MDMX SG/SG mice had an extended median life span of 165 days (Fig 8C). The results suggest that MDMX has p53‐independent tumor‐promoting activity mediated through inhibition of CK1α and stimulation of Wnt pathway expression.
Figure 8. Disruption of MDMX‐CK1α binding attenuates cell proliferation.

- Identical starting number of cells from the MEF lines was serially passaged following identical schedules. The differences in cell number were determined after 3 and 5 passages. The results are average of 3 experiments (mean ± SD).
- Identical number of cells from the MEF lines were plated at low density and cultured for 14 days. Colony formation efficiency was determined by crystal violate staining.
- Survival curves of p53 −/− ;MDMX SG/SG and p53 −/− ;MDMX wt/wt mice. Thymic lymphomas were the major cause of mortality in both genotypes.
- A model of Wnt signaling regulation by MDMX. In the absence of stress, MDMX inhibits CK1α, increases basal expression of Wnt/β‐catenin target genes, and stimulates proliferation. Interaction with mutant p53 stimulates MDMX‐CK1α binding and promotes proliferation. DNA damage promotes MDMX degradation and inhibits MDMX‐CK1α binding, reducing Wnt signaling.
Discussion
MDMX is an essential inhibitor of p53 during embryonic development, but is expendable for viability in the absence of p53. Analyses of MDMX function without p53 or in the presence of mutant p53 showed that it has growth‐promoting activities (Miranda et al, 2017; Xiong et al, 2017; Gao et al, 2019). Elucidating the mechanism of these activities is needed to understand how the p53 pathway interacts with other pathways to maintain homeostasis. MDMX is also a potential therapeutic target in tumors with mutant p53. Identifying the biochemical basis of its transforming function may lead to new targeting strategies. Previous work revealed that MDMX‐CK1α interaction stimulates MDMX‐p53 binding and inhibits p53 transcriptional activity (Chen et al, 2005b). Our current results reveal a new function of MDMX in inhibiting CK1α kinase activity and stimulating the Wnt/β‐catenin pathway. Disrupting MDMX‐CK1α interaction increased CK1α activity, suppressed Wnt signaling, reduced cell proliferation, and delayed tumor development. Therefore, CK1α is a physiological target of MDMX and a potential mediator of its p53‐independent oncogenic activity.
In a purified system, MDMX is a potent CK1α inhibitor with nanomolar inhibition constant (K i = 8 nM). The intracellular MDMX concentration was estimated to be > 25 nM based on a previous quantitative analysis, which is sufficient to regulate CK1α (Wang et al, 2007). Consistent with this notion, depletion of endogenous MDMX increased CK1α activity and β‐catenin phosphorylation. Interestingly, the potency of MDMX in CK1α inhibition is auto‐regulated by the N and C terminal domains. P53 binding to MDMX disrupts an intramolecular interaction and stimulates MDMX‐CK1α binding, suggesting a potential mechanism by which p53 regulates CK1α activity. MDMX‐p53 and MDMX‐CK1α interactions are tightly regulated by cellular stress. DNA damage disrupts MDMX‐CK1α binding through phosphorylation of S367 by ATM/Chk2 signaling (Wu et al, 2012). Furthermore, DNA damage or oncogenic stress induces MDMX degradation by MDM2 (Chen et al, 2005a; Li et al, 2012). Both responses provide potential mechanisms for CK1α regulation by stress signals. Mutant p53 is highly stabilized in tumor cells and stimulates MDMX‐CK1α binding, suggesting that mutant p53 gain of function may be partly mediated by inhibiting CK1α.
Most protein kinases are under tight allosteric regulation that enables dynamic response to growth factor signaling or stress. There is little information on whether CK1α is allosterically regulated in the cell because it has minimal extra polypeptide sequences beyond the kinase domain. Previous work showed that substrate phosphorylation by CK1α can be primed by other kinases that phosphorylate sites N terminal to the target residue. The identification of MDMX as an inhibitor of CK1α suggests that this kinase is under negative regulation and connects CK1α activity to the dynamic p53 pathway. Interestingly, despite a large number of CK1α substrates, gene expression analysis showed MDMX mainly affects Wnt signaling and a few other pathways. It is possible that these pathways are most sensitive to the range of CK1α activity changes regulated by physiological levels of MDMX.
Recent work suggested that p53 inhibits Wnt signaling by inducing Mir‐34 micro RNA to suppress multiple genes in the Wnt pathway (Kim et al, 2011). P53 deletion or mutation in breast cancer is associated with increased Wnt signaling and systemic inflammation (Wellenstein et al, 2019). P53 also induces expression of DDX3 that may stimulate CK1α activity and degrade β‐catenin (Wu et al, 2014). The results described in this report suggest that MDMX‐CK1α interaction is a mechanism that synergizes with p53 to regulate Wnt signaling. We propose a model (Fig 8D) in which MDMX is an innate CK1α inhibitor that enhances Wnt response. Stress signals such as DNA damage and oncogene hyperactivation (ARF expression) inhibit MDMX‐CK1α binding and promote MDMX degradation, activate CK1α, and inhibit proliferation. P53 is also activated by stress signals and induces Mir‐34 to suppress Wnt pathway; thus, wild‐type p53 and MDMX may cooperate to inhibit Wnt response in normal tissues under stress conditions. When p53 is mutated in tumors, it loses the ability to induce Mir‐34 and inhibit the Wnt pathway. Furthermore, mutant p53 stimulates MDMX‐CK1α binding, providing a potential mechanism for gain of function.
CK1α regulates multiple pathways and have both tumor suppressor and oncogenic potential dependent on cellular context. Mutation of CK1α was only detected in a small number of tumors, suggesting that altering its activity has conflicting effects that are not always beneficial to tumor progression. However, recent work identified recurrent CK1α mutations in del(5q) MDS disease (~ 5%), some correlated with increased β‐catenin target gene expression (Schneider et al, 2014; Bello et al, 2015; Smith et al, 2015). Our recent study showed that MDS‐derived CK1α mutations stimulate MDMX inhibition of p53 and have reduced kinase activity for β‐catenin (Liu et al, 2019). The results here showed that these CK1α mutants are more sensitive to inhibition by MDMX and thus are conducive to MDMX stimulation of Wnt signaling.
Given the multi‐functional nature of CK1α, whether MDMX‐CK1α interaction can be targeted for therapeutic benefits will be context‐dependent. CK1α level is down‐regulated during melanoma progression and acts as a tumor suppressor when forcibly expressed (Sinnberg et al, 2010). Reduction of CK1α level in melanoma was associated with metastasis (Sinnberg et al, 2010). Coincidentally, MDMX overexpression was also frequently observed in melanoma and was proposed to be a drug target based on its effect on p53 activity (Gembarska et al, 2012). Our current finding suggests that MDMX overexpression may drive melanoma progression in part by inhibiting CK1α. Therefore, disrupting MDMX‐CK1α binding may inhibit proliferation and metastasis in melanoma. Whether MDMX‐CK1α interaction is amenable to pharmacological inhibition will require determination of the three‐dimensional structure of the complex.
Materials and Methods
Plasmids and cell lines
Cell lines H1299, 293T, A549, Panc1, MDA468, and HFF were maintained in Dulbecco modified Eagle medium (DMEM) with 10% fetal bovine serum. All cell lines used in this study were obtained from the ATCC and authenticated and tested negative for mycoplasma contamination. Transient transfection assays were performed using CMV‐driven plasmid expression vectors. Cells with stable expression of MDMX and MDMXSG mutant were generated by infection with pLenti‐MDMX virus followed by Zeocin selection (ViraPower T‐REX lentiviral expression system, Invitrogen). MDMX knockdown was performed using MXsiRNA1 (AGAUUCAGCUGGUUAUUAA) and MXsiRNA2 (AGAAGCAACUAUACACCUA), with CONsiRNA (UGGUUUACAUGUCGACUAA) as control. Cells were treated with siRNA prepared with Lipofectamine RNAiMaX. To knockout p53, p53gRNA1 (5′CACCGTCGACGCTAGGATCTGACTG annealed to 5′AAACCAGTCAGATCCTAGCGTCGAC) and p53gRNA3 (5′CACCGCCATTGTTCAATATCGTCCG annealed to 5′ AAACCGGACGATATTGAACAATGGC) were cloned into LentiCRISPRv2 vector (Addgene). Scrambled sequence (5′CACCGCACTCACATCGCTACATCA annealed to 5′AAACTGATGTAGCGATGTGAGTGC) was used as control. Cells were infected with lentivirus expressing gRNA, selected with puromycin, and colonies were pooled for analysis. Wnt3a ligand was produced by harvesting conditioned medium of the L Wnt‐3A cell line (ATCC, CRL‐2647). To stimulate Wnt signaling, 5–500 μl of conditioned medium was added to a culture containing 4 ml medium for 24 h.
Mice and MEF cell lines
Generation of MDMX SG knock in mutant mice was described previously (Huang et al, 2018). Animals were maintained and used in accordance with federal guidelines and those established by the Institutional Animal Care and Use Committee at the University of South Florida. To determine the effect of MDMX SG mutation in the absence of p53, MDMX SG mice were bred with p53 −/− mice in C53BL/6 background to obtain p53 −/−/MDMX SG/SG or p53 −/−/MDMX wt/wt offspring. Mouse embryonic fibroblasts (MEFs) were generated from 13.5‐day‐old p53 −/−/MDMX SG/SG or p53 −/−/MDMX wt/wt embryos. Three embryos from each strain were used to generate independent MEF cell lines maintained in DMEM with 10% fetal bovine serum.
Purification of FLAG‐CK1α
HEK293T cells in 10‐cm plates were transfected with 15 μg FLAG‐CK1α expression plasmid (C terminal FLAG tag) using PEI method for 48 h. Cells from 20 10‐cm plate were lysed in 10 ml lysis buffer (50 mM Tris–HCl pH 8.0, 5 mM EDTA, 150 mM NaCl, 0.5% NP‐40, 1× protease inhibitor cocktail) and centrifuged for 10 min at 14,000 g, and the insoluble debris was discarded. The lysate was incubated with 400 μl slurry of anti‐FLAG M2‐agarose beads (Sigma) for 18 h at 4°C. The beads were washed with lysis buffer, and FLAG‐CK1α was eluted with 200 μl lysis buffer containing 200 μg/ml FLAG epitope peptide (Sigma) for 2 h at 4°C. The concentration of eluted kinase was determined by Coomassie staining compared to BSA standard.
In vitro kinase inhibition assay
CK1α and mutants with C terminal FLAG tag were transiently expressed in HEK293T cells, immunoprecipitated with M2‐agarose beads (Sigma), and eluted with 200 μg/ml FLAG peptide diluted in kinase buffer (25 mM HEPES‐pH 7.5, 100 mM NaCl, 10 mM MgCl2, 1 mM DTT, 5% glycerol, 0.1% NP‐40). GST‐MDMX, GST‐MDMX mutants, GST‐β‐catenin‐1‐200, and GST‐MDM2 were expressed in E. coli, purified using glutathione agarose beads according to manufacturer instruction (Pierce), and eluted with reduced glutathione in kinase buffer. The in vitro kinase reactions containing purified FLAG‐CK1α, GST‐β‐catenin‐1‐200, GST‐MDMX or MDM2, 5 mM ATP, and kinase buffer were incubated for 20 min at 23°C. Phosphorylation of β‐catenin S45 was detected by Western blot using phospho‐specific antibody (Cell Signaling). To compare kinase activity, densitometry of Western blot films was performed to compare pS45 signal and normalized to CK1α signal. Sample titration was performed in all experiments to ensure quantitation can be done in the linear range. The figures shown are representative of three experiments.
Kinase activity ELISA assay
ELISA plates were coated with GST‐β‐catenin‐1‐200 in PBS (10 μg/ml, 50 μl/well) for 18 h at 4°C. The plates were washed four times with PBS containing 0.1% Tween 20 (PBST), blocked with 0.3 ml PBST containing 1% BSA for 15 min at 23°C, and washed two times with low salt kinase buffer (25 mM HEPES‐pH 7.5, 50 mM NaCl, 10 mM MgCl2, 1 mM DTT, 0.05% NP40, 5% glycerol). The phosphorylation reaction in each well contained 50 μl low salt kinase buffer, 1–50 μM ATP, and 1–30 μg total cell lysate. The plates were incubated at 23°C for 30 min with gentle shaking and washed four times with PBST. To detect phosphorylation of immobilized GST‐β‐catenin‐1‐200, 50 μl of anti‐pS45 antibody diluted 1:2,000 in PBST with 5% non‐fat dry milk was added to each well. The plates were incubated for 1 h at 23°C and washed 4 times with PBST. The plates were further incubated with 50 μl HRP‐anti‐rabbit IgG diluted in PBST containing 5% non‐fat dry milk for 1 h at 23°C, washed four times with PBST, and washed two times with PBS. TMB substrate (75 μl/well, SeraCare) was added and incubated at 23°C for 1–5 min. The chromogenic reaction was terminated by addition of 100 μl 0.12 N HCl, and absorbance at 450 nm was determined using a spectrophotometer.
Enzyme kinetics analysis
Peptide Cat45S (RRRGATTTAPSLSGKGNPEEEDVDTSQ) was used as CK1α substrate, and peptide Cat45A (RRRGATTTAPALSGKGNPEEEDVDTSQ) was used as control to validate specificity. Kinase reaction was carried out in 25 μl volume containing kinase buffer (25 mM HEPES‐pH 7.5, 10 mM MgCl2, 50 mM NaCl, 1 mM DTT, 0.05% NP‐40, 1 mg/ml BSA, 25 nM γ‐32P‐ATP [10 mCi/ml, 3,000 Ci/mmol], 1‐150 μM ATP, 1–2,000 μM peptide, 2 nM FLAG‐CK1α, and 10‐50 nM GST‐MDMX). The reactions were incubated for 20–30 min at 23°C. The reaction was stopped by adding 45 μl cold 10% TCA and centrifuged for 5 min at 14,000 g at 4°C to remove precipitated proteins. Phosphorylated peptide in the supernatant was absorbed on phosphocellulose P81 filter, washed three times with 0.5% phosphoric acid and once with acetone, air‐dried, and counted in a scintillation counter. Data were fitted to the equations using Graphpad Prism (vs. 8.3.0).
Western blot and protein interaction analysis
Cells were lysed in lysis buffer (50 mM Tris–HCl pH 8.0, 5 mM EDTA, 150 mM NaCl, 0.5% NP‐40, 1× protease inhibitor cocktail) and centrifuged for 10 min at 14,000 × g, and the insoluble debris was discarded. Cell lysate (10–50 μg of protein) was fractionated by SDS–PAGE and transferred to Immobilion P filters (Millipore). The filter was blocked for 1 h with phosphate‐buffered saline (PBS) containing 5% non‐fat dry milk and 0.1% Tween 20, incubated with primary and secondary antibodies, and the filter was developed using SuperSignal reagent (Thermo Scientific). MDMX immunoprecipitation was performed using cell lysate (200–1,000 μg protein), 8C6 antibody, and protein A‐agarose beads (Sigma) for 18 h at 4°C. Human MDMX was detected with monoclonal antibody 8C6, and mouse MDMX was detected using monoclonal antibody 7A8 produced in house. NML was detected using a rabbit polyclonal antibody produced in house. Other markers were detected using commercial antibodies: Phospho‐β‐catenin pSer45 (Cell Signaling #9564), Beta‐catenin (BD Transduction Laboratories #610153), CK1α (Cell Signaling #2655), FLAG (Sigma #F1804), Beta‐actin (Sigma #A2228), DO1 (BD Pharmingen #554293), and GST (Thermo Fisher Scientific # MA4‐004‐HRP).
RNA isolation and quantitative PCR
Total RNA was extracted using the RNeasy Mini kit (Qiagen). cDNAs were prepared by reverse transcription of total RNA using Applied Biosystems™ High‐Capacity cDNA Reverse Transcription Kit. The products were used for real‐time PCR using the following primers: GAPDH (5′‐TCACCACCATGGAGAAGGC and 5′‐ GCTAAGCAGTTGGTGGTGCA), PCDHAC2 (5′‐TGACTGACAACAGGCAACTCAC and 5′‐TGCTCTTAGCGAGGCAGAGTAG), PCDH10 (5′‐CCAACGGAAGCATTTTGTCC and 5′‐CCCTGTTCACTGTCTCCATGA), LEF1 (5′‐GCTCCTGAAATCCCCACCTTCT and 5′‐GGCTTCACGTGCATTAGGTCAC), WNT7A (5′‐GGGGACTATGACCCGGAAAG and 5′‐CCAGAGCTACCACCGAAGAGA), EN1 (5′‐ACAACCCTGCGATCCTACTCAT and 5′‐CGCTTGTCTTCCTTCTCGTTCT), AXIN2 (5′‐ACTGAAACTGGAGCTGGAAAGC and 5′‐TGTGGGTCCTCTTCATAGCTGC).
RNA sequencing (RNA‐seq)
Total RNA samples were prepared using RNeasy min kit (Qiagen). RNA from two groups of MEFs (3 p53 −/−/MDMX SG/SG lines and 3 p53 −/−/MDMX wt/wt lines) was collected. RNA‐seq analysis, including rRNA depletion, library preparation, multiplexing and cluster generation, sequencing on Illumina HiSeq 2500, and differential gene expression analysis, was performed by Genewiz (South Plainfield, NJ, USA). Genes that were differentially regulated in p53 −/−/MDMX SG/SG MEF lines by > 1.5‐fold compared to p53 −/−/MDMX wt/wt (average of three lines in each genotype, P < 0.05) were selected for functional analysis. Gene function analysis was performed using PANTHER software using default settings provided by the website (Protein Analysis THrough Evolutionary Relationships, http://pantherdb.org).
Preparation of cytoplasmic and nuclear extracts
Approximately 5 × 10⁷ cells were collected, washed gently with PBS buffer, and pelleted by centrifugation at 1,500 × g for 5 min. The cell pellet was resuspended in 400 μl cold buffer A (10 mM HEPES pH 7.9, 10 mM KCl, 0.1 mM EDTA, 0.1 mM EGTA, 1 mM DTT, 1× protease inhibitor cocktail) by gentle pipetting. The cells were allowed to swell on ice for 15 min. Then, 20 μl 10% solution of NP‐40 was added and the tube was vigorously vortexed for 10 s. The cell lysate was centrifuged at 12,000 × g for 1 min, and the supernatant containing cytoplasmic extract was transferred to a fresh tube. The nuclear pellet was washed once with 500 μl of buffer A, centrifuged at 12,000 × g for 1 min, and resuspended in 150 μl RIPA buffer (150 mM NaCl, 1% Triton X‐100, 0.1% SDS, 1% sodium deoxycholate, 50 mM Tris–HCl pH 7.4).
Cell proliferation analysis
MEF cells (1 × 10⁵ cells/well) were seeded onto 6‐well plates in triplicate and serially passaged following identical schedules. During each passage, 1/5 of the cell population was seeded into a new plate and cultured for 3 days. The cell numbers were determined after 3 and 5 passages. To determine colony formation efficiency, MEF cells (5 × 10³ cells/plate) were seeded onto 10‐cm plates and cultured for 14 days. Colonies were identified by crystal violate staining.
Statistical analysis
Overall survival analyses were generated with GraphPad Prism 7 software. The experimental results were presented as the mean ± standard deviation (SD), and Student's t‐test was used to evaluate differences between groups. P < 0.05 was considered statistically significant.
Author contributions
Experimental Work: QH, LC; Experimental Design and Data analysis: QH, LC, ES, JC; Writing of Manuscript: JC, ES; Study Conception: JC.
Conflict of interest
The authors declare that they have no conflict of interest.
Supporting information
Expanded View Figures PDF
Source Data for Expanded View
Review Process File
Source Data for Figure 1
Source Data for Figure 2
Source Data for Figure 3
Source Data for Figure 4
Source Data for Figure 5
Source Data for Figure 6
Source Data for Figure 7
Acknowledgements
We would like to thank the Moffitt Proteomics Core for sample analyses. This work was supported in part by grants from the National Institutes of Health (CA141244, CA186917) to J.C. Moffitt Cancer Center is supported by the NCI Cancer Center Support Grant P30‐CA076292.
The EMBO Journal (2020) 39: e104410
Data availability
The RNA‐seq data from this study have been deposited to the GEO database (https://www.ncbi.nlm.nih.gov/geo/) and assigned the identifier GSE148138.
References
- Bello E, Pellagatti A, Shaw J, Mecucci C, Kusec R, Killick S, Giagounidis A, Raynaud S, Calasanz MJ, Fenaux P et al (2015) CSNK1A1 mutations and gene expression analysis in myelodysplastic syndromes with del(5q). Br J Haematol 171: 210–214 [DOI] [PMC free article] [PubMed] [Google Scholar]
- Carrillo AM, Bouska A, Arrate MP, Eischen CM (2015) Mdmx promotes genomic instability independent of p53 and Mdm2. Oncogene 34: 846–856 [DOI] [PMC free article] [PubMed] [Google Scholar]
- Chen L, Gilkes DM, Pan Y, Lane WS, Chen J (2005a) ATM and Chk2‐dependent phosphorylation of MDMX contribute to p53 activation after DNA damage. EMBO J 24: 3411–3422 [DOI] [PMC free article] [PubMed] [Google Scholar]
- Chen L, Li C, Pan Y, Chen J (2005b) Regulation of p53‐MDMX interaction by casein kinase 1 alpha. Mol Cell Biol 25: 6509–6520 [DOI] [PMC free article] [PubMed] [Google Scholar]
- Chen L, Borcherds W, Wu S, Becker A, Schonbrunn E, Daughdrill GW, Chen J (2015) Autoinhibition of MDMX by intramolecular p53 mimicry. Proc Natl Acad Sci USA 112: 4624–4629 [DOI] [PMC free article] [PubMed] [Google Scholar]
- Clevers H, Nusse R (2012) Wnt/beta‐catenin signaling and disease. Cell 149: 1192–1205 [DOI] [PubMed] [Google Scholar]
- Cruciat CM, Dolde C, de Groot RE, Ohkawara B, Reinhard C, Korswagen HC, Niehrs C (2013) RNA helicase DDX3 is a regulatory subunit of casein kinase 1 in Wnt‐beta‐catenin signaling. Science 339: 1436–1441 [DOI] [PubMed] [Google Scholar]
- Dolde C, Bischof J, Gruter S, Montada A, Halekotte J, Peifer C, Kalbacher H, Baumann U, Knippschild U, Suter B (2018) A CK1 FRET biosensor reveals that DDX3X is an essential activator of CK1epsilon. J Cell Sci 131: jcs207316 [DOI] [PMC free article] [PubMed] [Google Scholar]
- Elyada E, Pribluda A, Goldstein RE, Morgenstern Y, Brachya G, Cojocaru G, Snir‐Alkalay I, Burstain I, Haffner‐Krausz R, Jung S et al (2011) CKIalpha ablation highlights a critical role for p53 in invasiveness control. Nature 470: 409–413 [DOI] [PubMed] [Google Scholar]
- Freed‐Pastor WA, Prives C (2012) Mutant p53: one name, many proteins. Genes Dev 26: 1268–1286 [DOI] [PMC free article] [PubMed] [Google Scholar]
- Gao C, Xiao G, Piersigilli A, Gou J, Ogunwobi O, Bargonetti J (2019) Context‐dependent roles of MDMX (MDM4) and MDM2 in breast cancer proliferation and circulating tumor cells. Breast Cancer Res 21: 5 [DOI] [PMC free article] [PubMed] [Google Scholar]
- Gembarska A, Luciani F, Fedele C, Russell EA, Dewaele M, Villar S, Zwolinska A, Haupt S, de Lange J, Yip D et al (2012) MDM4 is a key therapeutic target in cutaneous melanoma. Nat Med 18: 1239–1247 [DOI] [PMC free article] [PubMed] [Google Scholar]
- Hu B, Gilkes DM, Chen J (2007) Efficient p53 activation and apoptosis by simultaneous disruption of binding to MDM2 and MDMX. Cancer Res 67: 8810–8817 [DOI] [PubMed] [Google Scholar]
- Huang Q, Chen L, Yang L, Xie X, Gan L, Cleveland JL, Chen J (2018) MDMX acidic domain inhibits p53 DNA binding in vivo and regulates tumorigenesis. Proc Natl Acad Sci USA 115: E3368–E3377 [DOI] [PMC free article] [PubMed] [Google Scholar]
- Karni‐Schmidt O, Lokshin M, Prives C (2016) The roles of MDM2 and MDMX in cancer. Annu Rev Pathol 11: 617–644 [DOI] [PMC free article] [PubMed] [Google Scholar]
- Kim NH, Kim HS, Kim NG, Lee I, Choi HS, Li XY, Kang SE, Cha SY, Ryu JK, Na JM et al (2011) p53 and microRNA‐34 are suppressors of canonical Wnt signaling. Sci Signal 4: ra71 [DOI] [PMC free article] [PubMed] [Google Scholar]
- Knippschild U, Kruger M, Richter J, Xu P, Garcia‐Reyes B, Peifer C, Halekotte J, Bakulev V, Bischof J (2014) The CK1 family: contribution to cellular stress response and its role in carcinogenesis. Front Oncol 4: 96 [DOI] [PMC free article] [PubMed] [Google Scholar]
- Li B, Cheng Q, Li Z, Chen J (2010) p53 inactivation by MDM2 and MDMX negative feedback loops in testicular germ cell tumors. Cell Cycle 9: 1411–1420 [DOI] [PMC free article] [PubMed] [Google Scholar]
- Li X, Gilkes D, Li B, Cheng Q, Pernazza D, Lawrence H, Lawrence N, Chen J (2012) Abnormal MDMX degradation in tumor cells due to ARF deficiency. Oncogene 31: 3721–3732 [DOI] [PMC free article] [PubMed] [Google Scholar]
- Li D, Tavana O, Sun SC, Gu W (2018) Peli1 modulates the subcellular localization and activity of Mdmx. Cancer Res 78: 2897–2910 [DOI] [PMC free article] [PubMed] [Google Scholar]
- Liu X, Huang Q, Chen L, Zhang H, Schonbrunn E, Chen J (2019) Tumor‐derived CK1alpha mutations enhance MDMX inhibition of p53. Oncogene 39: 176–186 [DOI] [PMC free article] [PubMed] [Google Scholar]
- Matijasevic Z, Steinman HA, Hoover K, Jones SN (2008) MdmX promotes bipolar mitosis to suppress transformation and tumorigenesis in p53‐deficient cells and mice. Mol Cell Biol 28: 1265–1273 [DOI] [PMC free article] [PubMed] [Google Scholar]
- Miranda PJ, Buckley D, Raghu D, Pang JB, Takano EA, Vijayakumaran R, Teunisse AF, Posner A, Procter T, Herold MJ et al (2017) MDM4 is a rational target for treating breast cancers with mutant p53. J Pathol 241: 661–670 [DOI] [PubMed] [Google Scholar]
- Montes de Oca Luna R, Wagner DS, Lozano G (1995) Rescue of early embryonic lethality in mdm2‐deficient mice by deletion of p53. Nature 378: 203–206 [DOI] [PubMed] [Google Scholar]
- Parant J, Chavez‐Reyes A, Little NA, Yan W, Reinke V, Jochemsen AG, Lozano G (2001) Rescue of embryonic lethality in Mdm4‐null mice by loss of Trp53 suggests a nonoverlapping pathway with MDM2 to regulate p53. Nat Genet 29: 92–95 [DOI] [PubMed] [Google Scholar]
- Phillips A, Teunisse A, Lam S, Lodder K, Darley M, Emaduddin M, Wolf A, Richter J, de Lange J, Verlaan‐de Vries M et al (2010) HDMX‐L is expressed from a functional p53‐responsive promoter in the first intron of the HDMX gene and participates in an autoregulatory feedback loop to control p53 activity. J Biol Chem 285: 29111–29127 [DOI] [PMC free article] [PubMed] [Google Scholar]
- Rena G, Bain J, Elliott M, Cohen P (2004) D4476, a cell‐permeant inhibitor of CK1, suppresses the site‐specific phosphorylation and nuclear exclusion of FOXO1a. EMBO Rep 5: 60–65 [DOI] [PMC free article] [PubMed] [Google Scholar]
- Schneider RK, Adema V, Heckl D, Jaras M, Mallo M, Lord AM, Chu LP, McConkey ME, Kramann R, Mullally A et al (2014) Role of casein kinase 1A1 in the biology and targeted therapy of del(5q) MDS. Cancer Cell 26: 509–520 [DOI] [PMC free article] [PubMed] [Google Scholar]
- Sinnberg T, Menzel M, Kaesler S, Biedermann T, Sauer B, Nahnsen S, Schwarz M, Garbe C, Schittek B (2010) Suppression of casein kinase 1alpha in melanoma cells induces a switch in beta‐catenin signaling to promote metastasis. Cancer Res 70: 6999–7009 [DOI] [PubMed] [Google Scholar]
- Smith AE, Kulasekararaj AG, Jiang J, Mian S, Mohamedali A, Gaken J, Ireland R, Czepulkowski B, Best S, Mufti GJ (2015) CSNK1A1 mutations and isolated del(5q) abnormality in myelodysplastic syndrome: a retrospective mutational analysis. Lancet Haematol 2: e212–e221 [DOI] [PubMed] [Google Scholar]
- Vousden KH, Lane DP (2007) p53 in health and disease. Nat Rev Mol Cell Biol 8: 275–283 [DOI] [PubMed] [Google Scholar]
- Vousden KH, Prives C (2009) Blinded by the light: the growing complexity of p53. Cell 137: 413–431 [DOI] [PubMed] [Google Scholar]
- Wang YV, Wade M, Wong E, Li YC, Rodewald LW, Wahl GM (2007) Quantitative analyses reveal the importance of regulated Hdmx degradation for p53 activation. Proc Natl Acad Sci USA 104: 12365–12370 [DOI] [PMC free article] [PubMed] [Google Scholar]
- Wei X, Wu S, Song T, Chen L, Gao M, Borcherds W, Daughdrill GW, Chen J (2016) Secondary interaction between MDMX and p53 core domain inhibits p53 DNA binding. Proc Natl Acad Sci USA 113: E2558–E2563 [DOI] [PMC free article] [PubMed] [Google Scholar]
- Wellenstein MD, Coffelt SB, Duits DEM, van Miltenburg MH, Slagter M, de Rink I, Henneman L, Kas SM, Prekovic S, Hau CS et al (2019) Loss of p53 triggers WNT‐dependent systemic inflammation to drive breast cancer metastasis. Nature 572: 538–542 [DOI] [PMC free article] [PubMed] [Google Scholar]
- Winston JT, Strack P, Beer‐Romero P, Chu CY, Elledge SJ, Harper JW (1999) The SCFbeta‐TRCP‐ubiquitin ligase complex associates specifically with phosphorylated destruction motifs in IkappaBalpha and beta‐catenin and stimulates IkappaBalpha ubiquitination in vitro . Genes Dev 13: 270–283 [DOI] [PMC free article] [PubMed] [Google Scholar]
- Wu X, Bayle JH, Olson D, Levine AJ (1993) The p53‐mdm‐2 autoregulatory feedback loop. Genes Dev 7: 1126–1132 [DOI] [PubMed] [Google Scholar]
- Wu S, Chen L, Becker A, Schonbrunn E, Chen J (2012) Casein kinase 1alpha regulates an MDMX intramolecular interaction to stimulate p53 binding. Mol Cell Biol 32: 4821–4832 [DOI] [PMC free article] [PubMed] [Google Scholar]
- Wu DW, Lee MC, Wang J, Chen CY, Cheng YW, Lee H (2014) DDX3 loss by p53 inactivation promotes tumor malignancy via the MDM2/Slug/E‐cadherin pathway and poor patient outcome in non‐small‐cell lung cancer. Oncogene 33: 1515–1526 [DOI] [PubMed] [Google Scholar]
- Xiong S, Pant V, Zhang Y, Aryal NK, You MJ, Kusewitt D, Lozano G (2017) The p53 inhibitor Mdm4 cooperates with multiple genetic lesions in tumourigenesis. J Pathol 241: 501–510 [DOI] [PMC free article] [PubMed] [Google Scholar]
- Zhang F, Virshup DM, Cheong JK (2018) Oncogenic RAS‐induced CK1alpha drives nuclear FOXO proteolysis. Oncogene 37: 363–376 [DOI] [PMC free article] [PubMed] [Google Scholar]
Associated Data
This section collects any data citations, data availability statements, or supplementary materials included in this article.
Supplementary Materials
Expanded View Figures PDF
Source Data for Expanded View
Review Process File
Source Data for Figure 1
Source Data for Figure 2
Source Data for Figure 3
Source Data for Figure 4
Source Data for Figure 5
Source Data for Figure 6
Source Data for Figure 7
Data Availability Statement
The RNA‐seq data from this study have been deposited to the GEO database (https://www.ncbi.nlm.nih.gov/geo/) and assigned the identifier GSE148138.