

Abstract
Although the unprecedented efforts the world has been taking to control the spread of the human coronavirus disease (COVID‐19) and its causative aetiology [severe acute respiratory syndrome coronavirus 2 (SARS‐CoV‐2)], the number of confirmed cases has been increasing drastically. Therefore, there is an urgent need for devising more efficient preventive measures, to limit the spread of the infection until an effective treatment or vaccine is available. The preventive measures depend mainly on the understanding of the transmission routes of this virus, its environmental stability, and its persistence on common touch surfaces. Due to the very limited knowledge about SARS‐CoV‐2, we can speculate its stability in the light of previous studies conducted on other human and animal coronaviruses. In this review, we present the available data on the stability of coronaviruses (CoVs), including SARS‐CoV‐2, from previous reports to help understand its environmental survival. According to available data, possible airborne transmission of SARS‐CoV‐2 has been suggested. SARS‐CoV‐2 and other human and animal CoVs have remarkably short persistence on copper, latex and surfaces with low porosity as compared to other surfaces like stainless steel, plastics, glass and highly porous fabrics. It has also been reported that SARS‐CoV‐2 is associated with diarrhoea and that it is shed in the faeces of COVID‐19 patients. Some CoVs show persistence in human excrement, sewage and waters for a few days. These findings suggest a possible risk of faecal–oral, foodborne and waterborne transmission of SARS‐CoV‐2 in developing countries that often use sewage‐polluted waters in irrigation and have poor water treatment systems. CoVs survive longer in the environment at lower temperatures and lower relative humidity. It has been suggested that large numbers of COVID‐19 cases are associated with cold and dry climates in temperate regions of the world and that seasonality of the virus spread is suspected.
Keywords: animal coronaviruses, common touch surfaces, COVID‐19, environmental conditions, fomites, human coronaviruses, inanimate surfaces, persistence, SARS‐CoV‐2, stability, survivability, virus survival
1. INTRODUCTION
Coronaviruses (CoVs) belong to the family Coronaviridae and order Nidovirales, which encompasses positive‐sense, single‐stranded RNA viruses that replicate using a nested (‘nido’) set of mRNAs (Peiris, 2016). According to the International Committee on Taxonomy of Viruses (ICTV), the family Coronaviridae is classified into two subfamilies, Letovirinae and Orthocoronavirinae (King et al., 2018). The latter includes human and animal coronaviruses (Figure 1) and is classified into four genera: alpha‐, beta‐, gamma‐ and deltacoronaviruses (Figure 1). Most of human coronaviruses (HCoVs) are betacoronaviruses including HCoV‐OC43, HCoV‐HKU1, severe acute respiratory syndrome coronavirus 1 (SARS‐CoV‐1), SARS‐CoV‐2 and Middle East respiratory syndrome coronavirus (MERS‐CoV) (CDC, 2020; Dilcher, Werno, & Jennings, 2020). A few human coronaviruses, such as HCoV‐229E and HCoV‐NL63, are alphacoronaviruses. All bat coronaviruses are either alpha‐ or betacoronaviruses. Three swine coronaviruses that are of significant concern to the porcine industry are transmissible gastroenteritis virus (TGEV), porcine epidemic diarrhoea virus (PEDV) and porcine respiratory coronavirus (PRCV), which are alphacoronaviruses. Feline infectious peritonitis virus (FIPV) and canine coronaviruses (CCoV) are alphacoronaviruses while bovine coronavirus (BCoV) and mouse coronavirus [MCoV; murine hepatitis virus (MHV)] are betacoronaviruses (Ashour, Elkhatib, Rahman, & Elshabrawy, 2020).
FIGURE 1.
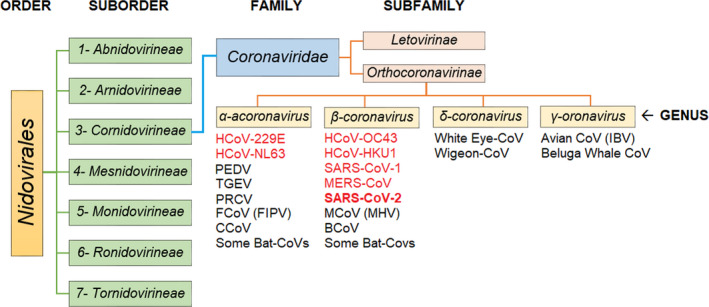
The most recent classification of coronaviruses within the family Coronaviridae, subfamily Orthocoronavirinae, and the respective genera: alpha ‐, beta ‐, gamma ‐ and deltacoronaviruses. The SARS‐CoV‐2 is classified as a betacoronavirus. CoVs that are presented in red colour are human‐infectious
Before 2002, human CoVs were thought of as nuisance viruses causing common cold and were never perceived as serious public health threats (Ashour et al., 2020). This perception changed in 2002–2003 after the emergence of the SARS‐CoV‐1, which was the first lethal form of CoVs to infect humans (Drosten et al., 2003). The epidemic of SARS‐CoV‐1 caused 8,422 illnesses and 916 deaths in 29 countries (CDC, 2017; WHO, 2020a). After its containment in 2004, the number of cases of SARS‐CoV‐1 is approaching zero (CDC, 2017). In 2012, another novel zoonotic coronavirus (named Middle East respiratory syndrome coronavirus [MERS‐CoV]) caused an epidemic claiming the lives of 866 people in 27 countries (WHO, 2020b).
In December 2019, a new human coronavirus emerged in Wuhan City, Hubei province, China, causing severe acute respiratory disease, and this disease is referred to as the coronavirus disease‐2019 (COVID‐19). Due to the drastic increase in the number of reported COVID‐19 cases worldwide, it was declared as a pandemic by the WHO on 11 March 2020. On the basis of preliminary genetic studies, this new virus was tentatively named as 2019‐new coronavirus (2019‐nCoV). Later, it was renamed as ‘severe acute respiratory syndrome coronavirus 2’ (SARS‐CoV‐2) after the Coronaviridae study group of the ICTV determined that the virus belongs to the existing virus species, severe acute respiratory syndrome‐related coronavirus (Gorbalenya, Baker, & Baric, 2020; WHO, 2020c). As of 21 May 2020 (10:35 a.m.), about 4,858,850 confirmed COVID‐19 cases including 329,300 deaths have been reported in 188 countries. In the United States alone, 1,556,749 cases have been reported resulting in more than 93,606 deaths (JHU, 2020).
The overall fatality rate of SARS‐CoV‐2 is relatively low (~6.8%) as compared to that of SARS‐CoV‐1 and MERS‐CoV (10.9% and 34.4%, respectively) but it is still in flux and very well could be lower than 6.8%. However, it is obvious that SARS‐CoV‐2 is much more contagious as evidenced by its spread to 185 countries across the globe within a very short time. This has led to an increased concern of possible collapse of the medical care systems, as they will not be able to accommodate a large number of cases simultaneously. (DeCaprio, Gartner, Burgess, Kothari, & Sayed, 2020; Specht, 2020). For that reason, the governments and public health sectors are racing against time to contain this pandemic before the occurrence of this catastrophic scenario. Because an effective and safe vaccine or antiviral drug for SARS‐COV‐2 does not exist, infection control is the only available method to limit the spread of the virus (Lai, Shih, Ko, Tang, & Hsueh, 2020). The infection control and preventive measures depend mainly on our primary understanding of the routes of transmission of this virus. A reported familial cluster of pneumonia associated with COVID‐19 in hospital and family settings has confirmed the direct person‐to‐person transmission route for this virus (Chan et al., 2020). Other indirect transmission routes are postulated and/or indicated such as faecal–oral, nosocomial, airborne and contact with contaminated surfaces and fomites (Cai et al., 2020; Han, Lin, Ni, & You, 2020). The impact of the environmental conditions such as temperature, relative and absolute humidity, and sunlight on the virus stability and spread is largely unknown. This review has collected all available data on the stability of SARS‐CoV‐2 and other coronaviruses from previously published reports. We believe that the data provided herein should help establish a solid long‐term protocol to interrupt indirect environmental transmission of SARS‐CoV‐2, limit its spread, and mitigate its risks.
2. PERSISTENCE OF CORONAVIRUSES IN AEROSOLS
The association of SARS‐CoV‐2, SARS‐CoV‐1 and MERS‐CoV with acute respiratory diseases and their high loads detected in throat, sputum and lower respiratory tract of infected persons indicate that viral particles of SARS‐CoV‐2 are shed in aerosols during coughing and sneezing (Calvet et al., 2016; Guery et al., 2013; NHCPRC, 2020; Pan et al., 2020). The RNA of SARS‐CoV‐1 has been detected in air samples collected from hospitals in china (Xiao et al., 2004). The detection of RNA of an animal CoV (such as PEDV) in air at 16.1 Km distance from an infected farm in the United States indicates possible airborne transmission (Alonso et al., 2014). Although the detection of SARS‐CoV‐2 or its RNA in aerosols has not yet been reported, confirmed aerosol transmission of other coronaviruses suggests possible aerosol transmission of SARS‐CoV‐2 (Ge, Yang, Xia, Fu, & Zhang, 2020). Therefore, understanding the persistence of SARS‐CoV‐2 is important to develop effective infection control measures of the virus in aerosols.
The persistence of various CoVs in aerosols at different environmental conditions has been studied. The results of these studies are summarized in Table 1. Only two studies on aerosolized SARS‐CoV‐2 are available. The first study compared the decay rates of SARS‐CoV‐2 and SARS‐CoV‐1 within 3h aerosolization time at room temperature (21°C–23°C) and a fixed relative humidity (RH) of 65%; both viruses were detectable after 3 hr of aerosolization. The median half‐lives were 1.09 and 1.18 hr for SARS‐CoV‐2 and SARS‐CoV‐1, respectively (van Doremalen et al., 2020). In another study, aerosolized SARS‐CoV‐2 retained its infectivity for a period of 16h at room temperature and the authors concluded that the virus can be considered as an airborne pathogen (Fears et al., 2020). Human coronavirus HCoV‐229E, a causative agent for common cold, showed more stability in aerosols (half‐life = 67.3 hr) at similar conditions (20°C and 50% RH) and was infectious after 72 hr of aerosolization (Ijaz, Brunner, Sattar, Nair, & Johnson‐Lussenburg, 1985). Another study reported that infectious MERS‐CoV was detectable after 1h of aerosolization despite a reduction in virus titre over the aerosolization time (Pyankov, Bodnev, Pyankova, & Agranovski, 2018).
TABLE 1.
Persistence of coronaviruses in aerosols at different temperatures and relative humidity
| Virus | Temp (◦C) | RH | Virus load | Duration of aerosolization |
Persistence/ (per cent survival) |
Complete decay | Half‐life | Reference |
|---|---|---|---|---|---|---|---|---|
| HCoV‐229E | 6 | 30% | 7.5 Log10/ml Suspension | 24 hr | to the end/ (70%) | NR | 34.5 hr | Ijaz et al. (1985) |
| 6 | 50% | 7.5 Log10/ml Suspension | 24 hr | to the end/ (90%) | NR | 102.5 hr | ||
| 6 | 80% | 7.5 Log10/ml Suspension | 24 hr | to the end/ (90%) | NR | 86.0 hr | ||
| 20 | 30% | 7.5 Log10/ml Suspension | 72 hr | to the end/ (50%) | NR | 26.76 hr | ||
| 20 | 50% | 7.5 Log10/ml Suspension | 72 hr | to the end/ (60%) | NR | 67.3 hr | ||
| 20 | 80% | 7.5 Log10/ml Suspension | 72 hr | 24h/ (10%) | At 48 hr | 3.34 hr | ||
| MERS‐CoV | 20 | 40% | 6 Log10/ml Suspension | 10 min | to the end (93%) | NR | NR | Van Doremalen et al. (2013) |
| 20 | 70% | 6 Log10/ml Suspension | 10 min | to the end (11%) | NR | NR | ||
| MERS‐CoV | 25 | 79% | 5.5 Log10/ml eluate | 60 min | to the end (63%) | NR | NR | Pyankov et al. (2018) |
| 38 | 24% | 5.5 Log10/ml eluate | 60 min | to the end (4.7%) | NR | NR | ||
| SARS‐CoV‐2 | 21–23 | 65% | 3.5 Log10/ L air | 3 hr | to the end (15.8%) | NR | 1.09 hr | van Doremalen et al. (2020) |
| SARS‐CoV‐1 | 21–23 | 65% | 4.3 Log10/ L air | 3 hr | to the end (15.8%) | NR | 1.18 hr | |
| SARS‐CoV−2 | RT | NR | 2.0 Log10/ L aerosol | 16 hr | to the end (55%–100%) | NR | NR | Fears et al. (2020) |
Abbreviations: NR, not reported; RH, relative humidity; RT, room temperature.
3. PERSISTENCE OF CORONAVIRUSES ON ENVIRONMENTAL SURFACES AND FOMITES
In general, the persistence of a given virus in the environment outside its host is essential to allow its spread. However, the characteristic of the virus, the characteristics of the biotic or abiotic environmental surface it contaminates, and the environmental conditions are important factors that determine the infectivity retention and extent and speed of the spread of the virus (Wolf, Sattar, Adegbunrin, & Tetro, 2005). Therefore, when an emerging respiratory virus such as SARS‐CoV‐2 is widespread, its long‐time persistence on environmental surfaces and fomites is postulated (WHO, 2020e). Thus, the RNA of SARS‐CoV‐2 was detected on the surface of door handles, cell phones and other items in the residential sites of confirmed cases (China news, 2020). To date, a limited amount of data is available on the environmental survival of SARS‐CoV‐2. However, a primary understanding of its persistence in the environment can be construed by results of studies conducted on other coronaviruses such as SARS‐CoV‐1 and MERS‐CoV as discussed below and summarized in Table 2.
TABLE 2.
Persistence of coronaviruses on surfaces and fomites
| Surface or fomite | Virus | Temp (°C) | RH | Persistence | Time of complete decay | # of log reduction | Reference |
|---|---|---|---|---|---|---|---|
| Non‐porous surfaces | |||||||
| Plastic (polystyrene) | HCoV‐229E | 21–25 | NR | 2 d | 3 d | ~5 | Rabenau et al., 2005 |
| Plastic (polystyrene) | SARS‐CoV‐1 | 21–25 | NR | 6 d | 9 d | ~5 | Rabenau et al., 2005 |
| Plastic (PVC) | HCoV‐229E | 21 | 30%–40% | 5 d | NR | 2 | Warnes et al. (2015) |
| Plastic (Teflon) | HCoV‐229E | 21 | 30%–40% | 5 d | NR | 2.5 | Warnes et al. (2015) |
| Plastic | SARS‐CoV‐1 | 21–25 | NR | 4 d | 5 d | 6 | Duan et al. (2003) |
| Plastic | SARS‐CoV‐1 | NG | NR | 3 d | 4 d | 3.2 | van Doremalen et al. (2020) |
| Plastic | SARS‐CoV‐1 | 22–25 | 40%–50% | 28 d | NR | ~5 | Chan et al. (2011) |
| Plastic | SARS‐CoV‐1 | 33 | >95% | 1 d | NR | 1 | Chan et al. (2011) |
| Plastic | SARS‐CoV‐1 | 33 | 80%–89% | 1 d | NR | 0.75 | Chan et al. (2011) |
| Plastic | SARS‐CoV‐1 | 38 | >95% | 1 d | NR | 3.5 | Chan et al. (2011) |
| Plastic | SARS‐CoV‐1 | 38 | 80%–89% | 1 d | NR | 2 | Chan et al. (2011) |
| Plastic | MERS‐CoV | 20 | 40% | 2 d | 3 d | ~ 5.5 | van Doremalen et al. (2013) |
| Plastic | MERS‐CoV | 30 | 80% | 8 hr | 1 d | ~ 5.5 | van Doremalen et al. (2013) |
| Plastic | MERS‐CoV | 30 | 30% | 1 d | 2 d | ~ 5.5 | van Doremalen et al. (2013) |
| Plastic | SARS‐CoV‐2 | NG | NG | 3 d | 4 d | 3.2 | van Doremalen et al. (2020) |
| Plastic | SARS‐CoV‐2 | 22 | 65% | 4 d | 7 d | 5.8 | Chin et al. (2020) |
| Aluminium | HCoV‐229E | 21 | 55%–70% | 6 hr | 12 hr | 3 | Sizun et al. (2000) |
| Aluminium | HCoV‐OC43 | 21 | 55%–70% | 2 hr | 3 hr | 3 | Sizun et al. (2000) |
| Metal | SARS‐CoV‐1 | 21–25 | NR | 5 d | NR | NG | Duan et al. (2003) |
| Brass (95%–100% Cu) | HCoV‐229E | 21 | NR | 10 min | 20min | 3 | Warnes et al. (2015) |
| Brass (85% Cu) | HCoV‐229E | 21 | NR | 50 min | 1 hr | 3 | Warnes et al. (2015) |
| Brass (60% Cu) | HCoV‐229E | 21 | NR | 2 hr | NR | 2.5 | Warnes et al. (2015) |
| Copper nickel (90% Cu) | HCoV‐229E | 21 | NR | 20 min | 30min | 3 | Warnes et al. (2015) |
| Copper nickel (79% Cu) | HCoV‐229E | 21 | NR | 30 min | 40 min | 3 | Warnes et al. (2015) |
| Copper nickel (70% Cu) | HCoV‐229E | 21 | NR | 1 hr | 2 hr | 3 | Warnes et al. (2015) |
| Copper | SARS‐CoV‐1 | NG | NR | 8 hr | 1 d | 1.7 | van Doremalen et al. (2020) |
| Copper | SARS‐CoV‐2 | NG | NR | 4 hr | 8 hr | 1.7 | van Doremalen et al. (2020) |
| Stainless steel | SARS‐CoV‐2 | NG | NR | 3 d | 4 d | 3.2 | van Doremalen et al. (2020) |
| Stainless steel | SARS‐CoV‐2 | 22 | 65% | 4 d | 7 d | 5.8 | Chin et al. (2020) |
| Stainless steel | SARS‐CoV‐1 | NG | NR | 2 d | 3 d | 3.2 | van Doremalen et al. (2020) |
| Stainless steel | MERS‐CoV | 20 | 40% | 2 d | 3 d | ~ 5.5 | van Doremalen et al. (2013) |
| Stainless steel | MERS‐CoV | 30 | 80% | 8 hr | 1 d | ~ 5.5 | van Doremalen et al. (2013) |
| Stainless steel | MERS‐CoV | 30 | 30% | 1 d | 2 d | ~ 5.5 | van Doremalen et al. (2013) |
| Stainless steel | HCoV‐229E | 21 | 30%–40% | 5 d | NR | 2 | Warnes et al. (2015) |
| Stainless steel | TGEV | 4 | 20% | 28 d | NR | 0.25 | Casanova et al. (2010) |
| Stainless steel | TGEV | 4 | 50% | 28 d | NR | 1.5 | Casanova et al. (2010) |
| Stainless steel | TGEV | 4 | 80% | 28 d | NR | 3 | Casanova et al. (2010) |
| Stainless steel | TGEV | 20 | 20% | 28 d | NR | 2 | Casanova et al. (2010) |
| Stainless steel | TGEV | 20 | 80% | 14 d | 16 d | 5 | Casanova et al. (2010) |
| Stainless steel | MCoV(MHV) | 4 | 20% | 28 d | NR | 0.25 | Casanova et al. (2010) |
| Stainless steel | MCoV(MHV) | 4 | 50% | 28 d | NR | 3.2 | Casanova et al. (2010) |
| Stainless steel | MCoV(MHV) | 4 | 80% | 28 d | NR | 2.5 | Casanova et al. (2010) |
| Stainless steel | MCoV(MHV) | 20 | 20% | 28 d | NR | 2 | Casanova et al. (2010) |
| Stainless steel | MCoV(MHV) | 20 | 80% | 10 d | 11 d | 5 | Casanova et al. (2010) |
| Zinc | HCoV‐229E | 21 | NG | 2 hr | NR | 0.5 | Warnes et al. (2015) |
| Glass | HCoV‐229E | 21 | 30%–40% | 5 d | NA | 2.5 | Warnes et al. (2015) |
| Glass | SARS‐CoV‐1 | 21–25 | NR | 4 d | 5 d | 6 | Duan et al. (2003) |
| Glass | SARS‐CoV‐2 | 22 | 65% | 2 d | 4 d | 5.8 | Chin et al. (2020) |
| Mosaic | SARS‐CoV‐1 | 21–25 | NR | 3 d | 4 d | 6 | Duan et al. (2003) |
| Ceramic | HCoV‐229E | 21 | 30%–40% | 5 d | NR | 2 | Warnes et al. (2015) |
| Silicon rubber | HCoV‐229E | 21 | 30%–40% | 3 d | 5 d | 3 | Warnes et al. (2015) |
| Latex surgical gloves | HCoV‐229E | 21 | 55%–70% | 3 hr | 6 hr | 3 | Sizun et al. (2000) |
| Latex surgical gloves | HCoV‐OC43 | 21 | 55%–70% | <1 hr | 1 hr | 3 | Sizun et al. (2000) |
| Porous surfaces | |||||||
| Cloth | SARS‐CoV‐1 | 21–25 | NR | 5 d | NR | NG | Duan et al. (2003) |
| Cloth | SARS‐CoV‐2 | 22 | 65% | 1 d | 2 d | 4.8 | Chin et al. (2020) |
| Disposable gown (L) | SARS‐CoV‐1 | 20 | NR | <1 hr | 1 hr | ~1.7 | Lai et al. (2005) |
| Disposable gown (M) | SARS‐CoV‐1 | 20 | NR | <1 d | 1 d | ~2.7 | Lai et al. (2005) |
| Disposable gown (H) | SARS‐CoV‐1 | 20 | NR | <2 d | 2 d | ~3.7 | Lai et al. (2005) |
| Cotton gown (L) | SARS‐CoV‐1 | 20 | NR | <5 min | 5 min | ~1.7 | Lai et al. (2005) |
| Cotton gown (M) | SARS‐CoV‐1 | 20 | NR | <1 hr | 1 hr | ~2.7 | Lai et al. (2005) |
| Cotton gown (H) | SARS‐CoV‐1 | 20 | NR | <1 d | 1 d | ~3.7 | Lai et al. (2005) |
| Surgical Mask‐outer layer | SARS‐CoV‐2 | 22 | 65% | 7 d | NR | 5.8 | Chin et al. (2020) |
| Surgical Mask‐inner layer | SARS‐CoV‐2 | 22 | 65% | 4 d | 7 d | 5.8 | Chin et al. (2020) |
| Press Paper | SARS‐CoV‐1 | 21–25 | NR | 4 d | 5 d | 6 | Duan et al. (2003) |
| Filter Paper | SARS‐CoV‐1 | 21–25 | NR | 5 d | NR | NA | Duan et al. (2003) |
| Paper (L) | SARS‐CoV‐1 | 20 | NR | NG | <5 min | ~1.7 | Lai et al. (2005) |
| Paper (M) | SARS‐CoV‐1 | 20 | NR | <3 hr | 3 hr | ~2.7 | Lai et al. (2005) |
| Paper (H) | SARS‐CoV‐1 | 20 | NR | <1 d | 1 d | ~3.7 | Lai et al. (2005) |
| Paper | SARS‐CoV‐2 | 22 | 65% | 30 min | 3 hr | 4.8 | Chin et al. (2020) |
| Tissue paper | SARS‐CoV‐2 | 22 | 65% | 30 min | 3 hr | 5.5 | Chin et al. (2020) |
| Banknote paper | SARS‐CoV‐2 | 22 | 65% | 2 d | 4 d | 6 | Chin et al. (2020) |
| Cardboard | SARS‐CoV‐1 | NG | NR | 8 hr | 1 d | 2 | van Doremalen et al. (2020) |
| Cardboard | SARS‐CoV‐2 | NG | NR | 1 d | 2 d | 2 | van Doremalen et al. (2020) |
| Cotton gauze sponges | HCoV‐229E | 21 | 55%–70% | 6 hr | 12 hr | 3 | Sizun et al. (2000) |
| Cotton gauze sponges | HCoV‐OC43 | 21 | 55%–70% | <1h | 1 hr | 3 | Sizun et al. (2000) |
| Wood Boards | SARS‐CoV‐1 | 21–25 | NR | 4 d | 5 d | 6 | Duan et al. (2003) |
| Wood | SARS‐CoV‐2 | 22 | 65% | 1 d | 2 d | 5.6 | Chin et al. (2020) |
NR: Not Reported.
(L): Low virus load (5 × 10^1 TCID50).
(M): Medium virus load (5 × 10^2 TCID50).
(H): High virus load (5 × 10^3 TCID50).
3.1. Persistence on non‐porous surfaces
3.1.1. Plastic surfaces
Persistence of SARS‐CoV‐2 on plastic surface has been reported in two recent studies. In the first study, SARS‐CoV‐2 retained its infectivity for 4 days but was completely decayed after 7 days on plastic surface at room temperature and 65% RH (Chin et al., 2020). The second study demonstrated that SARS‐CoV‐2 retained its infectivity for 3 days on plastic surface at room temperature. The same study found no difference between the persistence of SARS‐CoV‐2 and SARS‐CoV‐1 on plastic surface and both viruses completely lost their infectivity after 4 days (van Doremalen et al., 2020). Duan et al. (2003) reported longer persistence (4 days with complete decay after 5 days) of SARS‐CoV‐1 on plastic surface. On polystyrene petri dish, SARS‐CoV‐1 survived for at least 6 days at room temperature and completely decayed after 9 days (Rabenau et al., 2005). In another study, SARS‐CoV‐1 retained its infectivity on plastic surface for 28 days at room temperature and 40%–50% RH (Chan et al., 2011). Although this study reported longer virus survival, it has been shown that the survivability of SARS‐CoV‐1 on plastic surface is drastically affected by increases in temperature and RH as described below.
As compared to SARS‐CoV‐1 and SARS‐CoV‐2, a little shorter survivability on plastic has been shown for MERS‐CoV and HCoV‐229E at room temperature. Both retained their infectivity for up to 2 days only and were completely inactivated after 3 days (Rabenau et al., 2005; Van Doremalen, Bushmaker, & Munster, 2013). In another study, however, HCoV‐229E showed longer persistence (5 days) on polyvinyl chloride (PVC) and polytetrafluoroethylene (Teflon) at 21°C and 30%–40% RH (Warnes, Little, & Keevil, 2015).
3.1.2. Metals
One study reported that SARS‐CoV‐2 (initial load = 3.6 log TCID50) persisted for 3 days on stainless steel surface and that it became undetectable after 4 days (van Doremalen et al., 2020). In another study, a this virus with a higher initial load (5.5 log TCID50) retained its infectivity for 4 days and was completely inactivated after 7 days on stainless steel at room temperature and RH of 65% (Chin et al., 2020). The available data demonstrated that the survivability of coronaviruses on metal surfaces differs according to the type of metal. In general, coronaviruses survive for shorter periods on copper, copper nickel and brass than on stainless steel and zinc surfaces. For instance, SARS‐CoV‐1 persisted on copper for 8 hr while it remained infectious for 2 days on stainless steel with complete decay after 3 days (van Doremalen et al., 2020). Similarly, HCoV‐229E showed lower persistence on brass (ranging from 10 min to 2 hr) and copper nickel (from 20 min to 1 hr) than on stainless steel (5 days) at room temperature and 30%–40% RH. The reduction in virus persistence was found proportional to an increase in the copper content in brass and nickel (Table 2) (Warnes et al., 2015). Virucidal activity of copper and copper alloy was reported against various viruses and this might explain the short survival of CoVs on copper surface compared to other metal surfaces (Michels, Wilks, Noyce, & Keevil, 2005; Warns & Keevil, 2013).
In addition, different survivability of various coronaviruses was observed on the same surface. For instance, SARS‐CoV‐2 showed lower survival on copper (4 hr) than SARS‐CoV‐1 (8 hr) (van Doremalen et al., 2020). Similarly, human coronavirus HCoV‐OC43 showed shorter persistence (2 hr) on aluminium than HCoV‐229E, which retained its infectivity for 6 hr under the same conditions of temperature and RH (Sizun, Yu, & Talbot, 2000). Some coronaviruses showed similar stability on the same surface such as MERS‐CoV and SARS‐CoV‐1; both stayed infectious for up to 2 days on stainless steel surface at room temperature (van Doremalen et al., 2013 and 2020). The porcine CoV (TGEV) and murine coronavirus (MCoV or MHV) were detectable on stainless steel for 28 d with only <1 log reduction in their titres on day 1 (Casanova, Jeon, Rutala, Weber, & Sobsey, 2010). The results presented here suggest that using copper‐made common touch surfaces in hospitals might be helpful in reducing the persistence of SARS‐CoV‐2. Furthermore, the same virus might show different survivability on a single surface according to changes in environmental conditions such as temperature and RH as discussed below.
3.1.3. Glass, ceramic and rubber
Recently, SARS‐CoV‐2 survivability on glass was studied at room temperature and RH of 65%. The virus stayed infectious for 2 days and became completely undetectable after 4 days (Chin et al., 2020). SARS‐CoV‐1 retained its infectivity for a longer time (4 days) on glass at room temperature and completely decayed after 5 days (Duan et al., 2003). The stability of SARS‐CoV‐1 on mosaic at room temperature was similar to its stability on glass (survived for 3 days and decayed after 4 days) (Duan et al., 2003). Similarly, HCoV‐229E survived for 5 days on either glass or ceramic surfaces at room temperature. The time required for complete inactivation of this virus on both surfaces was not reported (Warnes et al., 2015). On surgical latex gloves, HCoV‐229E survived for 3 hr and decayed after 6 hr while HCoV‐OC43 survived for less than an hour and completely decayed after 1 hr (Sizun et al., 2000). Another study found that infectivity of HCoV‐229E was detectable on silicon rubber at room temperature and 30%–40% RH for 3 days and that the virus became undetectable after 5 days (Warnes et al., 2015).
3.2. Persistence on porous surfaces
The survivability of SARS‐CoV‐2 on cardboard was studied in comparison with SARS‐CoV‐1. SARS‐CoV‐2 survived for a longer time (1 day) than SARS‐CoV‐1, which survived for only 8 hr under the same conditions (van Doremalen et al., 2020). In a comparative study (Table 2), SARS‐CoV‐2 showed variable persistence on different porous surfaces. In general, it survived longer (period of days) on surfaces with higher porosity than those with lower porosity (period of hours). For instance, it survived on inner and outer layers of surgical facemasks for 4 and 7 days, respectively, and for 1 day with complete decay after 2 days on cloth and banknotes. However, the virus survived for only 30 min on paper with complete decay after 3 hr (Chin et al., 2020). SARS‐CoV‐1 demonstrated similar survivability behaviour in terms of the porosity of the surface. It survived for >5 days on cloth and filter paper, 4 days on press paper and wood boards, and between <1 day and <2 days on disposable and cotton gowns, respectively (Duan et al., 2003; Lai, Cheng, & Lim, 2005). The survivability on lower porosity surfaces (such as cardboard) was only 8 hr (van Doremalen et al., 2020). Lai et al. (2005) reported that survival of SARS‐CoV‐1 on cotton and disposable gowns, and paper surfaces was proportional to the initial virus load (Table 2). Compared to 6 hr survivability of HCoV‐229E, the HCoV‐OC43 demonstrated lower survivability (only <1 hr on cotton gauze sponges) (Sizun et al., 2000).
4. PERSISTENCE OF CORONAVIRUSES IN HUMAN FLUIDS AND EXCREMENTS
Oral and upper respiratory tract fluids of the COVID‐19 patients are key factors in SARS‐CoV‐2 transmission as the current data indicate that the major routes of transmission are droplet, contact and aerosols (Lu & Shi, 2020). Faecal–oral transmission is also postulated since RNA of SARS‐CoV‐2 was detected in anal swab samples collected from COVID‐19 patients in China (Chen et al., 2020; Zhang et al., 2020a). In addition, infectious SARS‐CoV‐2 particles were isolated from stool specimens of COVID‐19 patients (Zhang et al., 2020). Furthermore, nucleic acid of SARS‐CoV‐2 was detected in urine samples from COVID‐19 cases (Wang, Li, et al., 2020). Therefore, it is very important to know how stable SARS‐CoV‐2 is in oral fluids and excrements of humans to help us project the roles that these items can play in transmitting this virus. To date, no data are available on the survival of SARS‐CoV‐2 in human excrements. However, this can be extrapolated from the available data on other CoVs (Table 3).
TABLE 3.
Persistence of coronaviruses in human excrements
| Excrement type | Virus | Temp (°C) | Persistence | Time of complete decay | # of log reduction | Reference |
|---|---|---|---|---|---|---|
| Stool (pH 6–7) from baby | SARS‐CoV‐1 | 20 | 1 hr | 3 hr | 4.75 | Lai et al. (2005) |
| Stool (pH 7–8) from normal adult | SARS‐CoV‐1 | 20 | 3 hr | 6 hr | 4.75 | Lai et al. (2005) |
| Stool (pH 8) from normal adult | SARS‐CoV‐1 | 20 | 6 hr | 1 day | 4.75 | Lai et al. (2005) |
| Stool (pH 9) from adult with diarrhoea | SARS‐CoV‐1 | 20 | 4 d | 5 d | 4.75 | Lai et al. (2005) |
| Stool | SARS‐CoV‐1 | 20 | 3 d | 4 d | 5 | Wang et al. (2005) |
| Domestic sewage | SARS‐CoV 1 | 20 | 2 d | 3 d | 5 | Wang et al. (2005) |
| Domestic sewage | SARS‐CoV 1 | 4 | 14 d | NR | NR | Wang et al. (2005) |
| Pasteurized settled sewage | TGEV | 25 | 21 d | 35 | 6.25 | Casanova et al. (2009) |
| Pasteurized settled sewage | TGEV | 4 | 35 d | NR | 1.5 | Casanova et al. (2009) |
| Pasteurized settled sewage | MCoV (MHV) | 25 | 21 d | 28 d | >6.5 | Casanova et al. (2009) |
| Pasteurized settled sewage | MCoV (MHV) | 4 | 35 d | NA | 1 | Casanova et al. (2009) |
| Primary effluent | HCoV‐229E | 23 | 2 d | 3 d | >2 | Gundy et al. (2009) |
| Primary effluent | FCoV (FIPV) | 23 | 2 d | 3 d | >3.1 | Gundy et al. (2009) |
| Secondary effluent | HCoV‐229E | 23 | 2 d | 3 d | >2.9 | Gundy et al. (2009) |
| Secondary effluent | FCoV (FIPV) | 23 | 2 d | 3 d | >3.7 | Gundy et al. (2009) |
| Urine | SARS‐CoV‐1 | 20 | 17 d | NR | NR | Wang et al. (2005) |
| Urine | SARS‐CoV‐1 | 21–25 | 5 d | NR | NR | Duan et al. (2003) |
| Sputum | SARS‐CoV‐1 | 21–25 | 5 d | NR | NR | Duan et al. (2003) |
| Serum | SARS‐CoV‐1 | 21–25 | 4 d | 5 d | 6 | Duan et al. (2003) |
Abbreviations: FCoV, Feline coronavirus; FIPV, Feline infectious peritonitis virus; M‐CoV (MHV), Murine coronavirus (Mouse hepatitis virus); NR, Not reported; TGEV, Transmissible gastroenteritis virus (porcine virus).
It has been found that coronaviruses can survive in stools for 1 hr to 4 days depending on the type and pH of the stool samples. For instance, SARS‐CoV‐1 survived in stool specimens from baby (pH = 6–7), normal adult (pH = 7–8), another normal adult (pH = 8), and adult with diarrhoea (pH = 9) for 1 hr, 3 hr, 6 hr and 4 days, respectively. The same virus was completely decayed in the same samples after 3 hr, 6 hr, 1 day and 5 days, respectively (Lai et al., 2005). Similarly, Wang et al. (2005) demonstrated that SARS‐CoV‐1 survived for 4 days and completely decayed after 5 days at room temperature in faecal samples collected from SARS‐CoV‐1 patients. The same study found that the virus could survive for 2 days and decayed completely after 3 days at room temperature in domestic sewage (Wang et al., 2005). Both human coronavirus (HCoV‐229E) and feline coronavirus [(FCoV or feline infectious peritonitis virus (FIPV)] survived for 2 days and decayed after 3 days in primary and secondary effluents (activated sludge) at 23°C (Gundy, Gerba, & Pepper, 2009). The TGEV and the MCoV (MHV) survived for longer periods (21 days for both) in pasteurized settled sewage at room temperature. The TGEV decayed after 35 days while MCoV was inactivated within 28 days under the same conditions (Casanova, Rutala, Weber, and Sobsey, 2009).
Two studies reported different persistence patterns of coronaviruses in urine. Duan et al. (2003) detected the infectivity of SARS‐CoV‐1 in urine for up to 5 days. However, the infectivity of the same virus was detected in urine for up to 17 days at room temperature in another study (Wang et al., 2005). None of the two studies reported the period for complete decay of the virus. In human sputum, SARS‐CoV‐1 persisted for 5 days while in human blood serum, it persisted for 4 days and decayed completely after 5 days (Duan et al., 2003).
In light of these results, possible faecal–oral transmission of SARS‐CoV‐2 is suggested. Furthermore, human coronaviruses such as SARS‐CoV‐1 and MERS‐CoV have been considered as having potential for foodborne transmission (Greening & Cannon, 2016). This is because several studies reported the association of gastroenteritis symptoms and infection by SARS‐CoV‐1 and MERS‐CoV (Chan et al., 2015; Cheng et al., 2004). Some studies revealed that up to 10.6% of patients with SARS‐CoV‐1 and 30% of patients with MERS‐CoV had diarrhoea (Chan et al., 2020). Likewise, diarrhoea and gastroenteritis symptoms have been reported in some cases of SARS‐CoV‐2 infection (Chan et al., 2020; Song et al., 2020). This indicates that SARS‐CoV‐2 may also have the potential for foodborne and waterborne transmission. This risk is probably greater in developing countries, which are known to have poor water treatment systems, poor hygienic measures in food processing and food service areas, and use untreated or partially treated sewage for irrigating fresh produce. (Aboubakr & Goyal, 2019; Goyal & Aboubakr, 2016; Mans, Armah, Steele, & Taylor, 2016). It should be noted, however, that until now there is no evidence implicating food or waterborne transmission of SARS‐CoV‐2 in developed countries. It is unlikely that foodborne transmission is occurring widely through food handlers as the level of virus deposited on foods is quite low and most of it would be inactivated in the stomach acid (Li, Zhao, & Hsern, 2021; Moore, Goulter, & Jaykus, 2015). However, this route of transmission cannot be completely excluded as assessed in a detailed risk assessment study by the UK‐Food Standards Agency (Oakenfull & Wilson, 2020).
5. PERSISTENCE OF CORONAVIRUSES IN WATER
The stability of coronaviruses has been studied in several types of waters (Table 4). At room temperature, SARS‐CoV‐1 suspended in water stayed detectable for 3 days and was undetectable after 5 days (Duan et al., 2003). Another study reported only 2 days persistence and 3 days for complete decay of this virus in both chlorinated and dechlorinated tap water at room temperature (Wang et al., 2005). The human coronavirus (HCoV‐229E) survived a little longer (6 days with complete decay after 10 days) in dechlorinated tap water (Gundy et al., 2009). On the other hand, animal coronavirus such as TGEV and MCoV showed much longer survivability in reagent‐grade water at room temperature. The infectivity of TGEV was detectable for 6 weeks, which became undetectable after 7 weeks, while MCoV stayed detectable for 7 weeks (the end of the study period) with no complete decay reported (Casanova et al., 2009).
TABLE 4.
Persistence of coronaviruses suspended in liquids and water
| Suspending liquid | Virus | Temp. (°C) | Persistence | Time of complete decay | # of log reduction | Reference |
|---|---|---|---|---|---|---|
| Water | SARS‐CoV‐1 | 21–25 | 4 day | 5 day | 6 | Duan et al. (2003) |
| Water | SARS‐CoV‐1 | 20 | 2 day | 3 day | 5 | Wang et al. (2005) |
| Water | 4 | 14 day | NR | NR | ||
| De‐Cl tap water | 20 | 2 day | 3 day | 5 | ||
| De‐Cl tap water | 4 | 14 day | NR | NR | ||
| De‐Cl tap water | HCoV‐229E | 4 | 25 day | NR | <1 | Gundy et al. (2009) |
| 23 | 6 day | 10 day | 3.2 | |||
| RG‐Water | TGEV | 25 | 42 day | 49 day | 4.2 | Casanova et al. (2009) |
| RG‐Water | 4 | 49 day | NR | 0 | ||
| Lake water | 25 | >14 day | NR | 2.5 | ||
| Lake water | 4 | >14 day | NR | 1.2 | ||
| Lake water | MCoV (MHV) | 25 | >14 day | NR | 2.5 | |
| Lake water | 4 | >14 day | NR | 0 | ||
| RG‐Water | 25 | 49 day | NA | 5.5 | ||
| RG‐Water | 4 | 49 day | NA | 0 | ||
| DMEM | HCoV‐229E | 37 | 3 day | 4 day | 4 | Sizun et al. (2000) |
| HCoV‐OC43 | 37 | 6 day | NR | 1.3 | ||
| DMEM | SARS‐CoV‐1 | 4 | 2 hrr | NR | NR | Duan et al. (2003) |
| 20 | 2 hrr | NR | NR | |||
| 37 | 2 hrr | NR | NR | |||
| 56 | 1 hrr | 1.5 hr | 6 | |||
| 67 | 30 min | 1 hr | 6 | |||
| 75 | 15 min | 30 min | 6 | |||
| DMEM | SARS‐CoV‐1 | 56 | 1 hr | NR | 5 * | Darnell et al. (2004) |
| 65 | 1 hr | NR | 4.5 * | |||
| 75 | 30min | 45 min | ||||
| DMEM | SARS‐CoV‐1 | 56 | 30 min | 1 hr | 6.4 | Kariwa et al. (2006) |
| DMEM | MERS‐CoV | 25 | 2 hrr | NR | 0 | Leclercq et al. (2014) |
| 56 | 25 min | 1 hr | 4 | |||
| 65 | 1 min | 15 min | 4 | |||
| DMEM | SARS‐COV‐2 | 4 | 14 day | NR | 0.47 | Chin et al. (2020) |
| 22 | 7 day | 14 day | 6.5 | |||
| 37 | 1 day | 2 day | 6.5 | |||
| 56 | 10 min | 30 min | 6.5 | |||
| 70 | 1min | 5 min | 6.5 | |||
| MEM | SARS‐CoV‐1 | 4 | 30 min | NR | 0 | Rabenau et al. (2005) |
| MEM + 20%FCS | 4 | 30 min | NR | 0 | ||
| MEM | 56 | < 30 min | 30 min | ≥5.01 | ||
| MEM + 20%FCS | 56 | 30 min | NR | 1.93 | ||
| MEM | 60 | <30 min | 30 min | ≥5.01 | ||
| MEM + 20%FCS | 60 | <30 min | 30 min | ≥5.01 | ||
| MEM | 21–25 | 9 day | NR | <1 | ||
| MEM + 20%FCS | 21–25 | 9 day | NR | <1 | ||
| MEM | SARS‐CoV‐1 | 20 | 7 day | NR | 3.75 | Lai et al. (2005) |
| MEM | HCoV‐229E | 21–25 | 9 day | NR | <2 | Rabenau et al. (2005) |
| MEM + FCS | 21–25 | 9 day | NR | <2 | ||
| MEM | MCoV(MHV) | 40 | 30 min | NR | 0.28 | Saknimit et al. (1988) |
| 60 | 5 min | 15 min | >4.5 | |||
| 80 | <1 min | 1 min | >4.5 | |||
| MEM | CCoV | 60 | 5 min | 15 min | >4.5 | Saknimit et al. (1988) |
| 80 | <1 min | 1 min | >4.5 | |||
| HEPES | TGEV | 31 | 80 hrr | NR | <1 | Laude (1981) |
| 35 | 80 hrr | NR | 1 | |||
| 39 | 80 hrr | NR | 3 | |||
| 43 | 50 hrr | NR | ~3.5 | |||
| 47 | 22 hrr | 30 hr | > 4 | |||
| 51 | 6 hrr | 8 hr | > 4 | |||
| 55 | 2 hrr | 6 hr | > 4 | |||
| PBS | HCoV‐229E | 37 | 6 day | NA | 0.52 | Sizun et al. (2000) |
| HCoV‐OC43 | 37 | 6 day | NA | 0.3 | ||
| PBS | SARS‐CoV‐1 | 20 | 14 day | NA | ‐ | Wang et al. (2005) |
| 4 | 14 day | NA | ‐ |
Abbreviations: CCoV, Canine coronavirus; De‐Cl tap water, Dechlorinated tap water; DMEM, Dulbecco`s modified Eagle media; FCS, Foetal calf serum; HEPES buffer, 4‐(2‐hydroxyethyl)‐1‐piperazineethanesulfonic acid buffer; MCoV (MHV), Murine coronavirus (Mouse hepatitis virus); MEM, Minimal essential medium; NR, Not reported; PBS, Phosphate‐buffer saline; RG‐Water, Reagent water; TGEV, Transmissible gastroenteritis virus (porcine virus).
6. INFLUENCE OF TEMPERATURE AND/OR HUMIDITY ON THE PERSISTENCE OF COVS
The fragile structure of viruses, particularly enveloped viruses like CoVs, and the way they infect their host cells make them susceptible to heat. Virus inactivation by heat is due to denaturation of the secondary structures of viral capsid proteins thereby altering the conformation of virion proteins involved in attachment and replication within a host cell (Lelie, Reesink, & Lucas, 1987; Schlegel, Immelmann, & Kempf, 2001). The inactivation of viruses at low temperature is due to a random degradation in the nucleic acid; but at high temperature, a greater change in the conformation of the virus structural proteins occurs and leads to virus inactivation (Laude, 1981). In addition, other environmental parameters such as relative humidity can play a role in virus persistence in the environment, particularly in aerosols. Therefore, understanding the possible effect of heat and RH on the persistence of SARS‐CoV‐2 is of significant value to develop proper infection control measures.
6.1. Influence of temperature on persistence of coronaviruses suspended in liquids
Many studies have reported higher persistence of several CoVs in water and liquids at lower temperatures as compared to higher temperatures (Table 4). For instance, the infectivity of SARS‐CoV‐1 in dechlorinated tap water was detectable for 14 days at 4°C but for only 2 days at 20°C (Wang et al., 2005). Similarly, HCoV‐229E decayed completely after 10 days in dechlorinated water at 23°C, but was detectable at least for 25 days at 4°C in the same type of water (Gundy et al., 2009). Another study showed that after 49 days, the TGEV completely decayed in reagent‐grade water at room temperature (25°C) while stayed infectious in the same type of water when stored at 4°C for the same period. The MCoV (MHV) showed similar results in the same study (Casanova et al., 2009). After 2 weeks, the titres of lake water‐suspended TGEV and MHV were reduced by 2.5 log when stored at 25°C but only 1.2 and <1 log of virus titres, respectively, were reduced at 4°C in the same type of water (Casanova et al., 2009).
SARS‐CoV‐2 persisted for 14, 7 and 1 day in Dulbecco's modified Eagle medium (DMEM), at 4°C, 22°C and 37°C, respectively. When the temperature was increased to 56°C and 70°C, the persistence time was dramatically reduced to 10 min and 1 min, respectively (Chin et al., 2020). SARS‐CoV‐1 stayed detectable in DMEM for 2 hr at 4°C, 20°C and 37°C. However, when storage temperature was increased to 56°C, 67°C and 75°C, the virus decayed completely after 1.5 hr, 1 hr and 30 min, respectively (Duan et al., 2003). Another study on SARS‐CoV‐1 in DMEM found that the virus stayed detectable after 1 hr at 56°C and 65°C but decayed completely after 45 min at 75°C (Darnell, Subbarao, Feinstone, & Taylor, 2004). Likewise, MERS‐CoV stability in DMEM decreased with an increase in temperature (Leclercq, Batejat, Burguière, & Manuguerra, 2014). SARS‐CoV‐1 was detectable in minimal essential medium (MEM) for 30 min at 4°C, while at 56°C and 60°C, it became completely undetectable after 30 min (Rabenau et al., 2005). The decrease in virus infectivity due to an increase in temperature was also reported for animal coronaviruses such as mouse coronavirus (MCoV or MHV) and canine coronavirus (CCoV) in MEM, and for TGEV in HEPES buffer (Laude, 1981; Saknimit, Inatsuki, Sugiyama, & Yagami, 1988).
6.2. Influence of temperature and RH on the stability of CoVs in aerosols
Several studies have found that the survivability of coronaviruses in aerosols is affected by environmental conditions, particularly temperature and relative humidity. For instance, the survival of HCoV‐229E in aerosols was studied at two temperatures (6°C and 20°C) and three RH levels (low, 30%; medium, 50%; high, 80%) (Ijaz et al., 1985). The high and low RH levels represented the two extremes in indoor atmospheric conditions in the temperate regions in the summer and winter seasons, respectively, while medium RH reflected the inside atmosphere of climatically controlled buildings. The two temperatures were selected to represent the range encountered in late winter and early spring (6°C to 20°C) or in indoor environments (20°C). The results demonstrated that HCoV‐229E survived longer at 6°C than 20°C at all RH levels (Table 1). In addition, the aerosolized virus survived for a longer time at medium RH (50%) with half‐lives of 102.5 hr and 67.3 hr at 6 and 20°C, respectively. On the other hand, high RH (80%) at 20°C was found to be the least favourable to the survival of aerosolized virus as it showed only 3 hr half‐life at these conditions (Ijaz et al., 1985).
The stability of MERS‐CoV in aerosols for 10 min was studied under 20°C/40% RH and 20°C/70%RH (reflecting average indoor and outdoor environment during winter in the Middle East region, respectively). The results showed that the virus was less stable at higher RH than lower RH (Van Doremalen et al., 2013). Another study on MERS‐CoV was carried out at two different environmental conditions (25°C /79%RH and 38°C /24%RH) mimicking the common office and summer season climates in the Middle Eastern region. At the common office condition (low temperature and high RH), 63% of the virus retained its infectivity. However, virus survival drastically decreased (4.7% survival) in the hot and dry air common to the summer season (Pyankov et al., 2018).
6.3. Influence of temperature and RH on the stability of CoVs on surfaces and fomites
Many studies have shown that the persistence of coronaviruses on surfaces and fomites is affected by temperature and relative humidity. In general, the available data show that coronaviruses survive longer at low temperatures and low RH (Table 2). For instance, under 80%–90%RH and >95% RH, SARS‐CoV‐1 lost 0.75log and 1 log of its titre, respectively, on plastic surface at 33°C after 1 day, while at 38°C, 2 and 3.5 log reduction in virus titre was seen (Chan et al., 2011). Similar results were observed for MERS‐CoV on plastic and stainless steel surfaces at 30°C; the virus decayed completely after 2 days and 1day when the samples were stored at 30% and 80% RH, respectively. However, at 40% RH, lower temperature (20°C) increased the persistence of the virus and delayed its complete decay to 3 days (van Doremalen et al., 2013). The TGEV and MCoV showed lower persistence on stainless steel under high temperature and high RH. After 28 days at 4°C, TGEV titre was reduced by 0.25 and 3 logs under 20% and 80% RH, respectively. However, the log reduction in virus titre was higher (2 and 5 log, respectively) at 20°C (Casanova et al., 2010). Similarly, the titre of MCoV (MHV) was reduced by 0.25 and 2.5 logs under 20% and 80% RH, respectively, when stored at 4°C on stainless steel surface. At 20°C , however, 2 and 5 log reduction was seen (Casanova et al., 2010).
6.4. Influence of temperature on the stability of CoVs in sewage
Temperature has also been shown to influence the persistence of coronaviruses in sewage. The infectivity of SARS‐CoV‐1 was detectable for 14 days in domestic sewage when it was stored at 4°C but for only 2 days at 20°C (Wang et al., 2005). In pasteurized settled sewage, the infectivity of both porcine coronavirus (TGEV) and mouse coronavirus (MCoV or MHV) was detectable for up to 35 days at 4°C but for 21 days only at 25°C (Casanova et al., 2009).
7. INFLUENCE OF pH ON THE STABILITY OF COVS
Conformational changes in the spike proteins of CoVs are essential to enable the fusion of the virion with the host cell. Weismiller, Sturman, Buchmeier, Fleming, and Holmes (1990) found that this process is induced in MCoV (MHV) at a pH of 8.0. On the contrary, neutral pH mediated the spike protein's fusion of SARS‐CoV‐1 with the host cell (Xiao, Chakraborti, Dimitrov, Gramatikoff, & Dimitrov, 2003). Procock and Garwes (1975) also demonstrated that adsorption, penetration, uncoating and RNA replication of TGEV in the host cell was determined by pH. In general, it has been found that CoVs are more stable at near‐neutral pH as compared to the extreme acidic or alkaline pH. SARS‐CoV‐1 suspended in MEM completely lost its infectivity after 1 hr exposure to extreme acidic pH (1 and 3) and extreme alkaline pH (12 and 14) regardless of the temperature (4°C, 25°C and 37°C). However, the virus retained its infectivity when stored at pH 5, 7 and 9 for 1 hr (Darnell et al., 2004). Similarly, HCoV 229E, MHV, TGEV and CCoV showed more stability at slightly acidic to neutral pH (6–7.5) than at highly acidic or highly alkaline pH (8) at both low and high temperatures. However, low temperature (4°C) increases the stability of these viruses at extreme pH values than at higher temperatures (25°C and 37°C) (Daniel & Talbot, 1987; Lamarre & Talbot, 1989; Pocock et al., 1975; Pratelli, 2008; Sturman, Ricard, & Holmes, 1990). In contrast to other CoVs, SARS‐CoV‐2 showed higher stability when incubated at room temperature in the transport medium for 1 hr at a wide range of pH values (pH 3–10) (Chin et al., 2020). This finding may help explain the high spread rate of SARS‐CoV‐2 as compared to other human coronaviruses such as SARS‐CoV‐1 and MERS‐CoV.
8. THE INFLUENCE OF CLIMATIC CONDITIONS AND METEOROLOGICAL FACTORS ON THE SPREAD OF SARS‐COV‐2
8.1. Temperature and humidity
The results presented in the previous sections clearly show that the ability of coronaviruses to survive in aerosols, on surfaces and fomites, and in suspensions and liquids is affected by temperature and relative humidity. In general, human and animal CoVs including SARS‐CoV‐2 showed more persistence under low temperature and low RH. These results indicate that the spread of SARS‐CoV‐2 might be seasonally associated with winter and that it might be easier to control the virus spread during the summer months because of the high temperature and high humidity during those months.
This assumption is supported by the fact that annual epidemics of influenza virus and HCoV in temperate climates are usually activated by a sudden drop in outdoor temperatures (Sundell, Andersson, Brittain‐Long, Lindh, & Westin, 2016). This is attributed to the lower amount of water vapour that a unit of air can hold at low temperature; which means that the air is very dry in terms of the absolute humidity (AH) and this leads to a reduction in the size of aerosol droplets due to evaporation. This prolongs the time when the infectious droplets remain airborne thereby increasing the chance of infecting new hosts (Harper, 1961). On the same principle, maintaining high humidity along with indoor heating during winter months might reduce the transmission of these viruses. This is attributed to the indoor heating during wintertime, which causes a sharp decrease in the RH of the indoor environment and subsequently reduces the size of aerosol particles through evaporation (Yang & Marr, 2011).
Recent epidemiological studies consistently report a strong relationship between climatic conditions and the spread of SARS‐CoV‐2. Wang, Jiang, et al. (2020) studied the relationship between daily means of temperatures and cumulative numbers of confirmed COVID‐19 cases in the world from January 20 to February 4, 2020. They found that temperature can alter the transmission of SARS‐CoV‐2 and suggested that countries and regions with a lower temperature should adopt the strictest control measures to prevent future reversal. Another study examined the effect of temperature and humidity on the global patterns of early outbreak dynamics of COVID‐19 (between January and March 2020). They found a strong impact of temperature and the humidity on the growth rate of COVID‐19 cases across the world. The growth rate of COVID‐19 cases peaked at a temperature of ~5°C and a humidity of 0.6–1 kPa in the temperate regions of the Northern Hemisphere during the outbreak month, while it decreased in regions that had warmer or colder temperatures (Ficetola & Rubolini, 2020). A similar study found that the high COVID‐19 community transmission areas across the world are located along the 30‐50ᵒ N’ corridor at similar weather patterns of 5°C –11°C average temperatures with low specific (3–6 g/kg) and absolute humidity (4–7 g/m3) (Sajadi et al., 2020). Likewise, average pressure, average temperature, minimum temperature and average water vapour pressure were found to be significantly correlated with the incidence of COVID‐19 (Li et al., 2020).
Another epidemiological modelling study projected recurrent wintertime outbreaks of SARS‐CoV‐2 within the next five years (Kissler, Tedijanto, Goldstein, Grad, & Lipsitch, 2020). A group of 200 ecological niche models were developed to project monthly variation in climate suitability for spread of SARS‐CoV‐2 throughout a typical climatological year. The models showed that temperate warm and cold climates are more suitable to spread of the virus, whereas arid and tropical climates are less favourable (Araújo & Naimi, 2020). Contrary to the aforementioned reports, another study reported that there is no evidence for temperature‐dependence of the COVID‐19 pandemic (Jamil, Alam, Gojobori, & Duarte, 2020). We think that even if the climate conditions of summer season or warm regions may mitigate the growth rate of COVID‐19 cases, no geographical region is immune to this risk since the fast growth rate of COVID‐19 cases has also occurred in some warm climates such as Brazil and the Philippines. Therefore, strict measures for controlling the spread of the disease remain essential in all areas of the world and the absence of containment actions might lead to severe outbreaks in warm regions too (Hellewell et al., 2020).
8.2. UV and sunlight irradiance
The International Commission on Illumination (CIE) classified the ultraviolet radiation into three bands: UVC (100–280 nm), UVB (280–315 nm) and UVA (315–400 nm). Visible light is the region between 400 nm and 780 nm. The UVC is known as germicidal UV as it is absorbed by RNA and DNA bases of the virus thereby causing photochemical fusion of two adjacent pyrimidines and forming covalently linked dimers, which then become non‐pairing bases (Perdiz et al., 2000). The potential of UVB inducing the formation of pyrimidine dimers is 20–100‐fold lower than that of UVC (Perdiz et al., 2000). DNA and RNA absorb UVA weakly and, therefore, its effect is much lower than UVC and UVB in the formation of pyrimidine dimers. However, UVA may cause other genetic damage such as oxidation of the bases and strand cleavage through the production of reactive oxygen species (Ravanat, Douki, & Cadet, 2001).
A few studies have investigated the effect of artificial ultraviolet radiation (UVR) on coronaviruses (Table 5). SARS‐CoV‐1 was completely inactivated (~6 log reduction) in MEM following 1‐hr exposure to UVC (260nm) irradiance of >90 µW/cm2 at 83 cm exposure distance (Duan et al., 2003). In a comparative study, 6 min exposure to UVC (254nm) irradiance of 4,016 µW/cm2 completely inactivated 5.5 log of SARS‐CoV‐1. However, 15 min exposure to UVA (365nm) irradiance of 2,133 µW/cm2 did not show any virucidal efficacy against this virus (Darnell et al., 2004). A third study demonstrated 5.3 and 6.3 log reduction of SARS‐CoV‐1 following exposure to 134 µW/cm2 of UVC (254) for 15 and 60 min, respectively, without complete inactivation of the virus (Kariwa, Fujii, & Takashima, 2006). Another study showed a 4.8 log reduction in CCoV after 3 days of exposure to a very weak irradiance (7.1 µW/cm2) of UVC at 4 cm exposure distance (Pratelli, 2008).
TABLE 5.
Inactivation efficacy of UVR against coronaviruses
| UV type | Virus | UV irradiance (µW/cm2) |
Initial titre (Log10 TCID50) |
Exposure time (min) | # of log reduction | Complete inactivation | Reference |
|---|---|---|---|---|---|---|---|
| UVC (260 nm) | SARS‐CoV1 | >90 | 6 | 60 min | 6 | Achieved | Duan et al. (2003) |
| UVA (365 nm) | SARS‐CoV1 | 2,133 | 5.5 | 15 min | 0 | Not achieved | Darnell et al. (2004) |
| UVC (254 nm) | SARS‐CoV1 | 4,016 | 5.5 | 6 min | 4* | Achieved | Darnell et al. (2004) |
| UVC (254 nm) | SARS‐CoV1 | 134 | 7.5 | 15 min | 5.3 | Not achieved | Kariwa et al. (2006) |
| UVC (254 nm) | SARS‐CoV1 | 134 | 7.5 | 60 min | 6.3 | Not achieved | Kariwa et al. (2006) |
| UVC (254 nm) | CCoV | 7.1 | 6.8 | 72 hr | 4.8 | Not achieved | Pratelli (2008) |
Below detection limit.
It is known that optical radiation from the sun is the only natural source of UVR that reaches the Earth through the atmosphere. However, only two‐thirds of the energy from the sun that impinges on the atmosphere penetrates to the ground level. The UVR comprises ~5% of the total radiation received at the surface of the Earth. This component is extremely important in various biological processes (Solar IARC, 1992). Based on the virucidal efficacy of artificial UV radiation presented above and because there is no consensus on the suggested correlation between climate temperature and COVID‐19 spread, Backer (2020) investigated the correlation between irradiance or sunlight and COVID‐19 spread. This observational study revealed that sun irradiance reduces the transmission of SARS‐CoV‐2. For example, COVID‐19 epidemic exploded during the darkest January in over 10 years in Wuhan (Bäcker, 2020). On the other hand, the available experimental data do not support this suggestion. Despite the reported virucidal efficacy of UVC, its radiation from sun is completely filtered by the atmosphere and it does not reach the earth's surface (WHO, 2020f). In addition, 95% of the sun's UV radiation reaching the Earth's surface is UVA (WHO, 2020f), which has no virucidal efficacy (Table 4). On the other hand, the UVB of the sun partially penetrates and reaches the earth's surface and its influence on other viruses has been reported (El‐Ghorr, Horsburgh, & Norval, 1998; Hart, Reid, & Hart, 1993; Karmer, Bos, & Teunissen, 1995; Sagripanti & Lytle, 2007). Therefore, studying the efficacy of sunlight and UVB on SARS‐CoV‐2 and the spread of COVID‐19 might provide some explanation on the observed correlation between sun irradiance and COVID‐19 spread.
9. CONCLUSIONS
The facts that the human coronaviruses HCoV‐229E, SARS‐CoV‐1 and SARS‐CoV‐2 can remain infectious in aerosols for 3 to 16 hr and can survive at room temperature and RH of 65% for a few days suggest possible airborne transmission of SARS‐CoV‐2. Therefore, stringent preventive measures should be taken by people in high‐risk regions and in healthcare settings to avoid this possible route of transmission. These findings support the CDC and WHO recommendations of covering faces by respirators or surgical masks or even by cloth covers in public during the COVID‐19 epidemic. The persistence of SARS‐CoV‐1 and SARS‐CoV‐2 was significantly low on copper, latex and less porous fabrics as compared to other surfaces such as metals (stainless steel and zinc), glass and more porous fabrics. This information might be helpful in designing methods to significantly decrease viral transmission in healthcare buildings and other areas at risk.
The reported survival of SARS‐CoV‐1 and animal coronaviruses (TGEV and MCoV) in water and sewage along with diarrhoea and gastroenteritis symptoms linked to SARS‐COV‐2 infection indicates the possibility of foodborne and waterborne transmission of SARS‐CoV‐2. This poses additional risk in developing countries because of their use of sewage‐polluted waters for irrigation in addition to having poor water treatment systems. Although there are no confirmed foodborne or waterborne cases of SARS‐CoV‐2 so far, it is very important to devise methods that can concentrate small amounts of this virus from large amounts of water, wastewater and foods so adequate surveillance and epidemiological studies can be undertaken.
The longer survival of CoVs at low temperatures and low relative humidity explains the observed peaks of COVID‐19 cases during the cold and dry climates in temperate regions of the world and explains the predicted seasonality of the virus spread by epidemiological models. Additionally, a sun irradiance‐dependent spread of SARS‐CoV‐2 has been suggested in an observational study. Although the efficacy of the artificial UVC against SARS‐CoV‐1 has been reported, it does not support the suggested influence of sun's irradiance on SARS‐CoV‐2 spread because all natural UVC radiated by the sun is blocked by the atmosphere and does not reach the earth. Since artificial UVA showed no effect on SARS‐CoV‐1, it does not support the suggested sun irradiance‐dependent SARS‐CoV‐2 spread because the major type of natural solar UV radiation that reaches the earth is UVA. A few studies have shown virucidal efficacy of UVB on viruses other than CoVs. However, experimental studies on the efficacy of artificial UVB on SARS‐CoV‐2 are required to provide an explanation of the observed sun irradiance‐depended COVID‐19 spread.
CONFLICT OF INTEREST
The authors declare that the research was conducted in the absence of any commercial or financial relationships that could be construed as a potential conflict of interest.
ETHICAL STATEMENT
The authors confirm that the ethical policies of the journal, as noted on the journal\x92s author guidelines page, have been adhered to. No ethical approval was required as this is a review article with no original research data
AUTHOR CONTRIBUTIONS
HAA conceived the work and discussed the content with TAS and SMG. HAA drafted the manuscript. HAA, TAS and SMG reviewed and edited the final version of the manuscript.
ACKNOWLEDGMENTS
None.
Aboubakr HA, Sharafeldin TA, Goyal SM. Stability of SARS-CoV-2 and other coronaviruses in the environment and on common touch surfaces and the influence of climatic conditions: A review. Transbound Emerg Dis.2021;68:296–312. 10.1111/tbed.13707
DATA AVAILABILITY STATEMENT
Data sharing is not applicable to this article as no new data were created or analysed in this study.
REFERENCES
- Aboubakr, H. , & Goyal, S. (2019). Involvement of Egyptian Foods in Foodborne Viral Illnesses: The Burden on Public Health and Related Environmental Risk Factors: An Overview. Food and Environmental Virology, 11, 315–339. [DOI] [PubMed] [Google Scholar]
- Alonso, C. , Goede, D. P. , Morrison, R. B. , Davies, P. R. , Rovira, A. , Marthaler, D. G. , & Torremorell, M. (2014). Evidence of infectivity of airborne porcine epidemic diarrhea virus and detection of airborne viral RNA at long distances from infected herds. Veterinary Research, 45(1), 73. 10.1186/s13567-014-0073-z [DOI] [PMC free article] [PubMed] [Google Scholar]
- Araujo, M. B. , & Naimi, B. (2020). Spread of SARS‐CoV‐2 Coronavirus likely to be constrained by climate. medRxiv. 10.1101/2020.03.12.20034728 [DOI] [Google Scholar]
- Ashour, H. M. , Elkhatib, W. F. , Rahman, M. , & Elshabrawy, H. A. (2020). Insights into the recent 2019 novel coronavirus (SARS‐CoV‐2) in light of past human coronavirus outbreaks. Pathogens, 9(3), 186. 10.3390/pathogens9030186 [DOI] [PMC free article] [PubMed] [Google Scholar]
- Bäcker, A. (2020). Follow the Sun: Slower COVID‐19 Morbidity and Mortality Growth at Higher Irradiances. Available at SSRN: https://ssrn.com/abstract=3567587 or doi: 10.2139/ssrn.3567587. [DOI]
- Cai, J. , Sun, W. , Huang, J. , Gamber, M. , Wu, J. , & He, G. (2020). Indirect virus transmission in cluster of COVID‐19 cases, Wenzhou, China, 2020. Emerging Infectious Diseases, 26(6). 10.3201/eid2606.200412 [DOI] [PMC free article] [PubMed] [Google Scholar]
- Calvet, G. , Aguiar, R. S. , Melo, A. S. O. , Sampaio, S. A. , de Filippis, I. , Fabri, A. , … de Filippis, A. M. B. (2016). Detection and sequencing of Zika virus from amniotic fluid of fetuses with microcephaly in Brazil: A case study. The Lancet Infectious Diseases, 16(6), 653–660. 10.1016/S1473-3099(16)00095-5 [DOI] [PubMed] [Google Scholar]
- Casanova, L. M. , Jeon, S. , Rutala, W. A. , Weber, D. J. , & Sobsey, M. D. (2010). Effects of air temperature and relative humidity on coronavirus survival on surfaces. Applied and Environment Microbiology, 76(9), 2712–2717. 10.1128/AEM.02291-09 [DOI] [PMC free article] [PubMed] [Google Scholar]
- Casanova, L. , Rutala, W. A. , Weber, D. J. , & Sobsey, M. D. (2009). Survival of surrogate coronaviruses in water. Water Research, 43(7), 1893–1898. 10.1016/j.watres.2009.02.002 [DOI] [PMC free article] [PubMed] [Google Scholar]
- Centers for disease Control and Prevention, CDC . (2017). Severe Acute Respiratory Syndrome (SARS). Retrieved from https://www.cdc.gov/sars/index.html. Date accessed: 3/24/20.
- CDC . (2020). Human Coronavirus Types. Retrieved from https://www.cdc.gov/coronavirus/types.html. Date accessed: 7/3/20.
- Chan, J. F. , Lau, S. K. , To, K. K. , Cheng, V. C. , Woo, P. C. , & Yuen, K. Y. (2015). Middle East respiratory syndrome coronavirus: Another zoonotic betacoronavirus causing SARS‐like disease. Clinical Microbiology Reviews, 28(2), 465–522. 10.1128/CMR.00102-14 [DOI] [PMC free article] [PubMed] [Google Scholar]
- Chan, J.‐W. , Yuan, S. , Kok, K.‐H. , To, K.‐W. , Chu, H. , Yang, J. , … Yuen, K.‐Y. (2020). A familial cluster of pneumonia associated with the 2019 novel coronavirus indicating person‐to‐person transmission: A study of a family cluster. The Lancet, 395(10223), 514–523. 10.1016/S0140-6736(20)30154-9 [DOI] [PMC free article] [PubMed] [Google Scholar]
- Chan, K. H. , Peiris, J. S. M. , Lam, S. Y. , Poon, L. L. M. , Yuen, K. Y. , & Seto, W. H. (2011). The effects of temperature and relative humidity on the viability of the SARS coronavirus. Advances in Virology, 2011, 1–7. 10.1155/2011/734690 [DOI] [PMC free article] [PubMed] [Google Scholar]
- Chen, C. , Gao, G. , Xu, Y. , Pu, L. , Wang, Q. I. , Wang, L. , … Zhang, F. (2020). SARS‐CoV‐2–positive sputum and feces after conversion of pharyngeal samples in patients with COVID‐19. Annals of Internal Medicine, 172(12), 832–834. 10.7326/M20-0991 [DOI] [PMC free article] [PubMed] [Google Scholar]
- Cheng, V. C. C. , Hung, I. F. N. , Tang, B. S. F. , Chu, C. M. , Wong, M. M. L. , Chan, K. H. , … Yuen, K. Y. (2004). Viral replication in the nasopharynx is associated with diarrhea in patients with severe acute respiratory syndrome. Clinical Infectious Diseases, 38(4), 467–475. 10.1086/382681 [DOI] [PMC free article] [PubMed] [Google Scholar]
- Chin, A. W. H. , Chu, J. T. S. , Perera, M. R. A. , Hui, K. P. Y. , Yen, H.‐L. , Chan, M. C. W. , … Poon, L. L. M. (2020). Stability of SARS‐CoV‐2 in different environmental conditions. The Lancet Microbe, 10.1016/S2666-5247(20)30003-3 [DOI] [PMC free article] [PubMed] [Google Scholar]
- China news . (2020). The SRAS‐COV‐2 nucleic acid detected for the first time on the surface of door handle in Guangzhou and cleaning taken attention. https://www.msn.com/zh‐tw/news/world/武漢肺炎》不止戴口罩還要勤洗手‐廣州發現門把上有病毒/ar‐BBZAimp. Accessed April 6, 2020. [Google Scholar]
- Daniel, C. , & Talbot, P. J. (1987). Physico‐chemical properties of murine hepatitis virus, strain A59. Archives of Virology, 96(3–4), 241–248. 10.1007/BF01320963 [DOI] [PMC free article] [PubMed] [Google Scholar]
- Darnell, M. E. , Subbarao, K. , Feinstone, S. M. , & Taylor, D. R. (2004). Inactivation of the coronavirus that induces severe acute respiratory syndrome, SARS‐CoV. Journal of Virological Methods, 121(1), 85–91. 10.1016/j.jviromet.2004.06.006 [DOI] [PMC free article] [PubMed] [Google Scholar]
- DeCaprio, D. , Gartner, J. , Burgess, T. , Kothari, S. , & Sayed, S. (2020). Building a COVID‐19 Vulnerability Index. arXiv Preprint arXiv:2003.07347. [Google Scholar]
- Dilcher, M. , Werno, A. , & Jennings, L. C. (2020). SARS‐CoV‐2: A novel deadly virus in a globalised world. The New Zealand Medical Journal, 133(1510), 6. [PubMed] [Google Scholar]
- Drosten, C. , Günther, S. , Preiser, W. , van der Werf, S. , Brodt, H.‐R. , Becker, S. , … Doerr, H. W. (2003). Identification of a novel coronavirus in patients with severe acute respiratory syndrome. New England Journal of Medicine, 348(20), 1967–1976. 10.1056/NEJMoa030747 [DOI] [PubMed] [Google Scholar]
- Duan, S. M. , Zhao, X. S. , Wen, R. F. , Huang, J. J. , Pi, G. H. , … Zhang, S. X. ; SARS Research Team . (2003). Stability of SARS coronavirus in human specimens and environment and its sensitivity to heating and UV irradiation. Biomedical and Environmental Sciences: BES, 16(3), 246. [PubMed] [Google Scholar]
- El‐Ghorr, A. A. , Horsburgh, G. , & Norval, M. (1998). The effect of UVB irradiation on antibody responses during herpes simplex virus type 1 (HSV‐1) infections of mice. Photodermatology, Photoimmunology and Photomedicine, 14(1), 17–25. 10.1111/j.1600-0781.1998.tb00004.x [DOI] [PubMed] [Google Scholar]
- Fears, A. C. , Klimstra, W. B. , Duprex, P. , Hartman, A. , Weaver, S. C. , Plante, K. N. , … Roy, C. J. (2020). Comparative dynamic aerosol efficiencies of three emergent coronaviruses and the unusual persistence of SARS‐CoV‐2 in aerosol suspensions. medRxiv 2020.04.13.20063784; 10.1101/2020.04.13.20063784. [DOI] [Google Scholar]
- Ficetola, G. F. , & Rubolini, D. (2020). Climate affects global patterns of COVID‐19 early outbreak dynamics . Medrxiv. 10.1101/2020.03.23.2004050. [DOI] [Google Scholar]
- Ge, Z. Y. , Yang, L. M. , Xia, J. J. , Fu, X. H. , & Zhang, Y. Z. (2020). Possible aerosol transmission of COVID‐19 and special precautions in dentistry. Journal of Zhejiang University‐SCIENCE B, 21(5), 361–368. 10.1631/jzus.B2010010 [DOI] [PMC free article] [PubMed] [Google Scholar]
- Gorbalenya, A. E. , Baker, S. C. , & Baric, R. S. (2020). The species severe acute respiratory syndrome‐related coronavirus: Classifying 2019‐nCoV and naming it SARS‐CoV‐2. Nature Microbiology, 5(4), 536–544. [DOI] [PMC free article] [PubMed] [Google Scholar]
- Goyal, S. M. , & Aboubakr, H. A. (2016). Methods for Virus Recovery from Foods. In Goyal S., & Cannon J. (Eds.), Viruses in Foods. Food Microbiology and Food Safety. Springer, Cham. 10.1007/978-3-319-30723-7_9 [DOI] [Google Scholar]
- Greening, G. E. , & Cannon, J. L. (2016). Human and animal viruses in food (including taxonomy of enteric viruses). In Goyal S., & Cannon J. (Eds.), Viruses in Foods. Food Microbiology and Food Safety. Cham: Springer. 10.1007/978-3-319-30723-7_2 [DOI] [Google Scholar]
- Guery, B. , Poissy, J. , el Mansouf, L. , Séjourné, C. , Ettahar, N. , Lemaire, X. , … van der Werf, S. (2013). Clinical features and viral diagnosis of two cases of infection with Middle East Respiratory Syndrome coronavirus: A report of nosocomial transmission. The Lancet, 381(9885), 2265–2272. 10.1016/S0140-6736(13)60982-4 [DOI] [PMC free article] [PubMed] [Google Scholar]
- Gundy, P. M. , Gerba, C. P. , & Pepper, I. L. (2009). Survival of coronaviruses in water and wastewater. Food and Environmental Virology, 1(1), 10. 10.1007/s12560-008-9001-6 [DOI] [Google Scholar]
- Han, Q. , Lin, Q. , Ni, Z. , & You, L. (2020). Uncertainties about the transmission routes of 2019 novel coronavirus. Influenza and Other Respiratory Viruses, 14(4), 470–471. 10.1111/irv.12735 [DOI] [PMC free article] [PubMed] [Google Scholar]
- Harper, G. J. (1961). Airborne micro‐organisms: Survival tests with four viruses. Epidemiology and Infection, 59(4), 479–486. 10.1017/S0022172400039176 [DOI] [PMC free article] [PubMed] [Google Scholar]
- Hart, H. , Reid, K. , & Hart, W. (1993). Inactivation of viruses during ultraviolet light treatment of human intravenous immunoglobulin and albumin. Vox Sanguinis, 64(2), 82–88. 10.1111/j.1423-0410.1993.tb02523.x [DOI] [PubMed] [Google Scholar]
- Hellewell, J. , Abbott, S. , Gimma, A. , Bosse, N. I. , Jarvis, C. I. , Russell, T. W. , … van Zandvoort, K. (2020). Feasibility of controlling COVID‐19 outbreaks by isolation of cases and contacts. The Lancet Global Health, 8(4), 488–496. 10.1016/S2214-109X(20)30074-7 [DOI] [PMC free article] [PubMed] [Google Scholar]
- Ijaz, M. K. , Brunner, A. H. , Sattar, S. A. , Nair, R. C. , & Johnson‐Lussenburg, C. M. (1985). Survival characteristics of airborne human coronavirus 229E. Journal of General Virology, 66(12), 2743–2748. 10.1099/0022-1317-66-12-2743 [DOI] [PubMed] [Google Scholar]
- Jamil, T. , Alam, I. S. , Gojobori, T. , & Duarte, C. (2020). No Evidence for Temperature‐Dependence of the COVID‐19 Epidemic. medRxiv, 10.1101/2020.03.29.20046706 [DOI] [PMC free article] [PubMed] [Google Scholar]
- Jhons Hopkins University of Medicine, JHU . (2020). Coronavirus Resource Center. Retrieved from https://coronavirus.jhu.edu/.
- Kariwa, H. , Fujii, N. , & Takashima, I. (2006). Inactivation of SARS coronavirus by means of povidone‐iodine, physical conditions and chemical reagents. Dermatology, 212(Suppl. 1), 119–123. 10.1159/000089211 [DOI] [PMC free article] [PubMed] [Google Scholar]
- King, A. M. Q. , Lefkowitz, E. J. , Mushegian, A. R. , Adams, M. J. , Dutilh, B. E. , Gorbalenya, A. E. , … Davison, A. J. (2018). Changes to taxonomy and the international code of virus classification and nomenclature ratified by the international committee on taxonomy of viruses (2018). Archives of Virology, 163, 2601–2631. 10.1007/s00705-018-3847-1 [DOI] [PubMed] [Google Scholar]
- Kissler, S. M. , Tedijanto, C. , Goldstein, E. , Grad, Y. H. , & Lipsitch, M. (2020). Projecting the transmission dynamics of SARS‐CoV‐2 through the postpandemic period. Science, 368(6493), 860–868. 10.1126/science.abb5793 [DOI] [PMC free article] [PubMed] [Google Scholar]
- Kremer, I. B. , Bos, J. D. , & Teunissen, M. B. M. (1995). Reduced antigen‐presenting function of human Epstein‐Barr virus (EBV)‐B cells and monocytes after UVB radiation is accompanied by decreased expression of B7, intercellular adhesion molecule‐1 (ICAM‐1) and LFA‐3. Clinical and Experimental Immunology, 101(3), 461–467. 10.1111/j.1365-2249.1995.tb03135.x [DOI] [PMC free article] [PubMed] [Google Scholar]
- Lai, C. C. , Shih, T. P. , Ko, W. C. , Tang, H. J. , & Hsueh, P. R. (2020). Severe acute respiratory syndrome coronavirus 2 (SARS‐CoV‐2) and corona virus disease‐2019 (COVID‐ 19): The epidemic and the challenges. International Journal of Antimicrobial Agents, 55(3), 105924– 10.1016/j.ijantimicag.2020.105924 [DOI] [PMC free article] [PubMed] [Google Scholar]
- Lai, M. Y. , Cheng, P. K. , & Lim, W. W. (2005). Survival of severe acute respiratory syndrome coronavirus. Clinical Infectious Diseases, 41(7), e67–e71. 10.1086/433186 [DOI] [PMC free article] [PubMed] [Google Scholar]
- Lamarre, A. , & Talbot, P. J. (1989). Effect of pH and temperature on the infectivity of human coronavirus 229E. Canadian Journal of Microbiology, 35(10), 972–974. 10.1139/m89-160 [DOI] [PubMed] [Google Scholar]
- Laude, H. (1981). Thermal inactivation studies of a coronavirus, transmissible gastroenteritis virus. Journal of General Virology, 56(2), 235–240. 10.1099/0022-1317-56-2-235 [DOI] [PubMed] [Google Scholar]
- Leclercq, I. , Batejat, C. , Burguière, A. M. , & Manuguerra, J. C. (2014). Heat inactivation of the Middle East respiratory syndrome coronavirus. Influenza and Other Respiratory Viruses, 8(5), 585–586. 10.1111/irv.12261 [DOI] [PMC free article] [PubMed] [Google Scholar]
- Lelie, P. N. , Reesink, H. W. , & Lucas, C. J. (1987). Inactivation of 12 viruses by heating steps applied during manufacture of a hepatitis B vaccine. Journal of Medical Virology, 23(3), 297–301. 10.1002/jmv.1890230313 [DOI] [PMC free article] [PubMed] [Google Scholar]
- Li, D. , Zhao, M. Y. , & Hsern, M. T. T. (2021). What makes a foodborne virus: Comparison between coronaviruses with human noroviruses. Current Opinion in Food Science, 41, 1–7. 10.1016/j.cofs.2020.04.011 [DOI] [PMC free article] [PubMed] [Google Scholar]
- Li, J. , Zhang, L. , Ren, Z. , Xing, C. , Qiao, P. , & Chang, B. (2020). Meteorological factors correlate with transmission of 2019‐nCoV: Proof of incidence of novel coronavirus pneumonia in Hubei Province, China. medrxiv, 10.1101/2020.04.01.2005052 [DOI] [Google Scholar]
- Lu, Q. , & Shi, Y. (2020). Coronavirus disease (COVID‐19) and neonate: What neonatologist need to know. Journal of Medical Virology, 92(6), 564–567. 10.1002/jmv.25740 [DOI] [PMC free article] [PubMed] [Google Scholar]
- Mans, J. , Armah, G. E. , Steele, A. D. , & Taylor, M. B. (2016). Norovirus epidemiology in Africa: A review. PLoS One, 11(4). [DOI] [PMC free article] [PubMed] [Google Scholar]
- Michels, H. T. , Wilks, S. A. , Noyce, J. O. , & Keevil, C. Copper alloys for human infectious disease control. Stainless Steel 77000, no. 55.0 (2005): 27–0. [Google Scholar]
- Moore, M. D. , Goulter, R. M. , & Jaykus, L. A. (2015). Human norovirus as a foodborne pathogen: Challenges and developments. Annual Review of Food Science and Technology, 6, 411–433. 10.1146/annurev-food-022814-015643 [DOI] [PubMed] [Google Scholar]
- National Health Commission of the People's Republic of China (NHCPRC) . (2020). Diagnosis and treatment protocols of pneumonia caused by a novel coronavirus (trial version 3). Retrieved from http://www.nhc.gov.cn/yzygj/s7653p/202001/f492c9153ea9437bb587ce2ffcbee1fa/files/39e7578d85964dbe81117736dd789d8f.pdf. Published on January 22, 2020.
- Oakenfull, R. J. , & Wilson, A. J. (2020). Qualitative Risk Assessment: What is the risk of food or food contact materials being a source or transmission route of SARS‐CoV‐2 for UK consumers?. UK: Food Standards Agency. Retrieved from https://www.food.gov.uk/sites/default/files/media/document/web‐version‐qualitative‐risk‐assessment‐risk‐of‐food‐or‐food‐contact‐materials‐as‐transmission‐route‐of‐sars‐cov‐2‐002.pdf. [Google Scholar]
- Pan, F. , Ye, T. , Sun, P. , Gui, S. , Liang, B. , Li, L. , … Zheng, C. (2020). Time course of lung changes on chest CT during recovery from 2019 novel coronavirus (COVID‐19) pneumonia. Radiology, 200370. [DOI] [PMC free article] [PubMed] [Google Scholar]
- Peiris, J. S. M. (2016). Coronaviruses. Clinical Virology, 1243–1265. [Google Scholar]
- Perdiz, D. , Gróf, P. , Mezzina, M. , Nikaido, O. , Moustacchi, E. , & Sage, E. (2000). Distribution and repair of bipyrimidine photoproducts in solar UV‐irradiated mammalian cells possible role of dewar photoproducts in solar mutagenesis. Journal of Biological Chemistry, 275(35), 26732–26742. 10.1074/jbc.M001450200 [DOI] [PubMed] [Google Scholar]
- Pocock, D. H. , & Garwes, D. J. (1975). The influence of pH on the growth and stability of transmissible gastroenteritis virusin vitro. Archives of Virology, 49(2–3), 239–247. 10.1007/BF01317542 [DOI] [PMC free article] [PubMed] [Google Scholar]
- Pratelli, A. (2008). Canine coronavirus inactivation with physical and chemical agents. The Veterinary Journal, 177(1), 71–79. 10.1016/j.tvjl.2007.03.019 [DOI] [PMC free article] [PubMed] [Google Scholar]
- Pyankov, O. V. , Bodnev, S. A. , Pyankova, O. G. , & Agranovski, I. E. (2018). Survival of aerosolized coronavirus in the ambient air. Journal of Aerosol Science, 115, 158–163. 10.1016/j.jaerosci.2017.09.009 [DOI] [PMC free article] [PubMed] [Google Scholar]
- Rabenau, H. F. , Cinatl, J. , Morgenstern, B. , Bauer, G. , Preiser, W. , & Doerr, H. W. (2005). Stability and inactivation of SARS coronavirus. Medical Microbiology and Immunology, 194(1–2), 1–6. 10.1007/s00430-004-0219-0 [DOI] [PMC free article] [PubMed] [Google Scholar]
- Ravanat, J. L. , Douki, T. , & Cadet, J. (2001). Direct and indirect effects of UV radiation on DNA and its components. Journal of Photochemistry and Photobiology B: Biology, 63(1–3), 88–102. 10.1016/S1011-1344(01)00206-8 [DOI] [PubMed] [Google Scholar]
- Sagripanti, J. L. , & Lytle, C. D. (2007). Inactivation of influenza virus by solar radiation. Photochemistry and Photobiology, 83(5), 1278–1282. 10.1111/j.1751-1097.2007.00177.x [DOI] [PubMed] [Google Scholar]
- Sajadi, M. M. , Habibzadeh, P. , Vintzileos, A. , Shokouhi, S. , Miralles‐Wilhelm, F. , & Amoroso, A. (2020). Temperature and latitude analysis to predict potential spread and seasonality for COVID‐19. SSRN Electronic Journal, 10.2139/ssrn.3550308 [DOI] [PMC free article] [PubMed] [Google Scholar]
- Saknimit, M. , Inatsuki, I. , Sugiyama, Y. , & Yagami, K. I. (1988). Virucidal efficacy of physico‐chemical treatments against coronaviruses and parvoviruses of laboratory animals. Experimental Animals, 37(3), 341–345. 10.1538/expanim1978.37.3_341 [DOI] [PubMed] [Google Scholar]
- Schlegel, A. , Immelmann, A. , & Kempf, C. (2001). Virus inactivation of plasma‐derived proteins by pasteurization in the presence of guanidine hydrochloride. Transfusion, 41(3), 382–389. 10.1046/j.1537-2995.2001.41030382.x [DOI] [PubMed] [Google Scholar]
- Sizun, J. , Yu, M. W. N. , & Talbot, P. J. (2000). Survival of human coronaviruses 229E and OC43 in suspension and after drying on surfaces: A possible source of hospital‐acquired infections. Journal of Hospital Infection, 46(1), 55–60. 10.1053/jhin.2000.0795 [DOI] [PMC free article] [PubMed] [Google Scholar]
- Solar, I. A. R. C . (1992). Ultraviolet radiation. Lyon, France: IARC Monographs on the Evaluation of Carcinogenic Risks to Humans, International Agency for Research on Cancer. World Health Organization. [Google Scholar]
- Song, Y. , Liu, P. , Shi, X. L. , Chu, Y. L. , Zhang, J. , Xia, J. , … Wang, M. Y. (2020). SARS‐CoV‐2 induced diarrhoea as onset symptom in patient with COVID‐19. Gut, 69(6), 1143–1144. 10.1136/gutjnl-2020-320891 [DOI] [PubMed] [Google Scholar]
- Specht, L. (2020). What does the coronavirus mean for the U.S. health care system? Some simple math offers alarming answers. Statnews, https://www.statnews.com/2020/03/10/simple‐math‐alarming‐answers‐covid‐19/. Accessed 24 Mar. 2020.
- Sturman, L. S. , Ricard, C. S. , & Holmes, K. V. (1990). Conformational change of the coronavirus peplomer glycoprotein at pH 8.0 and 37 degrees C correlates with virus aggregation and virus‐induced cell fusion. Journal of Virology, 64(6), 3042–3050. [DOI] [PMC free article] [PubMed] [Google Scholar]
- Sundell, N. , Andersson, L. M. , Brittain‐Long, R. , Lindh, M. , & Westin, J. (2016). A four year seasonal survey of the relationship between outdoor climate and epidemiology of viral respiratory tract infections in a temperate climate. Journal of Clinical Virology, 84, 59–63. 10.1016/j.jcv.2016.10.005 [DOI] [PMC free article] [PubMed] [Google Scholar]
- van Doremalen, N. , Bushmaker, T. , Morris, D. , Holbrook, M. , Gamble, A. , Williamson, B. , … Lloyd‐Smith, J. (2020). Aerosol and surface stability of HCoV‐19 (SARS‐CoV‐2) compared to SARS‐CoV‐1. The New England Journal of Medicine, 382, 1564–1567. 10.1056/NEJMc2004973 [DOI] [PMC free article] [PubMed] [Google Scholar]
- Van Doremalen, N. , Bushmaker, T. , & Munster, V. J. (2013). Stability of Middle East respiratory syndrome coronavirus (MERS‐CoV) under different environmental conditions. Eurosurveillance, 18(38), 20590. 10.2807/1560-7917.ES2013.18.38.20590 [DOI] [PubMed] [Google Scholar]
- Wang, L. , Li, X. , Chen, H. , Yan, S. , Li, Y. , Li, D. , & Gong, Z. (2020). SARS‐CoV‐2 infection does not significantly cause acute renal injury: an analysis of 116 hospitalized patients with COVID‐19 in a single hospital, Wuhan, China. Wuhan, China (2/17/2020). Available at SSRN: or 10.2139/ssrn.3541116 [DOI]
- Wang, M. , Jiang, A. , Gong, L. , Luo, L. , Guo, W. , Li, C. , … Chen, Y. (2020). Temperature significant change COVID‐19 Transmission in 429 cities. medRxiv. 10.1101/2020.02.22.20025791 [DOI] [Google Scholar]
- Wang, X.‐W. , Li, J.‐S. , Jin, M. , Zhen, B. , Kong, Q.‐X. , Song, N. , … Li, J.‐W. (2005). Study on the resistance of severe acute respiratory syndrome‐associated coronavirus. Journal of Virological Methods, 126(1–2), 171–177. 10.1016/j.jviromet.2005.02.005 [DOI] [PMC free article] [PubMed] [Google Scholar]
- Warnes, S. L. , & Keevil, C. W. (2013). Inactivation of norovirus on dry copper alloy surfaces. PLoS One, 8(9). 10.1371/journal.pone.0075017 [DOI] [PMC free article] [PubMed] [Google Scholar]
- Warnes, S. L. , Little, Z. R. , & Keevil, C. W. (2015). Human coronavirus 229E remains infectious on common touch surface materials. MBio, 6(6), e01697–e1715. 10.1128/mBio.01697-15 [DOI] [PMC free article] [PubMed] [Google Scholar]
- Weismiller, D. G. , Sturman, L. S. , Buchmeier, M. J. , Fleming, J. O. , & Holmes, K. V. (1990). Monoclonal antibodies to the peplomer glycoprotein of coronavirus mouse hepatitis virus identify two subunits and detect a conformational change in the subunit released under mild alkaline conditions. Journal of Virology, 64(6), 3051–3055. 10.1128/JVI.64.6.3051-3055.1990 [DOI] [PMC free article] [PubMed] [Google Scholar]
- WHO . (2020a). Severe acute respiratory syndrome. Retrieved from http://www.emro.who.int/health‐topics/severe‐acute‐respiratory‐syndrome/.
- WHO . (2020b). Middle East respiratory syndrome: MERS situation update, January 2020. Retrieved from http://www.emro.who.int/health‐topics/mers‐cov/mers‐outbreaks.html. Date accessed: 3/24/2020
- WHO . (2020c). Naming the coronavirus disease (COVID‐19) and the virus that causes it. Retrieved from https://www.who.int/emergencies/diseases/novel‐coronavirus‐2019/technical‐guidance/naming‐the‐coronavirus‐disease‐(covid‐2019)‐and‐the‐virus‐that‐causes‐it. Date accessed: 3/22/2020.
- WHO . (2020e). Surface sampling of coronavirus disease (COVID‐19): a practical “how to” protocol for health care and public health professionals (No. WHO/2019‐nCoV/Environment_protocol/2020.1). World Health Organization.
- WHO . (2020f). Ultraviolet radiation and the INTERSUN Programme. Retrieved from https://www.who.int/uv/faq/whatisuv/en/index2.html. Accessed: April 14, 2020.
- Wolff, M. H. , Sattar, S. A. , Adegbunrin, O. , & Tetro, J. (2005). Environmental survival and microbicide inactivation of coronaviruses. In Coronaviruses with special emphasis on first insights concerning SARS (pp. 201–212). Birkhäuser Basel. [Google Scholar]
- Xiao, W. J. , Wang, M. L. , Wei, W. , Wang, J. , Zhao, J. J. , Yi, B. , & Li, J. S. (2004). Detection of SARS‐CoV and RNA on aerosol samples from SARS‐patients admitted to hospital. Zhonghua liu xing bing xue za zhi= Zhonghua liuxingbingxue Zazhi, 25(10), 882–885. [PubMed] [Google Scholar]
- Xiao, X. , Chakraborti, S. , Dimitrov, A. S. , Gramatikoff, K. , & Dimitrov, D. S. (2003). The SARS‐CoV S glycoprotein: Expression and functional characterization. Biochemical and Biophysical Research Communications, 312(4), 1159–1164. 10.1016/j.bbrc.2003.11.054 [DOI] [PMC free article] [PubMed] [Google Scholar]
- Yang, W. , & Marr, L. C. (2011). Dynamics of airborne influenza A viruses indoors and dependence on humidity. PLoS One, 6(6). 10.1371/journal.pone.0021481 [DOI] [PMC free article] [PubMed] [Google Scholar]
- Zhang, W. , Du, R.‐H. , Li, B. , Zheng, X.‐S. , Yang, X.‐L. , Hu, B. , … Zhou, P. (2020). Molecular and serological investigation of 2019‐nCoV infected patients: Implication of multiple shedding routes. Emerging Microbes and Infections, 9(1), 386–389. 10.1080/22221751.2020.1729071 [DOI] [PMC free article] [PubMed] [Google Scholar]
Associated Data
This section collects any data citations, data availability statements, or supplementary materials included in this article.
Data Availability Statement
Data sharing is not applicable to this article as no new data were created or analysed in this study.