

Abstract
Aim
To estimate the prevalence of both cardiometabolic and other co‐morbidities in patients with COVID‐19, and to estimate the increased risk of severity of disease and mortality in people with co‐morbidities.
Materials and Methods
Medline, Scopus and the World Health Organization website were searched for global research on COVID‐19 conducted from January 2019 up to 23 April 2020. Study inclusion was restricted to English language publications, original articles that reported the prevalence of co‐morbidities in individuals with COVID‐19, and case series including more than 10 patients. Eighteen studies were selected for inclusion. Data were analysed using random effects meta‐analysis models.
Results
Eighteen studies with a total of 14 558 individuals were identified. The pooled prevalence for co‐morbidities in patients with COVID‐19 disease was 22.9% (95% CI: 15.8 to 29.9) for hypertension, 11.5% (9.7 to 13.4) for diabetes, and 9.7% (6.8 to 12.6) for cardiovascular disease (CVD). For chronic obstructive pulmonary disease (COPD), chronic kidney disease (CKD), cerebrovascular disease and cancer, the pooled prevalences were all less than 4%. With the exception of cerebrovascular disease, all the other co‐morbidities presented a significantly increased risk for having severe COVID‐19. In addition, the risk of mortality was significantly increased in individuals with CVD, COPD, CKD, cerebrovascular disease and cancer.
Conclusions
In individuals with COVID‐19, the presence of co‐morbidities (both cardiometabolic and other) is associated with a higher risk of severe COVID‐19 and mortality. These findings have important implications for public health with regard to risk stratification and future planning.
Keywords: co‐morbidities, coronavirus, COVID‐19, meta‐analysis, systematic review
1. INTRODUCTION
In December 2019, a new flu‐like virus causing atypical pneumonia emerged, affecting many individuals in the city of Wuhan, China. The syndrome caused by this virus, later recognized as coronavirus disease 2019 (COVID‐19), 1 has now reached pandemic levels. As of 4 May 2020, there have been 3 585 711 confirmed cases of COVID‐19 and 248 780 deaths reported worldwide. 2 COVID‐19 cases have been classified as mild, moderate, and severe or critical. 3 In its mild form, the symptoms are a cough and fever, while imaging shows no signs of lung inflammation. A case is classified as moderate if the patient has a fever, respiratory tract symptoms, and imaging shows visible lung inflammation. Severe cases of COVID‐19 include adults with any of the following: shortness of breath (respiratory rate of >30 breaths per minute), oxygen saturation <93% at rest, or arterial oxygen partial pressure <300 mmHg.
Based on early estimates made by China's National Health Commission of those who died from this outbreak, 75% had pre‐existing health conditions such as diabetes and cardiovascular disease. 4 , 5 Subsequently, other reports highlighted the high number of pre‐existing health conditions in patients with COVID‐19. 6 , 7 The overwhelming burden of COVID‐19 has led to severe pressure on the capacity of healthcare systems, and has adversely affected healthcare workers. 8 It is vital to identify patients at the highest risk of morbidity and mortality to ensure that adequate advice is given to those most at risk, and also to enable them to shield themselves from the spread of this disease. Such information is also important for future risk stratification for any preventative therapies or vaccinations.
Current knowledge about this novel virus is rapidly evolving, warranting the need to update systematic reviews as more evidence becomes available. Previous systematic reviews focusing on co‐morbidities have assessed the prevalence of co‐morbidities in COVID‐19 patients, and reported the increased odds of having co‐morbidities in patients with severe COVID‐19 compared with the non‐severe stage. 9 , 10 This systematic review and meta‐analysis assesses the risk of severity of disease and mortality in patients with COVID‐19 with cardiovascular and other co‐morbidities, compared with those patients without, and also updates current evidence on the prevalence of co‐morbidities in this patient group.
2. METHODS
2.1. Databases and search strategy
This study was conducted in accordance with the Preferred Reporting Items for Systematic reviews and Meta‐Analyses (PRISMA) 11 and Meta‐analyses Of Observational Studies in Epidemiology (MOOSE) 12 guidelines (completed checklists are provided in Figures S1 and S2). The protocol for this systematic review and meta‐analysis is registered at PROSPERO (CRD42020175966).
Three authors (AKS, RS and AS) performed an initial systematic search on 30 March 2020; an updated search was conducted (by CLG and SS) on 23 April 2020. For research into COVID‐19, 13 Medline, Scopus and the World Health Organization website were searched; the full search strategy is provided in Figure S3.
2.2. Eligibility criteria and study selection
We retrieved all studies conducted in patients with COVID‐19 that explicitly reported detailed epidemiological characteristics, prevalence of co‐morbidities, severity of the disease, and in‐hospital death outcomes. We excluded case reports, case series including less than 10 patients, studies which did not report the prevalence of co‐morbidities, and studies not published in the English language. Studies that reported the prevalence of co‐morbidities but did not report either mortality or the severity of COVID‐19 were still included, but only incorporated in the meta‐analysis of prevalence.
Initial abstract and title screening was carried out by two authors (AKS and SS). The full texts of studies that met our predefined inclusion criteria were screened by four authors (AKS, RS, AS and CLG), and those which met the inclusion criteria were retrieved for further review. Where it was clear that the study cohorts overlapped (i.e. the same hospital and time period for cases were specified), then the largest study was selected for inclusion. If studies had an overlapping cohort but reported the data for different analyses, then both were included in the systematic review but were analysed separately, with the studies contributing to different meta‐analyses. Any ambiguities during study selection were resolved by discussion and consensus. A detailed PRISMA flow diagram for the search strategy is illustrated in Figure 1.
FIGURE 1.

Flow diagram of literature search
2.3. Risk of bias and study quality
The Newcastle‐Ottawa Scale (NOS), proposed by Wells et al 50 and designed to evaluate the quality of non‐randomized studies, was employed to assess risk of bias. The NOS score consists of three categories: Selection, Comparability and Outcome. A study can be rated from 0 to 9. Two authors (YC and BC) independently assessed the studies for risk of bias and any disagreements were resolved through discussion.
2.4. Data extraction and statistical analysis
Three authors (AKS, RS and CLG) independently undertook data extraction according to the Cochrane Handbook for Systematic Reviews of Interventions guidelines. 15 Any disagreements were settled by all the authors reaching a consensus.
We calculated the estimated pooled prevalence of diabetes, hypertension, cardiovascular disease (CVD), chronic obstructive pulmonary disease (COPD), chronic kidney disease (CKD), cerebrovascular disease and cancer in COVID‐19 patients. We also calculated the estimated pooled relative risk of mortality and of contracting severe versus non‐severe COVID‐19 3 infection, as related to each co‐morbidity, using estimated risk ratios (RRs) with 95% confidence intervals (95% CIs). Different studies utilized different criteria to determine the severity of disease, and these criteria are listed in Table S1. Because of in‐between study heterogeneity, all models were fitted assuming random effects using the DerSimonian and Laird method. 15 This method is based on the inverse weighting approach, but incorporates an adjustment to the study weightings according to the extent of heterogeneity. Heterogeneity was assessed using Higgins I 2 statistic 16 and was interpreted as low (I 2 < 25%), moderate (I 2 = 25%‐50%) or high (I 2 > 50%). Between‐study heterogeneity was investigated by fitting meta‐regression models to assess the associations between study effect size, the mean age of patients (median age was used if the mean was not reported) and sex (proportion of males). Meta‐regression models were fitted using random effects univariable meta‐regression models, with the study effect size as the dependent variable, and the study characteristic of interest as the independent variable.
We evaluated the potential for publication bias within meta‐analyses by funnel plots and Egger's test. 15 For meta‐analyses where publication bias was found to be significant, the pooled effect size was recalculated using the ‘trim and fill’ adjustment based on the Duval and Tweedle non‐parametric method. 17 All analyses were carried out in Stata/IC 15.0 (StataCorp, Texas, USA) using the metan, metareg and metatrim commands.
3. RESULTS
3.1. Study characteristics
The search strategy identified 797 studies, of which 128 were found to be duplicates, and 405 were non‐clinical studies, review articles, commentaries and guidelines. After the full text review a further 146 studies were excluded, including 10 studies which had a cohort that overlapped with another larger study to be included in the analysis. 18 , 19 , 20 , 21 , 22 , 23 , 24 , 25 , 26 , 27 We included 18 studies with 14 558 patients in this systematic review. 28 , 29 , 30 , 31 , 32 , 33 , 34 , 35 , 36 , 37 , 38 , 39 , 40 , 41 Four pairs of studies had overlapping cohorts 28 , 29 , 31 , 33 , 37 , 42 , 43 , 44 but reported on different outcomes, and therefore each pair was included in the systematic review, but not incorporated in the same meta‐analyses. The characteristics of the included studies can be found in Table 1.
TABLE 1.
Characteristics of included studies
| Study name | Dates cases identified | Location (study design) | N | Age (y) (mean [SD]) | Male | Hypertension | Diabetes | CVD | COPD | Chronic kidney disease | Cerebrovascular disease | Cancer |
|---|---|---|---|---|---|---|---|---|---|---|---|---|
| CDC USA 30 | 12 Feb‐28 Mar | Laboratory confirmed cases reported to CDC, USA | 7162 c | — | — | — | 784 (10.9) | 647 (9.0) | 656 (9.2) | 213 (3.0) | — | — |
| Chen T 7 | 13 Jan‐12 Feb | Tongji Hospital, Wuhan, China | 274 |
<40 53 (19) 40‐59 68 (25) >60 153 (56) |
171 (62.4) | 93 (33.9) | 47 (17.2) | 23 (8.4) | 18 (6.6) | 4 (1.5) | 4 (1.5) | 7 (2.6) |
| Chen TL 28 | 01 Jan‐10 Feb | Zhongnan Hospital, Wuhan University, China | 203 | 54 (41‐68) a | 108 (53.2) | 43 (21.2) | 16 (7.9) | 16 (7.9) | 8 (3.9) | 8 (3.9) | 9 (4.4) | 7 (3.4) |
| Cheng 29 | 28 Jan‐11 Feb | 3 branches of Tongji Hospital, Wuhan, China | 701 | 63 (50‐71) a | 367 (52.4) | 233 (33.4) | 100 (14.3) | — | 13 (1.9) | 14 (2) | — | 32 (4.6) |
| Feng 31 | 01 Jan‐15 Feb | Jinyintan Hospital, Wuhan, and Tongling People's Hospital, Anhui Province, China | 476 | 53 (40‐64) a | 271 (56.9) | 113 (23.7) | 49 (10.3) | 38 (8) | 22 (4.6) | — | 17 (3.6) | 12 (2.5) |
| Grasselli 32 | 20 Feb‐18 mar | 72 hospitals, Lombardy region, Italy | 1043 c | 63 (56‐70) a | 1304 (82.0) | 509 (48.8) | 180 (17.3) | 223 (21.4) | 42 (4.0) | 36 (3.5) | — | 81 (7.8) |
| Guan 6 | 11 Dec‐29 Jan | 552 hospitals, China | 1099 | 47 (35‐58) a | 640 (58.2) | 165 (15.0) | 81 (7.4) | 27 (2.5) | 12 (1.1) | 8 (0.7) | 15 (1.4) | 10 (0.9) |
| Guo T 33 | 23 Jan‐23 Feb | Seventh Hospital, Wuhan City, China | 187 | 58.5 (14.7) | 91 (48.7) | 61 (32.6) | 28 (15.0) | 21 (11.3) | 4 (2.1) | 6 (3.2) | — | 13 (7.0) |
| Guo W 34 | 10 Feb‐29 Feb | 174 patients with SARS‐Cov‐2 infection who were admitted to Wuhan Union Hospital from 10 Feb 2020 to 29 Feb 2020 | 174 | 59 (49‐67) a | 76 (43.7) | 43 (24.7) | 37 (21.3) | 32 (18.4) | — | 13 (7.5) | 13 (7.5) | 17 (4.6) |
| Huang 35 | 01 Dec‐02 Jan | Jinyintan Hospital, Wuhan, China | 41 | 49 (41‐58) a | 30 (73.2) | 6 (14.6) | 8 (19.5) | 6 (14.6) | 1 (2.4) | — | — | 1 (2.4) |
| Lian 36 | 17 Jan‐12 Feb | Zhejiang Province, China | 788 | — | 407 (51.6) | 126 (16.0) | 57 (7.2) | 11 (1.4) | 3 (0.4) | 7 (0.9) | — | 6 (0.8) |
| Liang 37 | 21 Nov‐31 Jan | 575 hospitals, China | 1590 | 48.9 (16.3) | 904 (57.3) | 269 (16.9) | 130 (8.2) | 59 (3.7) | 24 (1.5) | 21 (1.3) | 30 (1.9) | 18 (1.1) |
| Liu Kui 38 | 30 Dec‐24 Jan | 9 tertiary hospitals, China | 137 | 57 (20‐83) b | 61 (44.5) | 13 (9.5) | 14 (10.2) | 10 (7.3) | 2 (1.5) | — | — | 2 (1.5) |
| Wan 39 | 23 Jan‐08 Feb | Chongqing University Three Gorges Hospital | 135 | 47 (36‐55) a | 72 (53.3) | 13 (9.6) | 12 (8.9) | 7 (5.2) | 1 (0.7) | — | — | 4 (3.0) |
| Wang D 40 | 01 Jan‐03 Feb | Zhongnan Hospital, Wuhan, China | 138 | 56 (42‐68) a | 75 (54.3) | 43 (31.2) | 14 (10.1) | 20 (14.5) | 4 (2.9) | 4 (2.9) | 7 (5.1) | 10 (7.2) |
| Wang Z 41 | 16 Jan‐29 Jan | Union Hospital, Wuhan, China | 69 | 42 (35‐62) a | 32 (46.4) | 9 (13.0) | 7 (10.1) | 8 (11.6) | 4 (5.8) | — | — | 4 (5.8) |
| Wu 43 | 25 Dec‐26 Jan | Jinyintan Hospital, Wuhan, China | 201 | 51 (43‐60) a | 128 (63.7) | 39 (19.4) | 22 (10.9) | 8 (4.0) | 5 (2.5) | 2 (1.0) | — | 1 (0.5) |
| Zhang 44 | 16 Jan‐03 Feb | Seventh Hospital, Wuhan City, China | 140 | 57 (25‐87) b | 71 (50.7) | 42 (30.0) | 17 (12.1) | 7 (5.0) | 2 (1.4) | 2 (1.4) | 3 (2.1) |
Abbreviations: Values are n (%) unless otherwise stated.
median (IQR).
median (range).
N reporting co‐morbidities.
The majority of studies (n = 16) were based in China, one was from the USA, and one was from Italy. Seventeen studies were based on inpatients, while one study used data from an infectious diseases registry. 30 Study size ranged from 41 participants up to 7162. For the study based on registry data, only the subsample with information on the presence or absence of co‐morbidities was included. 30 The proportion of males in studies varied from 44% to 82%, with most studies including more males than females. Age varied from a median of 47 to 63 years of age, with the oldest median age reported in the study conducted in Italy. 32 All studies were carried out from late 2019 to early 2020 (Table 1), and scored at least 7 on the NOS risk of bias scale (rated low risk of bias), with the majority scoring 8 (Table S2).
3.2. Meta‐analysis
The meta‐analyses of co‐morbidities in COVID‐19 patients found that an estimated 22.9% (95% CI 15.8 to 29.9) had hypertension, 11.5% (9.7 to 13.4) diabetes, 9.7% (6.8 to 12.6) CVD, 3.1% (1.0 to 5.2) COPD, 2.4% (1.5 to 3.2) CKD, 3.0% (1.8 to 4.2) cerebrovascular disease, and 3.9% (2.5 to 5.4) had cancer. All of the meta‐analyses were based on a minimum of seven studies and between‐study heterogeneity varied from moderate to high (a summary of the results of the meta‐analyses is given in Table 2, with full forest plots provided in Figure S4). The meta‐analyses showed that patients with hypertension (RR 1.66 [95% CI 1.32 to 2.09]), diabetes (2.11 [1.40 to 3.19]), CVD (2.55 [1.85 to 3.51]), COPD (2.62 [2.31 to 2.97]), CKD (3.86 [2.32 to 6.40]) and cancer (2.48 [1.46 to 4.19]) were all significantly associated with a higher risk of severe COVID‐19 compared with patients without co‐morbidities (Figure 2, Table 2). Cerebrovascular disease was the only co‐morbidity assessed that was not significantly associated with severe COVID‐19 (RR 1.73 [95% CI 0.74 to 4.05]), but as only one study reported these data, this result may be attributable to a lack of evidence rather than to no true association, and therefore further research is required (Figure 2, Table 2).
TABLE 2.
Summary of meta‐analyses results for prevalance of co‐morbidities, and increased risk of mortality and severity of disease by co‐morbidities, in COVID‐19 patients
| Co‐morbidities | N studies | Pooled effect size (95% CI), P‐value | I2 (%), P‐value | Egger's (P‐value) |
|---|---|---|---|---|
| Estimated pooled prevalences (%) of co‐morbidities in COVID‐19 patients | ||||
| Hypertension | 13 | 22.9 (15.8, 29.9), <.001 | 97.3, <.001 | .524 |
| Diabetes | 14 | 11.5 (9.7, 13.4), <.001 | 81.2, <.001 | .573 |
| CVD | 14 | 9.7 (6.8, 12.6), <.001 | 96.6, <.001 | .724 |
| COPD | 13 | 3.1 (1.0, 5.2), <.004 | 97.4, <.001 | .018* |
| CKD | 10 | 2.4 (1.5, 3.2), <.001 | 81.8, <.001 | .996 |
| Cerebrovascular disease | 7 | 3.0 (1.8, 4.2), <.001 | 56.3, .033 | .114 |
| Cancer | 13 | 3.9 (2.5, 5.4), <.001 | 88.2, .001 | .400 |
| Estimated pooled RR of suffering severe COVID‐19 if you have a co‐morbidity compared with if you do not | ||||
| Hypertension | 6 | 1.66 (1.32, 2.09), <.001 | 30.9, .204 | .819 |
| Diabetes | 7 | 2.11 (1.40, 3.19), <.001 | 84.6, .001 | .030* |
| CVD | 7 | 2.55 (1.85, 3.51), <.001 | 72.5, .001 | .031* |
| COPD | 6 | 2.62 (2.31, 2.97), <.001 | 0.0, .830 | .015* |
| CKD | 2 | 3.86 (2.32, 6.40), <.001 | 38.5, .202 | — |
| Cerebrovascular disease | 1 | 1.73 (0.74, 4.05), .208 | — | — |
| Cancer | 2 | 2.48 (1.46, 4.19), .001 | 0.0, .544 | — |
| Estimated pooled RR of mortality from COVID‐19 if you have a co‐morbidity compared with if you do not | ||||
| Hypertension | 3 | 1.53 (0.86, 2.71), .151 | 92.2, .001 | .251 |
| Diabetes | 2 | 1.83 (0.89, 3.73), .100 | 81.9, .019 | — |
| CVD | 2 | 1.88 (1.41, 2.51), <.001 | 0.0, .478 | — |
| COPD | 1 | 1.53 (1.03, 2.28), .035 | — | — |
| CKD | 1 | 1.84 (1.03, 3.30), .040 | — | — |
| Cerebrovascular disease | 1 | 2.48 (2.14, 2.86), <.001 | — | — |
| Cancer | 1 | 1.77 (1.08, 2.88), .023 | — | — |
Where publication bias was significant, trim and fill analyses were carried out (details reported in the supporting information).
FIGURE 2.
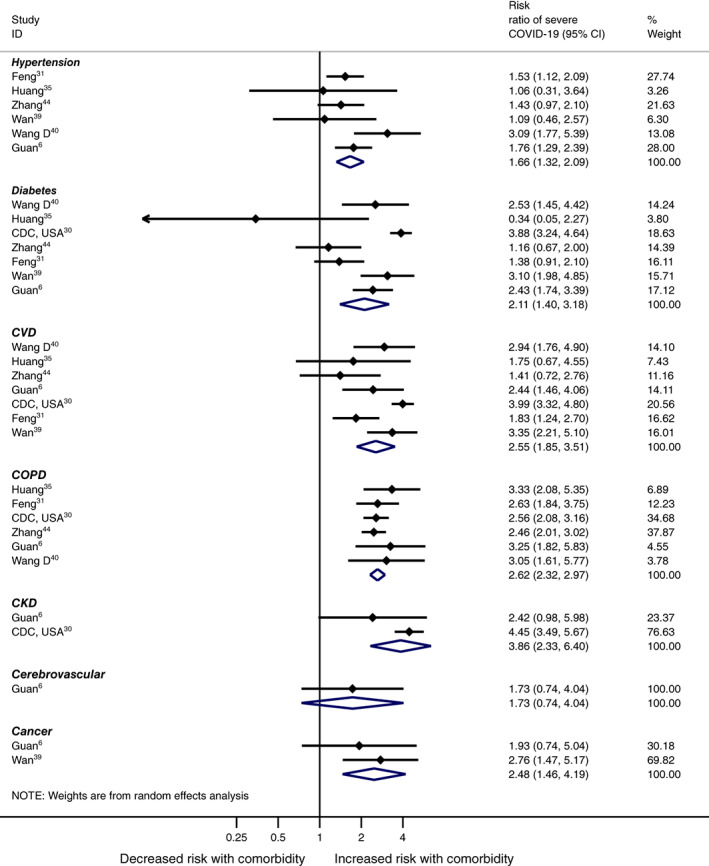
Meta‐analyses of severe COVID‐19 by co‐morbidity
Compared with individuals without co‐morbidities, the risk of death was significantly increased in those patients with CVD (RR 1.88 [95% CI 1.41 to 2.51]), COPD (1.53 [1.03 to 2.28]), CKD (1.84 [1.03 to 3.30]), cerebrovascular disease (2.48 [2.14 to 2.86]) and cancer (1.77 [1.08 to 2.88]) (Figure 3, Table 2).
FIGURE 3.
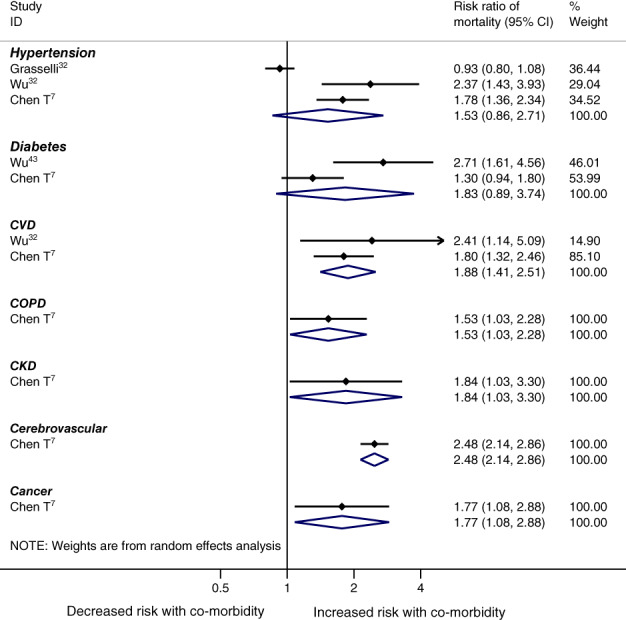
Meta‐analyses of mortality by co‐morbidity
Results from the meta‐regression analyses showed no statistically significant association between either mean study age or the proportion of males with estimated RRs for severity or mortality (Table S3). In addition, although the risk of publication bias was found to be significant in four of the meta‐analyses undertaken (Table 2; the funnel plots are provided in Figure S5), when trim and fill analyses were applied, no adjustments were made to the meta‐analyses (no study estimates were trimmed or filled), and the results remained unchanged (Table S4).
4. DISCUSSION
This systematic review and meta‐analysis showed that in patients with COVID‐19, hypertension, diabetes, CVD, COPD, CKD and cancer were associated with an increased risk of having severe COVID‐19, and CVD, COPD, CKD, cerebrovascular disease and cancer were also associated with an increased risk of mortality. These results are in line with other systematic reviews reporting that patients with severe COVID‐19 had increased odds of having a co‐morbidity. 10 To our knowledge, although two reviews have assessed the risk of severe COVID‐19 by co‐morbidities (found on preprint databases), this is the first systematic review to estimate the risk of mortality in COVID‐19 patients; this is also the first review to assess the increased risk of severe COVID‐19 in patients with CKD, cerebrovascular disease and cancer. We also estimated the prevalence of co‐morbidities in a COVID‐19 patient group, reporting similar results to previous studies. 9
This meta‐analysis included 18 studies and more than 14 000 patients. The methods used throughout were robust, with a comprehensive search strategy of multiple databases, and a minimum of two authors selecting studies and extracting data. Some limitations should be considered when interpreting this study. Because of local policies for testing COVID‐19, and the fact that some studies only included cases admitted to hospital, the cases selected for individual studies may not represent all of the regional infected population, especially for asymptomatic cases. Therefore, the true prevalence and marginal distributions of co‐morbidities among COVID‐19 patients remain unknown. The values of prevalence and relative risk reported in this review therefore need to be interpreted with caution, and may not reflect true population rates. A further limitation is that 16 of the 18 studies were from China, as this is where the outbreak began, which limits the generalizability of the results. In addition, although we removed studies which clearly had overlapping cohorts, in that they named the same hospital and time period, it was not possible to identify every possible overlap among all the studies. In particular, the large China‐wide study conducted by Guan et al 6 of laboratory‐confirmed COVID‐19 cases may have included individuals reported upon in other, smaller, hospital‐based studies carried out in China. However, by attempting to remove overlapping cohorts, the current review has gone further than previous systematic reviews, which have not addressed this issue and consequently have included all of the eligible published studies.
This review was also limited by the reporting of co‐morbidities in the included studies, in particular in the registry study, 30 from which only a proportion of participants could be included in the current meta‐analysis because of missing information on co‐morbidities. In addition, we did not have data on multi‐morbidities, with many of these chronic conditions co‐existing, which would have been a useful factor to assess. From this analysis, it is unclear whether the risk of severity of COVID‐19 or mortality are related to poor blood pressure or glucose control in individuals with co‐morbidities, but again these data were not available to assess this aspect fully. Recent reports have also highlighted possible ethnic differences, with black and minority ethnic groups being more affected by severe disease, but our review was mostly limited to studies carried out in China, where results were not reported by ethnicity, and thus we were unable to investigate this. 45 In addition, there has recently been speculation regarding the association of obesity with severe COVID‐19, after results from a single‐centre study of 124 patients, 46 although a recent report from the UK Intensive Care Audit contradicted these results and suggested that the BMI values of patients who were critically ill with COVID‐19 were similar to those of the general population. 45 Unfortunately, only one study in those included reported data on BMI, and therefore we could not investigate this relationship in our review. Finally, four of the meta‐analyses were statistically significant for publication bias after testing using Egger's test, although this test does display a high type 1 error rate, 17 and when trim and fill were undertaken no study estimates were removed or added. Those results from the meta‐analyses where publication bias was found to be significant should still be interpreted with caution.
Five recent meta‐analyses (two as yet only available on preprint websites) have assessed the prevalence of co‐morbidities in people with COVID‐19. 9 , 10 , 47 , 48 , 49 Three systematic reviews, with search dates finishing between the end of February and 5 March 2020, found similar results to those reported here, but with fewer studies. 9 , 10 , 49 Emami et al, 9 Li et al 49 and Yang et al 10 included 10, six and nine studies, respectively, and in COVID‐19 patients reported a prevalence of hypertension of 16%‐17.1%, diabetes 8%‐9.7%, and CVD 5%‐12%. These results are complementary to those reported here, which is unsurprising given that these reviews cover many of the same studies, although the results presented here are based on more data (from 13 or 14 studies), with greater care taken to remove those cohorts which overlap from the review. Jain and Yuan 48 identified seven studies (1813 COVID‐19 patients) for their systematic review, and showed that CVD, COPD and hypertension were associated with significantly increased odds of both severe disease and intensive care unit admission, but also found that diabetes was only borderline for a significant association with severity of COVID‐19 disease. Chen et al 47 pooled results from nine studies and reported a significant association between disease severity and hypertension (OR 2.3; 95% CI 1.76 to 3.00), diabetes (2.67; 1.91 to 3.74) and CHD (2.85; 1.68 to 4.84). The results complement those reported here, although this synthesis includes more studies and assesses more co‐morbidities as risk factors. This is the first review to show an association between CKD and cancer, and severe COVID‐19 disease, and to also show an association between CKD, cerebrovascular disease and cancer, and mortality from COVID‐19.
The results of this review should help in identifying those individuals most at risk of severe complications from COVID‐19, and hence it is useful for public health messaging on social distancing and self‐isolation. This review updates the evidence on the association between co‐morbidities and COVID‐19, and identifies additional groups which are vulnerable, including patients with CKD and cancer. In light of this evidence, policymakers should give clear guidance to those groups which are at an increased risk of severe COVID‐19. The results of this analysis should also help with targeting people for ongoing trials, and to inform policymakers as to which groups should be prioritized if a vaccine becomes available. The high mortality associated with COVID‐19 in these chronic conditions calls for an increased emphasis on future preventative therapies and vaccination programmes for these groups, in addition to traditional risk prevention.
In conclusion, this systematic review and meta‐analysis indicates that the presence of co‐morbidities such as diabetes, hypertension, CVD and COPD in individuals with COVID‐19 is associated with an approximately 2‐fold increased risk of developing severe symptoms and mortality.
CONFLICT OF INTEREST
All of the authors declare no competing interests or activities that could appear to have influenced the submitted work.
AUTHOR CONTRIBUTIONS
AKS, RS, AS, CLG and KK conceived the idea for the study; AKS, RS, AS, CLG and SS carried out the literature search, screened the studies, and undertook data extraction, and this was checked by YC. CLG and AKS carried out the statistical analysis. BC and YC carried out the risk of bias scoring. CLG, KK, FZ, SS and MJD interpreted the findings; CLG, AKS and KK drafted the manuscript, and CLG produced the figures. SS, FZ, BC, YC, KK, RS, AS and MJD critically reviewed the manuscript, and CLG, AKS and KK revised the manuscript for final submission. All authors approved the final draft of the manuscript. The corresponding author (KK) attests that all listed authors meet authorship criteria and that no others meeting the criteria have been omitted.
DATA SHARING
Data are available upon reasonable request. The technical appendix, statistical code and dataset are available from CLG.
Supporting information
Appendix S1: Supplementary Material
ACKNOWLEDGEMENTS
This report is the independent research of all its authors, with the UK‐based authors supported by the National Institute for Health Research Applied Research Collaboration–East Midlands (NIHR ARC‐EM). The views expressed are those of the authors and not necessarily those of the NIHR, NHS, or the Department of Health and Social Care.
Singh AK, Gillies CL, Singh R, et al. Prevalence of co‐morbidities and their association with mortality in patients with COVID‐19: A systematic review and meta‐analysis. Diabetes Obes Metab. 2020;22:1915–1924. 10.1111/dom.14124
Peer Review The peer review history for this article is available at https://publons.com/publon/10.1111/dom.14124.
AKS and CLG contributed equally to this paper.
Funding information National Institute for Health Research
REFERENCES
- 1. Wu F, Zhao S, Yu B, et al. A new coronavirus associated with human respiratory disease in China. Nature. 2020;579(7798):265‐269. [DOI] [PMC free article] [PubMed] [Google Scholar]
- 2. Worldometers . Coronavirus Update (Live). 2020. https://www.worldometers.info/coronavirus/. Accessed 4th May 2020.
- 3.The National Health Commission of China. New coronavirus pneumonia prevention and control program, 6th ed. (in Chinese). 2020. http://en.nhc.gov.cn/2020-03/29/c_78468.htm. Accessed May 1, 2020.
- 4. BBC News . ‘Window of Opportunity’ to Stop Coronavirus: @BBCNews. 2020. https://www.bbc.com/news/world-asia-china-51368873. Accessed 4th May 2020.
- 5. Sun K, Chen J, Viboud C. Early epidemiological analysis of the coronavirus disease 2019 outbreak based on crowdsourced data: a population‐level observational study. Lancet. 2020;2(4):PE201‐PE208. [DOI] [PMC free article] [PubMed] [Google Scholar]
- 6. Guan WJ, Liang WH, Zhao Y, et al. Comorbidity and its impact on 1590 patients with Covid‐19 in China: a Nationwide analysis. Eur Respir J. 2020;55:2000547. [DOI] [PMC free article] [PubMed] [Google Scholar]
- 7. Chen T, Wu D, Chen H, et al. Clinical characteristics of 113 deceased patients with coronavirus disease 2019: retrospective study. BMJ. 2020;368:m1091. [DOI] [PMC free article] [PubMed] [Google Scholar]
- 8. Adams JG, Walls RM. Supporting the health care workforce during the COVID‐19 global epidemic. JAMA. 2020;323:1439. [DOI] [PubMed] [Google Scholar]
- 9. Emami A, Javanmardi F, Pirbonyeh N, Akbari A. Prevalence of underlying diseases in hospitalized patients with COVID‐19: a systematic review and meta‐analysis. Arch Acad Emerg Med. 2020;8(1):e35. [PMC free article] [PubMed] [Google Scholar]
- 10. Yang J, Zheng Y, Gou X, et al. Prevalence of comorbidities in the novel Wuhan coronavirus (COVID‐19) infection: a systematic review and meta‐analysis. Int J Infect Dis. 2020;94:91‐95. [DOI] [PMC free article] [PubMed] [Google Scholar]
- 11. Liberati A, Altman DG, Tetzlaff J, et al. The PRISMA statement for reporting systematic reviews and meta‐analyses of studies that evaluate health care interventions: explanation and elaboration. PLoS Med. 2009;6(7):e1000100. [DOI] [PMC free article] [PubMed] [Google Scholar]
- 12. Stroup DF, Berlin JA, Morton SC, et al. Meta‐analysis of observational studies in epidemiology: a proposal for reporting. Meta‐analysis of observational studies in epidemiology (MOOSE) group. JAMA. 2000;283(15):2008‐2012. [DOI] [PubMed] [Google Scholar]
- 13.The World Health Organisation. https://www.who.int/emergencies/diseases/novel-coronavirus-2019/global-research-on-novel-coronavirus-2019-ncov. Accessed April 23, 2020.
- 14. Stang A. Critical evaluation of the Newcastle‐Ottawa scale for the assessment of the quality of nonrandomized studies in meta‐analyses. Eur J Epidemiol. 2010;25(9):603‐605. [DOI] [PubMed] [Google Scholar]
- 15. Higgins JP, Thomas J, Chandler J. Cochrane Handbook for Systematic Reviews of Interventions. London, England: Wiley; 2011.
- 16. Higgins JP, Thompson SG. Quantifying heterogeneity in a meta‐analysis. Stat Med. 2002;21(11):1539‐1558. [DOI] [PubMed] [Google Scholar]
- 17. Carpenter CJ. A trim and fill examination of the extent of publication bias in communication research. Commun Methods Meas. 2012;6(1):41‐55. [Google Scholar]
- 18. Bhatraju PK, Ghassemieh BJ, Nichols M, et al. Covid‐19 in critically ill patients in the Seattle region ‐ case series. N Engl J Med. 2020;382:2012‐2022. [DOI] [PMC free article] [PubMed] [Google Scholar]
- 19. Cao J, Tu WJ, Cheng W, et al. Clinical features and short‐term outcomes of 102 patients with Corona virus disease 2019 in Wuhan, China. Clin Infect Dis. 2020;2:2. [DOI] [PMC free article] [PubMed] [Google Scholar]
- 20. Chen N, Zhou M, Dong X, et al. Epidemiological and clinical characteristics of 99 cases of 2019 novel coronavirus pneumonia in Wuhan, China: a descriptive study. Lancet. 2020;395(10223):507‐513. [DOI] [PMC free article] [PubMed] [Google Scholar]
- 21. Deng Y, Liu W, Liu K, et al. Clinical characteristics of fatal and recovered cases of coronavirus disease 2019 (COVID‐19) in Wuhan, China: a retrospective study. Chin Med J. 2020;20:20. [DOI] [PMC free article] [PubMed] [Google Scholar]
- 22. Li X, Xu S, Yu M, et al. Risk factors for severity and mortality in adult COVID‐19 inpatients in Wuhan. J Allergy Clin Immunol. 2020;12:12. [DOI] [PMC free article] [PubMed] [Google Scholar]
- 23. McMichael TM, Currie DW, Clark S, et al. Epidemiology of Covid‐19 in a long‐term Care Facility in King County, Washington. N Engl J Med. 2020;382:2005‐2011. [DOI] [PMC free article] [PubMed] [Google Scholar]
- 24. Richardson S, Hirsch JS, Narasimhan M, et al. Presenting characteristics, comorbidities, and outcomes among 5700 patients hospitalized with COVID‐19 in the New York City area. JAMA. 2020;323:2052. [DOI] [PMC free article] [PubMed] [Google Scholar]
- 25. Yang X, Yu Y, Xu J, et al. Clinical course and outcomes of critically ill patients with SARS‐CoV‐2 pneumonia in Wuhan, China: a single‐centered, retrospective, observational study. Lancet Respir Med. 2020;8:475‐481. [DOI] [PMC free article] [PubMed] [Google Scholar]
- 26. Zhou F, Yu T, Du R, et al. Clinical course and risk factors for mortality of adult inpatients with COVID‐19 in Wuhan, China: a retrospective cohort study. Lancet. 2020;395(10229):1054‐1062. [DOI] [PMC free article] [PubMed] [Google Scholar]
- 27. Garg S, Kim L, Whitaker M, et al. Hospitalization rates and characteristics of patients hospitalized with laboratory‐confirmed coronavirus disease 2019 ‐ COVID‐NET, 14 states, March 1‐30, 2020. MMWR Morb Mortal Wkly Rep. 2020;69(15):458‐464. [DOI] [PMC free article] [PubMed] [Google Scholar]
- 28. Chen T, Dai Z, Mo P, et al. Clinical characteristics and outcomes of older patients with coronavirus disease 2019 (COVID‐19) in Wuhan, China (2019): a single‐centered, retrospective study. J Gerontol Ser A. 2020;11:11. [DOI] [PMC free article] [PubMed] [Google Scholar]
- 29. Cheng Y, Luo R, Wang K, et al. Kidney disease is associated with in‐hospital death of patients with COVID‐19. Kidney Int. 2020;20:20. [DOI] [PMC free article] [PubMed] [Google Scholar]
- 30. CDC COVID‐19 Response Team . Preliminary estimates of the prevalence of selected underlying health conditions among patients with coronavirus disease 2019 ‐ United States, February 12‐March 28, 2020. MMWR Morb Mortal Wkly Rep. 2020;3(13):382‐386. [DOI] [PMC free article] [PubMed] [Google Scholar]
- 31. Feng Y, Ling Y, Bai T, et al. COVID‐19 with different severity: a multi‐center study of clinical features. Am J Respir Crit Care Med. 2020;10:10. [DOI] [PMC free article] [PubMed] [Google Scholar]
- 32. Grasselli G, Zangrillo A, Zanella A, et al. Baseline characteristics and outcomes of 1591 patients infected with SARS‐CoV‐2 admitted to ICUs of the Lombardy region, Italy. JAMA. 2020;6:6. [DOI] [PMC free article] [PubMed] [Google Scholar]
- 33. Guo T, Fan Y, Chen M, et al. Cardiovascular implications of fatal outcomes of patients with coronavirus disease 2019 (COVID‐19). JAMA Cardiol. 2020. http://doi:10.1001/jamacardio.2020.1017. [DOI] [PMC free article] [PubMed] [Google Scholar]
- 34. Guo W, Li M, Dong Y, et al. Diabetes is a risk factor for the progression and prognosis of COVID‐19. Diabetes/Metabol Res Rev. 2020;e3319. 10.1002/dmrr.3319. [DOI] [PMC free article] [PubMed] [Google Scholar]
- 35. Huang C, Wang Y, Li X, et al. Clinical features of patients infected with 2019 novel coronavirus in Wuhan, China. Lancet. 2020;395(10223):497‐506. [DOI] [PMC free article] [PubMed] [Google Scholar]
- 36. Lian J, Jin X, Hao S, et al. Analysis of epidemiological and clinical features in older patients with Corona virus disease 2019 (COVID‐19) out of Wuhan. Clin Infect Dis. 2020;25:25. [DOI] [PMC free article] [PubMed] [Google Scholar]
- 37. Liang WH, Guan WJ, Li CC, et al. Clinical characteristics and outcomes of hospitalised patients with COVID‐19 treated in Hubei (epicenter) and outside Hubei (non‐epicenter): a Nationwide analysis of China. Eur Respir J. 2020;8:8. [DOI] [PMC free article] [PubMed] [Google Scholar]
- 38. Liu K, Fang YY, Deng Y, et al. Clinical characteristics of novel coronavirus cases in tertiary hospitals in Hubei Province. Chin Med J. 2020;133(9):1025–1031. [DOI] [PMC free article] [PubMed] [Google Scholar]
- 39. Wan S, Xiang Y, Fang W, et al. Clinical features and treatment of COVID‐19 patients in Northeast Chongqing. J Med Virol. 2020;21:21. [DOI] [PMC free article] [PubMed] [Google Scholar]
- 40. Wang D, Hu B, Hu C, et al. Clinical characteristics of 138 hospitalized patients with 2019 novel coronavirus‐infected pneumonia in Wuhan, China. JAMA. 2020;323:1061. [DOI] [PMC free article] [PubMed] [Google Scholar]
- 41. Wang Z, Yang B, Li Q, Wen L, Zhang R. Clinical features of 69 cases with coronavirus disease 2019 in Wuhan, China. Clin Infect Dis. 2020;16:16. [DOI] [PMC free article] [PubMed] [Google Scholar]
- 42. Guan WJ, Ni ZY, Hu Y, et al. Clinical characteristics of coronavirus disease 2019 in China. N Engl J Med. 2020;382:1708‐1720. [DOI] [PMC free article] [PubMed] [Google Scholar]
- 43. Wu C, Chen X, Cai Y, et al. Risk factors associated with acute respiratory distress syndrome and death in patients with coronavirus disease 2019 pneumonia in Wuhan, China. JAMA Intern Med. 2020. https://doi:10.1001/jamainternmed.2020.0994. [DOI] [PMC free article] [PubMed] [Google Scholar]
- 44. Zhang JJ, Dong X, Cao YY, et al. Clinical characteristics of 140 patients infected with SARS‐CoV‐2 in Wuhan, China. Allergy. 2020. 10.1111/all.14238. [DOI] [PubMed] [Google Scholar]
- 45.ICNARC. https://www.icnarc.org/About/Latest-News/2020/04/04/Report-On-2249-Patients-Critically-Ill-With-Covid-19. Accessed April 9, 2020.
- 46. Simonnet A, Chetboun M, Poissy J, et al. High prevalence of obesity in severe acute respiratory syndrome coronavirus‐2 (SARS‐CoV‐2) requiring invasive mechanical ventilation. Obesity. 2020.28(7):1195–1199. [DOI] [PMC free article] [PubMed] [Google Scholar]
- 47. Chen YM, Gong X, Wang L, Guo J. Effects of hypertension, diabetes and coronary heart disease on COVID‐19 diseases severity: a systematic review and meta‐analysis. medRxiv. 2020. https://www.medrxiv.org/content/10.1101/2020.03.25.20043133v1. [Google Scholar]
- 48. Jain V, Yuan JM. Predictive symptoms and comorbidities for severe COVID‐19 and intensive care unit admission: a systematic review and meta‐analysis. Int J Public Health 2020.1–14. [DOI] [PMC free article] [PubMed] [Google Scholar]
- 49. Li B, Yang J, Zhao F, et al. Prevalence and impact of cardiovascular metabolic diseases on COVID‐19 in China. Clin Res Cardiol. 2020;109:531‐538. [DOI] [PMC free article] [PubMed] [Google Scholar]
- 50.Wells, G. A, Shea, B., O'Connel, D. et al. The Newcastle‐Ottawa scale (NOS) for assessing the quailty of nonrandomised studies in meta‐analyses. http://www.ohrica/programs/clinical_epidemiology/oxford htm 2009 Feb 1
Associated Data
This section collects any data citations, data availability statements, or supplementary materials included in this article.
Supplementary Materials
Appendix S1: Supplementary Material