Abstract
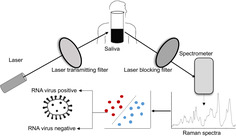
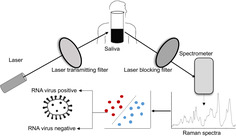
Several non‐invasive Raman spectroscopy‐based assays have been reported for rapid and sensitive detection of pathogens. We developed a novel statistical model for the detection of RNA viruses in saliva, based on an unbiased selection of a set of 65 Raman spectral features that mostly attribute to the RNA moieties, with a prediction accuracy of 91.6% (92.5% sensitivity and 88.8% specificity). Furthermore, to minimize variability and automate the downstream analysis of the Raman spectra, we developed a GUI‐based analytical tool “RNA Virus Detector (RVD).” This conceptual framework to detect RNA viruses in saliva could form the basis for field application of Raman Spectroscopy in managing viral outbreaks, such as the ongoing COVID‐19 pandemic. (http://www.actrec.gov.in/pi-webpages/AmitDutt/RVD/RVD.html).
Keywords: GUI‐based automated computational analysis, linear discriminant analysis, principal component analysis, Raman spectroscopy, RNA virus
Non‐invasive low‐cost diagnostic tests capable of detecting pathogens at the point of care could play a significant role in early diagnosis. We present a proof of concept using Raman spectroscopy to detect a distinct RNA viral signature in human saliva, with potential for application to the COVID‐19 pandemic.

1. INTRODUCTION
Early identification of SARS‐CoV‐2 in infected patients is central to controlling COVID‐19 pandemic with no available treatment option or vaccine [1]. The current trend for prescribing diagnostic assays for those expressing salient symptoms of the disease may be suboptimal in impeding the transmission rate [2, 3]. Raman spectroscopy, based on the principle of inelastic scattering of light [4], is known to detect HIV, dengue, and various biomarkers and could potentially address practical concerns related to mass testing as a point‐of‐care device [5, 6, 7, 8]. A recent study described a comparable sensitivity of SARS‐CoV‐2 detection in the saliva of an asymptomatic COVID‐19 patient [9], consistent with an accelerated emergency use authorization approval to a saliva‐based diagnostic kit by the US FDA [10]. Saliva, thus, offers an attractive, quick, non‐invasive alternative to nasopharyngeal swabs for SARS‐CoV‐2 detection.
2. EXPERIMENTAL
We set to record Raman spectra to identify the presence of RNA virions, generated using pLL 3.7 lentivirus vector system (based on HIV‐1), with 7.05 × 10⁷ TU/mL stock titer spiked in water and human saliva at 1:10 and 1:1000 dilutions. The infectivity of the viral particles was simultaneously confirmed by the observation of GFP expression in HEK293FT cells (Figure S1). Reported spectral data from saliva of individuals not known to have viral infection was used as a negative control [11].
3. RESULTS AND DISCUSSION
A set of 15 spectra were recorded from each sample, generating a total of 201 spectra, including 131 from viral negative samples, 54 from viral positive samples spiked with lentiviral RNA particles and 16 viral positive samples with enzymatic treatments (Table S1). Pre‐processed spectra post‐base‐line correction and area normalization interpolated in 600 to 1800 cm−1 region were used as inputs for downstream analysis. Principal component analysis (PCA) of all spectra revealed homogenous clustering of the two groups, with PC1 and PC2 accounting for 76.6% variance of the total sample set (Figure S2). Next, an unbiased prediction model was generated using linear discriminant analysis (LDA) based on spectral features with an SD of greater than 0.404 (marking the top quantile—308 features of 1200), and samples divided into training (n = 149) and test (n = 36) sets, showed a prediction accuracy of 88%.
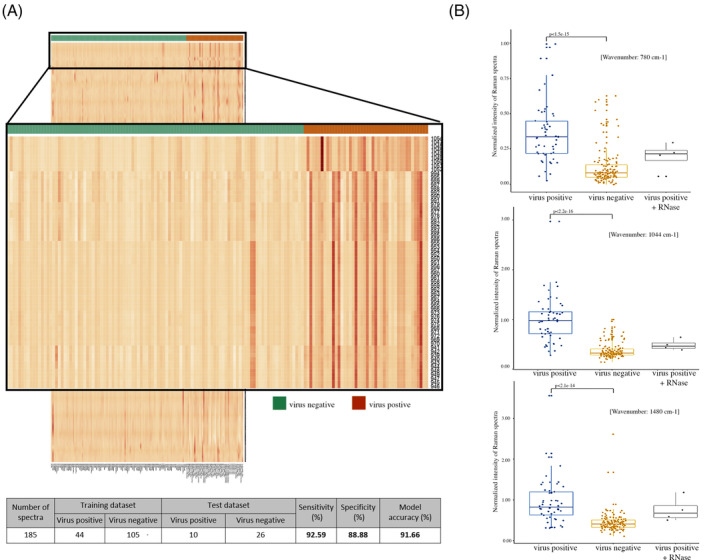
To obtain optimal number of features and refine the model, we used varying number top features from the principal components (PC1 and PC2) to build the model and computed prediction accuracy for each of them. Top 10, 25, 50, 75 and 100 features were iteratively used to build the model, wherein we observed that the model based on top 50 features from PC1 and PC2 (unique 65), achieved the highest accuracy (Figure S3). These 65 features (within the range of 939‐1054 cm−1) were adequate to effectively discern the viral positive and negative samples, as represented in the form of heatmap, increasing the model prediction accuracy to 91.6% (92.5% sensitivity and 88.8% specificity) (Figure 1A and Figure S2), which may be subject to a minor variability due to saliva‐specific spectral interferences.
FIGURE 1.

A Raman spectroscopy‐based model to detect RNA viruses. A, Heatmap representation of the 1200 features from the virus positive and negative training sample set of Raman spectra with the zoomed‐out version showing the peak intensities for the features selected (n = 65) for model construction. The table shows the overall sample statistics and summary of the performance of the 65‐feature linear discriminant analysis‐based model for prediction of viral presence in the human saliva samples. B, Comparison of Raman spectra peaks between virus positive, virus negative and RNase‐treated viral positive sample for RNA‐specific constituents: the nitrogenous uracil base, ribose‐phosphate and A/G ring at 780, 1044 and 1480 cm−1, respectively by Wilcoxon rank‐sum test
Intriguingly, a majority of bands in this range are attributable to RNA moieties, especially the ribose sugars in the 900‐1045 cm−1 range with a distinct peak at 1045 cm−1 and the phosphate group in 1080 to 1100 cm−1 range [12, 13]. Of note, biomolecules, such as DNA, RNA, proteins, lipids, from intact viruses are known to display unique Raman spectra vibrations based on their structural heterogeneity [14]. Thus, to ask if individual RNA moieties could determine the presence of RNA viruses, we performed an unbiased statistical analysis using Wilcoxon rank‐sum test for RNA specific constituent, such as for the nitrogenous uracil base, ribose‐phosphate and A/G ring at 780, 1044 and 1480 cm−1, respectively [12, 13]. Interestingly, all the RNA specific distinct peaks could.
individually discern the viral positive and negative samples with high statistical confidence that was significantly reduced following RNase treatment (Figure 1B), but not with DNase or Proteinase treatment of the viral positive samples (Figure S4). Taken together, these results suggest a novel concept of using 65‐feature spectra (majorly attributable to RNA moieties) obtained from intact virion to form the basis for the detection of RNA viruses in human sputum.
To minimize variability and automate the downstream 65‐feature‐based analysis of the Raman spectra we further developed a GUI‐based analytical tool RNA Virus Detector, RVD (http://www.actrec.gov.in/pi-webpages/AmitDutt/RVD/RVD.html), an in silico automated tool to detect RNA virus from an individual or a group of samples in an unambiguous and reproducible manner using the raw SPC files recorded by Raman spectrometer as an input for analysis, with minimal requirement of third‐party tools. The RVD accuracy based on the statistical model developed, however, may be limited by the spectral acquisition conditions such as excitation wavelength the laser power and the spectrograph employed, that may necessitate further improvisation for universal application.
4. MATERIALS AND METHODS
4.1. Sample collection
One sample of approximately 1 mL of unstimulated saliva of the principal investigator of this study was collected in sterile micro centrifuge to be used as a medium for studying the viral spectra spiked in the saliva for this study. The tube and was immediately refrigerated at 4°C. The samples were then transferred to −20°C till further use.
4.2. Transfection
1 × 10⁶ HEK293FT cells were seeded per well on a 6‐well plate. The following day, transfection of GFP‐tagged lentiviral vector, pLL3.7 along with the packaging plasmids pPAX and pVSVG in 2:1:0.5 ratio using lipofectamine 3000 was performed according to manufacturer's instructions. The viral supernatant was collected 48‐ and 72‐hours post‐transfection, filtered using 0.45‐μ filter and subjected to ultracentrifugation at 30 000 rpm for 90 minutes at 4°C. The pellet was resuspended in 1 mL serum‐free Dulbecco's Modified Eagle's medium (DMEM) media [15].
4.3. Transduction
1.5 × 10⁶ HEK293FT cells were seeded in 60 mm tissue culture petri‐dish. The next day, transduction of the viral particles were performed using two dilutions (1:10; 1:1000) in plain DMEM using 8 μg/mL polybrene in HEK293FT cells. GFP‐positive cells were observed 48 hours post‐transduction [15].
4.4. Sample preparation for Raman spectroscopy
Concentrate viral particle stock of 7.05 × 10⁷ TU/mL were diluted in 1:10 and 1:1000 ratios using two different diluents‐ sterile ultrapure water and human saliva to mimic the patient condition. Plain media in ultrapure water and saliva without viral particles were taken as negative controls. Besides, to check the specific biomolecule (DNA, RNA or proteins) which help in differentiation of viral particles, the samples were treated with either DNase or RNase or Proteinase K, respectively.
4.5. Raman spectroscopy
Viral samples were subjected to Raman Spectroscopy by loading 20 μL on calcium fluoride (CaF2) window. Raman spectra were recorded using a WITec Raman alpha300R (WITec, GmbH, Germany) confocal microscope. In the 500 to 3800 cm−1 range, Raman spectra (ex 532 nm, 8 mW, 100X Zeiss 1.46 NA) were acquired using 50 μm fiber and directed to a 300 mm spectrograph equipped with 600 g/mm grating and thermo‐cooled CCD. Spectra were integrated for 10 seconds and averaged over 10 accumulations. On average, 15 spectra were recorded from each sample at a constant temperature of 20°C. Pre‐processed spectra, that is, base‐line corrected, area normalized and interpolated in 600 to 1800 cm−1 region were used as inputs for further data analysis [6, 16].
4.6. Spectra analysis, virus prediction model and tool development
Raman spectroscopy files (SPC) were converted to the CSV format using SPC python package (https://github.com/rohanisaac/spc), data normalization and statistical analysis were performed in the R programming environment (https://www.r-project.org/). Data pre‐processing and linear discriminant analysis was performed using the caret (https://topepo.github.io/caret/) and MASS (https://cran.r-project.org/web/packages/MASS/) package, respectively. Caret package was also used to perform k‐fold cross‐validation to check for the effect of data‐splitting on model prediction accuracy. Mean accuracy over 10‐folds, was found to be 93% (min: 84.21%, max: 100%, median: 94.59%, Kappa statistic 0.847). RVD was developed in python and R, and python Tkinter (https://docs.python.org/3/library/tkinter.html) library was used for development of the GUI.
5. CONCLUSION
We describe a string proof of concept method using Raman spectroscopy to detect the RNA viruses in saliva with a detection sensitivity of 7.05 × 10⁷ TU/mL viral particles. This provides the essential framework for field application of Raman Spectroscopy‐based RVD in monitoring and responding to the COVID‐19 pandemic, wherein 106–1011 viral RNA copies/mL of saliva is reported [17, 18]. The positive tests could be validated by follow‐up testing with molecular biology laboratory‐based diagnosis to confirm the status of SARS‐CoV‐2, while epidemiological containment measures are implemented for the individual.
CONFLICT OF INTEREST
The authors declare no financial or commercial conflict of interest.
AUTHOR CONTRIBUTIONS
Sanket Desai, Saket V. Mishra, Asim Joshi, Murali K. Chilakapati and Amit Dutt designed research. Sanket Desai, Saket V. Mishra, Asim Joshi and Arti Hole performed research. Shilpee Dutt, Saket V. Mishra, Asim Joshi, Murali K. Chilakapati, Shilpee Dutt, Sudeep Gupta and Amit Dutt analyzed data. Sanket Desai developed the RVD. Rohit Mishra developed the GUI. Shilpee Dutt, Debashmita Sarkar and Amit Dutt wrote the paper.
Supporting information
Figure S1 Infection competent viral particles show distinct spectra in saliva. A, Representative microscopy images of GFP‐positive HEK293FT cells transduced with pLL3.7 viral particles in 1:10 and 1:1000 dilutions under ×10 objective. B, Representative Raman spectra of saliva spiked with viral particles in 1:10 and 1:1000 dilutions
Figure S2 Principal component analysis‐based clustering of the samples. A, Principal component analysis plot based on the overall spectra in the 600–1800 cm−1 fingerprint region of virus‐positive and virus‐negative samples, wherein PC1 and PC2 explained 76.6%variance of the total sample set. B, Plot showing correlation of PC1 and PC2 with the selected 65 features used in model development. All the features positively correlate with the PC2 whereas, 56 features show a positive correlation with PC1 and rest are negatively correlated
Figure S3 Line plot depicting the prediction accuracy for models build from selection of number of features from PC1 and PC2.
Figure S4 Aligned Raman spectral of saliva spiked with 1:10 diluted intact viral particles in presence of RNase, DNase and Proteinase K is shown. The three RNA‐specific spectra intensity at 780, 1044 and 1480 cm −1 (marked by parallel vertical dotted lines) are significantly perturbed following RNase treatment, but not with DNase or Proteinase K treatment
Table S1 Statistical details of the samples used in the study along with their respective number of spectra
ACKNOWLEDGMENTS
Authors thank all members of the Dutt laboratory for critically reviewing the manuscript.
Desai S, Mishra SV, Joshi A, et al. Raman spectroscopy‐based detection of RNA viruses in saliva: A preliminary report. J. Biophotonics. 2020;13:e202000189. 10.1002/jbio.202000189
Sanket Desai, Saket V. Mishra and Asim Joshi contributed equally to this study.
REFERENCES
- 1. Features, Evaluation and Treatment Coronavirus (COVID‐19)—Mar20, 2020 StatPearls—NCBI Bookshelf.pdf.
- 2. Udugama B., Kadhiresan P., Kozlowski H. N., Malekjahani A., Osborne M., Li V. Y. C., Chen H., Mubareka S., Gubbay J. B., Chan W. C. W., ACS Nano 2020, 14, 3822. [DOI] [PubMed] [Google Scholar]
- 3. Yang T., Yung‐Chih W., Ching‐Fen S., Chao‐Min C., Diagnostics (Basel) 2020, 10(3), 165. [Google Scholar]
- 4. Raman C. V., Krishnan K. S., Nature 1928, 121(3048), 501. [Google Scholar]
- 5. Ryzhikova E., Kazakov O., Halamkova L., Celmins D., Malone P., Molho E., Zimmerman E. A., Lednev I. K., J. Biophotonics 2015, 8(7), 584. [DOI] [PMC free article] [PubMed] [Google Scholar]
- 6. Sahu A., Dalal K., Naglot S., Aggarwal P., Murali Krishna C., PLoS One 2013, 8(11), e78921. [DOI] [PMC free article] [PubMed] [Google Scholar]
- 7. Rehman A., Anwar S., Firdous S., Ahmed M., Rasheed R., Nawaz M., Laser Physics 2012, 22(6), 1085. [Google Scholar]
- 8. Farkas D. L. et al., Study of virus by Raman spectroscopy. in Imaging, Manipulation, and Analysis of Biomolecules, Cells, and Tissues XI, SPIE BIOS, San Francisco, CA 2013. [Google Scholar]
- 9. Wyllie A. L. et al., medRxiv 2020, 2020.04.16.20067835. [Google Scholar]
- 10. Administration., U.S.F.D , Rutgers Clin Genom Laborat 2020, 1. https://www.fda.gov/media/136875/download. [Google Scholar]
- 11. Gunjan Tyagi, A.D. , Deshpande Raviraj, Gota Vikram, Murali Krishna Chilakapati. Saliva Raman Spectroscopy: Explorations Of Sampling Methods. in 18th European Conference on the Spectroscopy of Biological Molecules. 2019. Dublin, Ireland: ECSBM18. [Google Scholar]
- 12. Gong B., Chen J. H., Yajima R., Chen Y., Chase E., Chadalavada D. M., Golden B. L., Carey P. R., Bevilacqua P. C., Methods 2009, 49(2), 101. [DOI] [PMC free article] [PubMed] [Google Scholar]
- 13. De Gelder J., De Gussem K., Vandenabeele P., Moens L., J Raman Spectroscopy 2007, 38(9), 1133. [Google Scholar]
- 14. Ruokola P., Dadu E., Kazmertsuk A., Hakkanen H., Marjomaki V., Ihalainen J. A., J. Virol. 2014, 88(15), 8504. [DOI] [PMC free article] [PubMed] [Google Scholar]
- 15. Iyer P., Shrikhande S. V., Ranjan M., Joshi A., Gardi N., Prasad R., Dharavath B., Thorat R., Salunkhe S., Sahoo B., Chandrani P., Kore H., Mohanty B., Chaudhari V., Choughule A., Kawle D., Chaudhari P., Ingle A., Banavali S., Gera P., Ramadwar M. R., Prabhash K., Barreto S. G., Dutt S., Dutt A., Int. J. Cancer 2019, 144(8), 2008. [DOI] [PMC free article] [PubMed] [Google Scholar]
- 16. Patel S. K., Rajora N., Kumar S., Sahu A., Kochar S. K., Krishna C. M., Srivastava S., Anal. Chem. 2019, 91(11), 7054. [DOI] [PubMed] [Google Scholar]
- 17. Pan Y., Zhang D., Yang P., Poon L. L. M., Wang Q., Lancet Infect. Dis. 2020, 20(4), 411. [DOI] [PMC free article] [PubMed] [Google Scholar]
- 18. Bar‐On Y. M. et al., eLife 2020, 9, e57309.32228860 [Google Scholar]
Associated Data
This section collects any data citations, data availability statements, or supplementary materials included in this article.
Supplementary Materials
Figure S1 Infection competent viral particles show distinct spectra in saliva. A, Representative microscopy images of GFP‐positive HEK293FT cells transduced with pLL3.7 viral particles in 1:10 and 1:1000 dilutions under ×10 objective. B, Representative Raman spectra of saliva spiked with viral particles in 1:10 and 1:1000 dilutions
Figure S2 Principal component analysis‐based clustering of the samples. A, Principal component analysis plot based on the overall spectra in the 600–1800 cm−1 fingerprint region of virus‐positive and virus‐negative samples, wherein PC1 and PC2 explained 76.6%variance of the total sample set. B, Plot showing correlation of PC1 and PC2 with the selected 65 features used in model development. All the features positively correlate with the PC2 whereas, 56 features show a positive correlation with PC1 and rest are negatively correlated
Figure S3 Line plot depicting the prediction accuracy for models build from selection of number of features from PC1 and PC2.
Figure S4 Aligned Raman spectral of saliva spiked with 1:10 diluted intact viral particles in presence of RNase, DNase and Proteinase K is shown. The three RNA‐specific spectra intensity at 780, 1044 and 1480 cm −1 (marked by parallel vertical dotted lines) are significantly perturbed following RNase treatment, but not with DNase or Proteinase K treatment
Table S1 Statistical details of the samples used in the study along with their respective number of spectra


