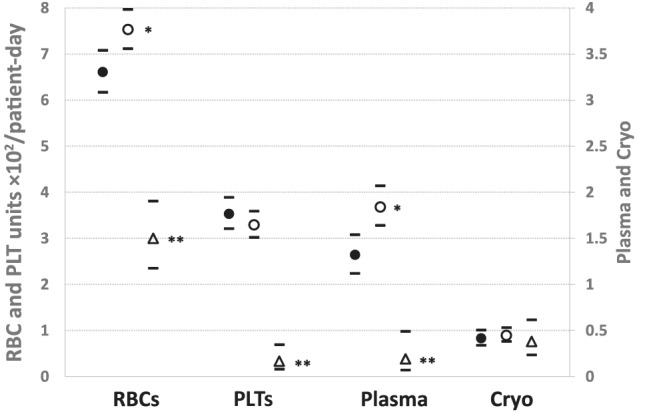
FIGURE 1.

Inpatient transfusion rates before and after COVID‐19. *p < 0.01 versus pre–COVID‐19 period. **p < 0.0001 versus all wards before COVID‐19 and non–COVID‐19 wards during COVID‐19. Bars: 95% CIs. Transfusion rates: units × 102/patient‐day. •, All inpatient wards before COVID‐19: 2‐week baseline period before COVID‐19 wards opened. ○, Non–COVID‐19 wards during COVID‐19 period. Δ, COVID‐19 wards: 4‐week period after COVID‐19 wards opened
