

Abstract
There is limited information on severe acute respiratory syndrome coronavirus 2 (SARS‐CoV‐2) T‐cell immune responses in patients with coronavirus disease 2019 (COVID‐19). Both CD4+ and CD8+ T cells may be instrumental in resolution of and protection from SARS‐CoV‐2 infection. Here, we tested 25 hospitalized patients either with microbiologically documented COVID‐19 (n = 19) or highly suspected of having the disease (n = 6) for presence of SARS‐CoV‐2‐reactive CD69+ expressing interferon‐γ (IFN‐γ) producing CD8+ T cells using flow‐cytometry for intracellular cytokine staining assay. Two sets of overlapping peptides encompassing the SARS‐CoV‐2 Spike glycoprotein N‐terminal 1 to 643 amino acid sequence and the entire sequence of SARS‐CoV‐2 M protein were used simultaneously as antigenic stimulus. Ten patients (40%) had detectable responses, displaying frequencies ranging from 0.15 to 2.7% (median of 0.57 cells/µL; range, 0.43‐9.98 cells/µL). The detection rate of SARS‐CoV‐2‐reactive IFN‐γ CD8+ T cells in patients admitted to intensive care was comparable (P = .28) to the rate in patients hospitalized in other medical wards. No correlation was found between SARS‐CoV‐2‐reactive IFN‐γ CD8+ T‐cell counts and SARS‐CoV‐2 S‐specific antibody levels. Likewise, no correlation was observed between either SARS‐CoV‐2‐reactive IFN‐γ CD8+ T cells or S‐specific immunoglobulin G‐antibody titers and blood cell count or levels of inflammatory biomarkers. In summary, in this descriptive, preliminary study we showed that SARS‐CoV‐2‐reactive IFN‐γ CD8+ T cells can be detected in a non‐negligible percentage of patients with moderate to severe forms of COVID‐19. Further studies are warranted to determine whether quantitation of these T‐cell subsets may provide prognostic information on the clinical course of COVID‐19.
Keywords: CD8+ T cells, COVID‐19, SARS‐CoV‐2, T‐cell immunity
Highlights
SARS‐CoV‐2 specific CD8+ T cells can be detected in 40% of COVID‐19 patients.
No correlation was found between SARS‐CoV‐2‐reactive IFN‐γ CD8+ T‐cell countsand SARS‐CoV‐2 S‐specific antibody levels.
No correlation was observed between SARS‐CoV‐2‐reactive IFN‐γ CD8+ T cells and levels of inflammatory biomarkers.
1. INTRODUCTION
On 11 March 2020 the World Health Organization declared coronavirus disease 2019 (COVID‐19) a pandemic. 1 As of June 19 more than 8 500 000 cases of COVID‐19 have been reported worldwide, causing over 454 000 deaths. 2 COVID‐19 commonly results in pneumonia, which can evolve to into acute respiratory distress syndrome, leading to respiratory or multiorgan failure. 3 , 4 Elucidation of immune responses conferring protection against severe acute respiratory syndrome coronavirus 2 (SARS‐CoV‐2) is crucial to develop an effective vaccine prototype, which is urgently needed to blunt the progression of the pandemic. A number of studies have focused on characterizing SARS‐CoV‐2‐specific antibody kinetic profiles. 5 , 6 , 7 , 8 , 9 , 10 Nevertheless, there is scant information on T‐cell responses against SARS‐CoV‐2 in patients with COVID‐19. CD4+ and CD8+ T cells targeting structural viral proteins appear to confer broad and long‐lasting protection against SARS‐CoV. 11 Several clusters of cytotoxic T lymphocyte (CTL) epitopes restricted by HLA‐class I specificities commonly found in Caucasians (ie, HLA‐A02) have been mapped within the spike (S) and the membrane (M) of SARS‐CoV proteins. 11 Since SARS‐CoV shares high sequence identity with SARS‐CoV‐2, 12 it is reasonable to expect an analogous scenario in the SARS‐CoV‐2 infection. There is limited information on the features of T‐cell responses against SARS‐CoV‐2; several studies demonstrated the presence of SARS‐CoV‐2 ‐reactive T cells in a large number of patients with COVID‐19 and also in unexposed inidviduals, although the potential functionality of these cells was not comprehensively investigated. 13 , 14 , 15 Here, we developed a flow cytometry for intracellular cytokine staining (ICS) assay to enumerate peripheral blood SARS‐CoV‐2‐reactive interferon γ (IFN‐γ)‐producing CD8+ T cells, which was used to assess virus‐elicited T‐cell immunity in patients with moderate to severe COVID‐19.
2. PATIENTS AND METHODS
2.1. Patients
Twenty‐five nonconsecutive patients (14 male and 11 female; median age, 69 years; range, 62‐87 years), admitted to Clinical University Hospital of Valencia from 17 March to 24 April with clinically suspected COVID‐19 were included in the current study. The only inclusion criterion was availability of blood specimens for T‐cell immunity analyses. Medical history and laboratory data were retrospectively reviewed. The current study was approved by the Research Ethics Committee of Hospital Clínico Universitario INCLIVA.
2.2. Detection of SARS‐CoV‐2 by reverse transcription‐polymerase chain reaction
Nasopharyngeal or oropharyngeal specimens were obtained with flocked swabs in universal transport medium (Beckton Dickinson, Sparks, MD, or Copan Diagnostics, Murrieta, CA) and conserved at 4°C until processed (within 6 hours). Undiluted tracheal aspirate samples obtained from mechanically ventilated patients were also processed when available. Nucleic acid extraction was performed using the Qiagen EZ‐1 Viral extraction kit or the DSP virus Pathogen Minikit using EZ1 or Qiasymphony Robot instruments (Qiagen, Valencia, CA), respectively. We used one or more of the following commercially‐available reverse transcription‐polymerase chain reaction (RT‐PCR) assays for SARS‐CoV‐2 testing: E‐gene/LightMix Modular SARS‐CoV‐2 (COVID‐19) RdRP gene from TIB MOLBIOL GmHD, distributed by Roche Diagnostics (Pleasanton, CA) on the Light Cycler 2.0 instrument; the SARS‐COV‐2 Real‐time PCR Kit from Vircell Diagnostics (Granada, Spain) and the Real Quality RQ‐2019‐nCoV from AB ANALITICA (Padua, Italy), both on the Applied Biosystems 7500 instrument; the SARS‐CoV‐2 (S gene)—BD MAX System (VIASURE Real‐Time PCR Detection Kits; CerTest, Zaragoza, Spain), and the Abbott RealTime SARS‐CoV‐2 Assay (Abbott Molecular Diagnostics, Chicago). A number of these specimens were screened for other respiratory pathogens using the NxTAG Respiratory Pathogen Panel (Luminex Corp, Austin, Tx).
2.3. Antibody detection methods
Initial screening for SARS‐CoV‐2‐specific antibodies was carried out using the 2019‐nCOV immunoglobuliin G (IgG)/immunoglobulin M (IgM) rapid test (Hangzhou AllTest Biotech C, Ltd. China), a rapid lateral flow chromatographic immunoassay (LFIC) designed for qualitative detection of IgG and IgM antibodies in human whole blood or serum. Sera obtained at the time of blood collection for SARS‐CoV‐2 CD8+ T cell immunity analyses were analyzed by the LIAISON SARS‐CoV‐2 IgG (DiaSorin, Saluggia, Italy), a fully automated quantitative chemiluminescent assay (CLIA) detecting IgG antibodies against SARS‐CoV‐2 S protein (S1 and S2 subunits). Immunoassays were performed and interpreted according the respective manufacturer's instructions.
2.4. SARS‐CoV‐2‐reactive interferon γ CD8+ T cells
Enumeration of SARS‐CoV‐2‐reactive CD69+‐expressing‐IFNγ‐producing‐CD8+ T cells was carried out by flow cytometry for ICS (BD Fastimmune, BD‐Beckton Dickinson and Company‐Biosciences, San Jose, CA), following an adapted protocol developed by our group for quantitation of cytomegalovirus‐specific T cells. 16 , 17 Briefly, heparinized whole blood (0.5 mL) was simultaneously stimulated for 6 hours with two sets of 15‐mer overlapping peptides (11‐mer overlap) encompassing the SARS‐CoV‐2 Spike glycoprotein N‐terminal 1 to 643 amino acid sequence (158 peptides) and the entire sequence of SARS‐CoV‐2 M protein (53 peptides), at a concentration of 1 μg/mL per peptide, in the presence of 1 μg/ml of costimulatory monoclonal antibodies (mAbs) to CD28 and CD49d. Peptide mixes were obtained from JPT peptide Technologies GmbH (Berlin, Germany). Samples mock stimulated with phosphate‐buffered saline (PBS)/dimethyl sulfoxide and costimulatory antibodies were run in parallel. Brefeldin A (10 μg/mL) was added for the last 4 hours of incubation. Blood was then lysed (BD FACS lysing solution) and frozen at −80°C until tested. On the day of testing, stimulated blood was thawed at 37°C, washed, permeabilized (BD permeabilizing solution), and stained with a combination of labeled mAbs (anti‐IFNγ‐FITC, anti‐CD69‐PE, anti‐CD8‐PerCP‐Cy5.5, and anti‐CD3‐APC) for 1 hour at room temperature. Appropriate positive (phytohemagglutinin) and isotype controls were used. Cells were then washed, resuspended in 200 μL of 1% paraformaldehyde in PBS, and analyzed within 2 hours on an FACScanto flow cytometer using DIVA v8 software (BD Biosciences Immunocytometry Systems, San Jose, CA). CD3+/CD8+ events were gated and then analyzed for the CD69+ activation marker and IFN‐γ production (Figure 1A). The total number of SARS‐CoV‐2‐reactive CD8+ T cells was calculated by multiplying the percentages of CD8+ T cells producing IFN‐γ on stimulation (after background subtraction) by the absolute CD8+ T cell count. Responses ≥0.1% were considered specific.
Figure 1.
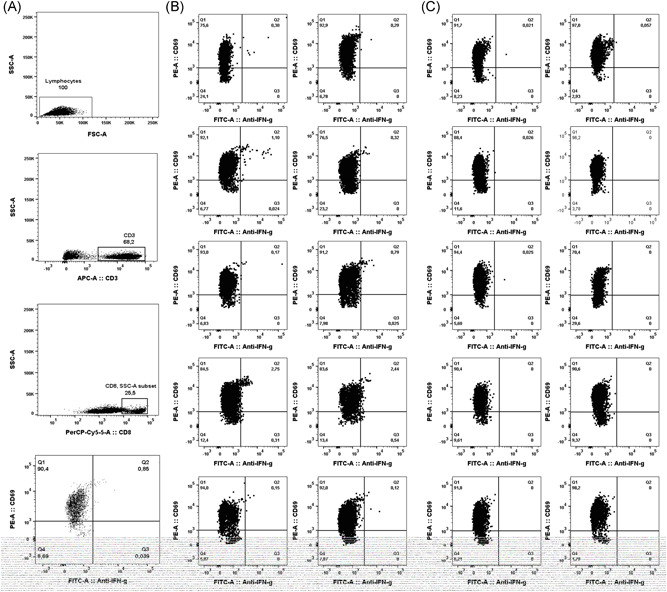
Enumeration of SARS‐CoV‐2‐S1/M‐reactive CD69+‐expressing IFN‐γ‐producing CD8+ T cells by flow cytometry for intracellular staining in patients with COVID‐19. Panel A depicts the gating strategy. Panel B includes plots from patients with detectable responses, while panel C shows plots from 10 patients testing negative. Dot‐plot figures were built with Flow‐Io software (BD Biosciences). COVID‐19, coronavirus disease 2019; IFN‐γ, interferon‐γ; SARS‐CoV‐2, severe acute respiratory syndrome coronavirus 2
2.5. Laboratory measurements
Clinical laboratory investigation included complete blood count and serum levels of ferritin, Dimer‐D, and C reactive protein (CRP). Data on serum interleukin‐6 (IL‐6) levels were not available.
2.6. Statistical methods
Frequency comparisons for categorical variables were carried out using the Fisher exact test. Differences between medians were compared using the Mann‐Whitney U test. The Spearman's rank test was used for analysis of correlation between continuous variables. Two‐sided exact P values were reported. A P‐value <.05 was considered statistically significant. The analyses were performed using SPSS version 20.0 (SPSS, Chicago, IL).
3. RESULTS
3.1. Patient clinical characteristics
Patients in this cohort were admitted to our center at a median of 7 days (range, 0‐28 days) after onset of symptoms. Twenty‐two patients presented with pneumonia and imaging findings on chest‐X‐ray or computed tomography‐scans compatible with COVID‐19. The remaining three patients, clinically suspected of COVID‐19 with no evidence of pneumonia, were admitted due to either aggravation of baseline chronic conditions (n = 2) or venous thrombosis. Median hospitalization time of patients was 18 days (range, 4‐52 days). Seven patients needed intensive care unit (ICU), of whom two died.
As shown in Table 1, diagnosis of COVID‐19 was reached in 18 patients by RT‐PCR in upper or lower respiratory tract specimens, either at initial screening (n = 11) or after repeat testing (n = 7). Of these, 14 also had serological evidence of SARS‐CoV‐2 infection. One patient repeatedly tested negative by RT‐PCR, but exhibited IgG seroconversion. Finally, in six patients no microbiological evidence of SARS‐CoV‐2 infection was obtained. These latter patients tested negative by a multiplexed RT‐PCR assay targeting prevalent respiratory viruses and bacteria in upper or lower respiratory tract specimens.
Table 1.
Microbiological and laboratory data of patients with COVID‐19 included in the study
| Code | RT‐PCR result | SARS‐CoV‐2 IgG and IgM results LFIC | SARS‐CoV‐2 IgG result (CLIA) AU/ml | SARS‐CoV‐2‐reactive CD8+ T‐cells in cells/µL (sample 1/sample 2) | Days from onset of symptoms to immune determination (sample 1/sample 2) | D‐dimer in ng/mL (sample 1/sample 2) | C‐reactive protein in mg/dL sample 1/sample 2) | Ferritin in ng/mlL(sample 1/sample 2) | Total leukocyte count in *109/L (sample 1/sample 2) | Total lymphocyte count in *106/L (sample 1/sample 2) | Total neutrophil count in *109/L (sample 1/sample 2) |
|---|---|---|---|---|---|---|---|---|---|---|---|
| 1 | + | IgM‐/IgG+ | 134 | 0/0.72 | 37/42 | 1438/976 | 30/11 | 562 | 13/6 | 840/1560 | 10.3/2.9 |
| 2 | + | IgM+/IgG+ | 47 | 0/0.83 | 25/30 | 3510/1613 | 8/101 | 312 | 9.5/11.8 | 1330/590 | 6.8/10.7 |
| 4 | + | IgM+/IgG+ | 59.4 | 0.43/0 | 27/35 | 521/709 | 124/11 | 904 | 7.8/6.1 | 1320/1560 | 5/4 |
| 5 | + | IgM+/IgG+ | 20.8 | 0/0 | 39/44 | 848/634 | 20/56 | 422/534 | 11.2/8.3 | 200/550 | 10.8/6.9 |
| 6 | + | IgM+/IgG+ | 59.9 | 0/0 | 35/40 | 1401/1503 | 0.7/30.6 | 887/990 | 14/10.5 | 1320/820 | 12.1/7.4 |
| 7 | + | NA | 32.9 | 9.98 | 11 | 1259 | 98 | 221 | 13.6 | 1980 | 10.6 |
| 8 | + | IgM−/IgG+ | 150 | 0 | 47 | 510 | 10 | 151 | 8.4 | 2250 | 5.1 |
| 9 | + | IgM+/IgG+ | 25.3 | 0 | 45 | 390 | 2.4 | 274 | 6.8 | 2118 | 3.9 |
| 14 | + | IgM−/IgG+ | 87.9 | 0.57 | 34 | 436 | 4.1 | 516 | 8 | 1690 | 5.2 |
| 15 | + | IgM−/IgG+ | 120 | 0.53 | 42 | 389 | 0.2 | 1079 | 7 | 1000 | 5.6 |
| 16 | + | IgM−/IgG+ | 79.3 | 0 | 42 | 241 | 3.1 | 147 | 12.7 | 2090 | 9.7 |
| 17 | + | IgM−/IgG+ | 29.4 | 6.42 | 43 | 326 | 11.7 | 428 | 6.1 | 2070 | 3.5 |
| 19 | + | IgM+/IgG+ | NA | 1.20 | NA | 545 | 0.8 | 61 | 7 | 2910 | 3.3 |
| 11 | + | IgM−/IgG+ | 136 | 0 | 44 | 645 | 19 | 416 | 11 | 1420 | 8.7 |
| 3 | + | IgM−/IgG− | NA | 0 | 15 | 547 | 20 | 83 | 19.8 | 350 | 19 |
| 21 | + | IgM−/IgG− | NA | 0 | NA | 689 | 144 | 287 | 9.6 | 2950 | 5.2 |
| 22 | + | IgM−/IgG− | NA | 0/0.48 | 11/15 | 1707/1103 | 32/29 | 790/685 | 5 | 1570/1470 | 3.1/3.7 |
| 25 | + | IgM−/IgG− | 101 | 0 | 14 | 186 | 13 | 272 | 9.4 | 2170 | 5.6 |
| 18 | − | IgM+/IgG− | NA | 0 | 2 | 345 | 69 | 252 | 4.9 | 1940 | 2.3 |
| 10 | − | IgM−/IgG− | NA | 0 | 5 | 418 | 8 | 1362 | 5 | 1960 | 2.7 |
| 12 | − | IgM−/IgG− | NA | 0 | 8 | 362 | 64 | 205 | 13 | 1300 | 10.6 |
| 13 | − | IgM−/IgG− | NA | 2.78 | 27 | 91 | 2.3 | 181 | 11.7 | 840 | 10.3 |
| 23 | − | IgM−/IgG− | NA | 0/0 | 9/13 | 314/85 | 4.1/1.3 | 401/225 | 6.6/67.5 | 780/690 | 5.2/5.2 |
| 24 | − | IgM−/IgG− | NA | 0/0 | 7/11 | 4339 | 10/15 | 617 | 7.5/7.1 | 950/1360 | 5.9/5 |
| 20 | − | IgM−/IgG− | 15 | 0 | 26 | NA | 23.5 | NA | 8.8 | 1940 | 6.1 |
Note: +, positive; −, negative.
Abbreviations: COVID‐19, coronavirus disease 2019; CLIA, chemiluminescent assay; CRP, C‐reactive protein; IgG, immunoglobulin G; IgM, immunoglobulin M; LFIC, lateral flow immunochromatography; NA, not available; RT‐PCR, reverse transcription‐polymerase chain reaction; SARS‐CoV‐2, severe acute respiratory syndrome coronavirus 2.
3.2. Detection of SARS‐CoV‐2‐reactive IFN‐γ CD8+ T cells in patients with COVID‐19
Enumeration of peripheral blood SARS‐CoV‐2‐S1/M‐reactive CD69+‐IFN‐γ CD8+ T cells was carried out at a median of 27 days from onset of symptoms (range, 2‐47 days). Eight patients were re‐screened within the next 5 days. Ten patients (40%) had detectable responses (Table 1 and Figure 1B), displaying frequencies ranging from 0.15 to 2.7% (median of 0.57 cells/µL; range, 0.43‐9.98 cells/µL). Nine of these patients had previously tested positive by RT‐PCR, and eight had specific antibodies detected by LFIC, CLIA, or both. Among the latter patients, three had IgM antibodies. A single patient (number 13 in Table 1) displayed detectable SARS‐CoV‐2‐reactive IFN‐γ CD8+ T cells despite absence of microbiological confirmation of COVID‐19 by either RT‐PCR or serological methods. Fifteen patients had no detectable SARS‐CoV‐2 IFN‐γ CD8+ T‐cell responses (representative examples shown in Figure 1C).
Among those with microbiologically documented COVID‐19, the detection rate of SARS‐CoV‐2‐reactive IFN‐γ CD8+ T cells in patients admitted to ICU (57%) was not significantly different (P = .54) from the rate in patients hospitalized in other medical wards (43%).
No correlation was found between levels of SARS‐CoV‐2‐reactive IFN‐γ CD8+ T cells and levels of SARS‐CoV‐2 S‐specific antibodies quantitated by CLIA (Figure 2) in paired whole blood and serum specimens. Patients without microbiological confirmation of COVID‐19 were excluded for this analysis.
Figure 2.
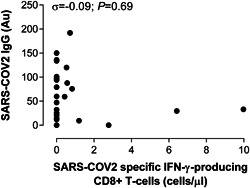
Correlation between SARS‐CoV‐2‐S1/M‐reactive CD69+ expressing IFN‐γ‐producing CD8+ T cells and serum levels of anti‐S‐IgG antibodies measured by CLIA in patients with microbiologically documented COVID‐19. Rho and P values are shown. COVID‐19, coronavirus disease 2019; IFN‐γ, interferon‐γ; IgG, immunoglobulin G; SARS‐CoV‐2, severe acute respiratory syndrome coronavirus 2
3.3. Adaptive immune responses to SARS‐CoV‐2 and laboratory markers of COVID‐19 severity
We next investigated the potential relationship between SARS‐CoV‐2‐reactive IFN‐γ CD8+ T‐cell counts, S‐specific IgG‐antibody titers and blood levels of a number of prognostic laboratory parameters of COVID‐19 progression, including total leukocyte, lymphocyte and neutrophil counts, and markers of inflammation (or coagulation), such as ferritin, CRP, and Dimer‐D. To this end, only patients with microbiological confirmation of COVID‐19 were included in these analyses. A proinflammatory state was noticed in most patients in this series, while cytopenias were less frequently observed (Table 2). Patients with or without detectable SARS‐CoV‐2‐reactive IFN‐γ CD8+ T cells were comparable regarding these parameters (Table 2). In addition, no correlation was found between either SARS‐CoV‐2‐reactive IFN‐γ CD8+ T cells or S‐specific IgG‐antibody titers and blood cell count or levels of any of these biomarkers (Rho < 0.2 and P > .5 in all correlation analyses).
Table 2.
Laboratory data of patients with microbiologically documented COVID‐19 with or without detectable SARS‐CoV‐2‐reactive IFN‐γ‐producing CD8+ T‐cells
| Parameter | Detection of SARS‐CoV‐2‐reactive specific IFN‐γ‐producing CD8+ T‐cells | P value | |
|---|---|---|---|
| Yes (n = 9) | No (n = 10) | ||
| Days since onset of symptoms (median, range) | 32 (11‐43) | 26 (2‐45) | .31 |
| Total leukocyte count (×109/L), (median, range) | 7.41 (5.63‐13.58) | 8.76 (4.93‐19.80) | .53 |
| Total lymphocyte count (×106/L), (median, range) | 1,515 (590‐2,910) | 1,360 (200‐2,950) | .65 |
| Total neutrophil count (×109/L), (median, range) | 5.12 (2.88‐10.66) | 5.90 (2.33‐19.12) | .41 |
| Ferritin in ng/mL (median, range) | 428 (61‐1079) | 409 (83‐1362) | .89 |
| Dimer‐D in ng/mL, (median, range) | 533 (91‐1613) | 634 (85‐4339) | .83 |
| C‐reactive protein in mg/L, (median, range) | 11 (0.2‐124) | 15 (0.7‐144) | .80 |
Note: Normal values: 12 to 300 ng/mL for ferritin, <100 ng/mL for Dimer‐D, and <10 mg/L for C‐reactive protein.
Abbreviations: COVID‐19, coronavirus disease 2019; IFN‐γ, interferon‐γ; SARS‐CoV‐2, severe acute respiratory syndrome coronavirus 2.
4. DISCUSSION
There is a knowledge gap regarding the immune mechanisms that confer protection against SARS‐CoV‐2. On the basis of experimental evidence gathered on SARS‐CoV and MERS‐CoV infections, 18 , 19 it is assumed that both CD4+ and CD8+ T cells play a major role in virus clearance and long‐term protection against SARS‐CoV‐2 infection. Although plausible, data supporting this assumption is lacking. In this context, to the best of our knowledge, only a few studies have assessed the frequency of SARS‐CoV‐2‐reactive CD4+ T cells (by flow cytometry) or T‐cells (by IFNγ‐ELISPOT) in peripheral blood from patients with COVID‐19 or COVID‐19 convalescent individuals, respectively. 13 , 14 , 15
Here, we optimized a flow cytometry ICS method for quantitation of SARS‐CoV‐2‐reactive‐activated (CD69+ expressing)‐CD8+ T cells producing IFN‐γ upon antigenic stimulation. This assay uses whole blood as a matrix, thus circumventing the need for peripheral blood mononuclear cells separation, and a combination of two peptide mixes composed of overlapping peptides spanning the S1 region of the S glycoprotein and the entire amino acid sequence of the M protein. We chose SARS‐CoV‐2 S1 and M proteins as antigenic stimuli because they are expected to contain highly immunogenic CTL epitopes restricted by HLA‐class I specificities commonly found in Caucasian individuals (all patients in this series), based on sequence alignment with SARS‐CoV homologous proteins. 11 , 20 Moreover, amino acid sequences of these CTL epitopes are reasonably distinct from aligned sequences present in seasonal coronaviruses, thereby minimizing the likelihood of detecting cross‐reactive CD8+ T cells. 11 In turn, by combining S1 and M peptide libraries, we maximized our chances of capturing as many SARS‐CoV‐2 TCR specificities as possible, thus potentially increasing the sensitivity of the assay.
Several findings arose from our study. First, SARS‐CoV‐2 IFN‐γ CD8+ T cells targeting S1 and M proteins were detected in 40% of patients at a relatively late stage after onset of symptoms (median, 27 days). It is likely that these T‐cell subsets could have been circulating long before; our study, however, was not designed to characterize their kinetics. It is relevant to note that the median age of our patients was high (62 years); although speculative, the rate of detection could arguably have been higher in younger people (no immunosenescence).
Braun and colleagues detected S1 and S2‐reactive CD4+ T cells expressing cell‐surface activation markers in 12 and 15 out of 18 patients (median age, 52 years old), respectively, presenting with mild to severe forms of COVID‐19. 13 However, the potential antiviral functionality of these T‐cell subsets was not explored. Ni et al identified SARS‐CoV‐2‐specific IFN‐γ T cells (measured by ELISPOT) targeting the nucleocapsid protein, the M protein or the S1 receptor binding domain (RBD) in up to 7 out of 14 individuals who had recovered from COVID‐19. 14 Grifoni et al 15 showed that the M, spike, and N proteins each accounted for 11%‐27% of the total functional (IL‐2 or IFN‐γ‐ producing) CD4+ T‐cell responses, which also targeted nsp3, nsp4, ORF3a (open reading frame), and ORF8, among others. In addition, at least eight ORFs including those encoding the S and M proteins were recognized by CD8+ T cells.
Second, the frequency of SARS‐CoV‐2‐reactive IFN‐γ CD8+ T cells varied widely across patients in this series, and was unexpectedly high in some cases (eg, patient 7 in Table 1: 2.75%). A number of reasons could account for this apparent variability including the magnitude of the viral challenge, the host genetic background or the elapsed since infection acquisition. Further studies are warranted to address this issue.
Third, SARS‐CoV‐2‐reactive IFN‐γ‐CD8+ T cells appeared to develop at comparable rates and frequencies irrespective of COVID‐19 severity. However, the two deceased patients in this series, who had no history of immunodeficiency conditions, did not exhibit detectable responses. This latter observation is reminiscent of findings reported by Braun et al 13 who showed that patients with critical disease states lacked S1‐reactive CD4+ T cells. In line with this assumption, data published in the SARS‐CoV infection setting pointed to impaired development of adaptive immune responses in patients with severe forms of the disease. 21 Nevertheless, the limited size of the current series precluded us from drawing robust conclusions on this issue.
Fourth, interestingly enough, SARS‐CoV‐2‐reactive IFN‐γ CD8+ T cells were detected in one patient with high clinical suspicion of COVID‐19 but without microbiological documentation of SARS‐CoV‐2 infection, and who tested negative for respiratory viruses and bacteria commonly causing community‐acquired respiratory tract infections. Although speculative, this suggests that T‐cell immunity assays might be a valuable tool for COVID‐19 diagnosis in patients with repeated negative RT‐PCR test results and delayed or no antibody conversion. This assumption awaits confirmation in further studies.
Fifth, among patients with microbiologically confirmed COVID‐19, we found no correlation between SARS‐CoV‐2‐reactive IFN‐γ CD8+ T cells and S‐specific antibody levels, which in turn appear to strongly correlate with SARS‐CoV‐2 neutralizing activity of sera, 22 suggesting that SARS‐CoV‐2 targeted B and T‐cell responses may follow divergent dynamics, as noticed in SARS CoV infection. 20 Our data is nevertheless in contrast with the study by Ni et al 14 who found a strong correlation between SARS‐CoV‐reactive IFN‐γ T cells and S1‐RBD‐specific neutralizing antibodies in convalescent individuals (in our current study patients with active disease were included).
Sixth, lung inflammation is the main cause of life‐threatening respiratory disorders at the severe stage of COVID‐19. It is plausible that SARS‐CoV‐2‐reactive T cells and certain specificities of SARS CoV‐2‐specific antibodies (ie, those mediating antibody‐dependent enhancement‐ADE‐) may be mechanistically involved in promoting such a proinflammatory state. 23 , 24 In this respect, we found no correlation between SARS‐CoV‐2‐reactive IFN‐γ CD8+ T cells, antibodies targeting the S protein (which contain both neutralizing and ADE epitopes) and serum levels of ferritin, CRP, and Dimer‐D. However, these findings should not be overinterpreted, and by no means rule out involvement of virus‐driven immunopathogenic mechanisms in progression to acute respiratory distress syndrome. Further prospective studies assessing how the dynamics of these parameters relate in sequential specimens are needed to shed light on this issue.
Besides the low number of patients in our series, the main limitation of the current study is that the specificity of SARS‐CoV‐2‐reactive IFN‐γ‐CD8+ T cells was not proven. Based on sequence analyses, SARS‐CoV‐2 and seasonal alpha and beta coronaviruses may share HLA‐class I‐restricted immunogenic epitopes mapping within S1 and M potentially eliciting cross‐reactive T cells. 20 In support of this assumption, S‐reactive CD4+ T cells could be detected in 34% of healthy control individuals who had seemingly not been infected by SARS‐CoV‐2, albeit at lower frequencies than in patients with COVID‐19, and displaying a differential pattern of cell‐surface activation markers. 13 Moreover, Grifoni et al 15 detected SARS‐CoV‐2‐reactive CD4+ T cells in approximately 40% to 60% of unexposed individuals, suggesting cross‐reactive T cell recognition between circulating “common cold” coronaviruses and SARS‐CoV‐2. We also tested four healthy asymptomatic individuals with no evidence of active or past COVID‐19 and found one of them to be reactive, although displaying a low frequency of SARS‐CoV‐2 reactive IFN‐γ‐CD8+ T cells (0.12%) (data not shown). Against the epidemiological framework of heavy SARS CoV‐2 community transmission, as is currently confronting Spain, it may be unwise to recruit asymptomatic individuals as negative controls, even ones testing negative by RT‐PCR or having no evidence of seroconversion, given that some of these subjects could have been exposed to and developed measurable T‐cell responses. Unfortunately, cryopreserved blood specimens from healthy individuals with or without documented infection caused by seasonal coronaviruses had not been collected before SARS‐CoV‐2 appeared in our health department. Studies aimed at assessing the specificity of IFN‐γ CD8+ T cells detected by our assay have been designed and are to be initiated as soon as control is gained over our local epidemic outbreak.
In summary, in this descriptive, preliminary study we showed that SARS‐CoV‐2‐reactive IFN‐γ CD8+ T cells can be detected in a non‐negligible percentage of patients with moderate to severe forms of COVID‐19. As previously suggested, 13 , 15 quantitation of these T‐cell subsets, whether cross‐reactive or specific, may provide prognostic information on the clinical course of COVID‐19. Studies designed to address this issue are currently underway.
CONFLICT OF INTERESTS
The authors declare that there are no conflict of interests.
AUTHOR CONTRIBUTIONS
EG, EA, IT, MJR, and CS, performed T cell and antibody assays, and collected the data. MJG, MLB, MJF, JR, and JS‐C attended the patients. DN and EG analyzed and interpreted the data and wrote the manuscript.
ACKNOWLEDGMENTS
No public or private funds were used for the current study. The authors are grateful to all personnel who work at Clinic University Hospital, in particular to staff at the Microbiology laboratory for their commitment to the fight against COVID‐19.
Giménez E, Albert E, Torres I, et al. SARS‐CoV‐2‐reactive interferon‐γ‐producing CD8+ T cells in patients hospitalized with coronavirus disease 2019. J Med Virol. 2021;93:375–382. 10.1002/jmv.26213
REFERENCES
- 1. https://www.who.int/dg/speeches/detail/who-director-general-s-opening
- 2. Coronavirus COVID‐19 global cases by Johns Hopkins University (http://coronavirus.jhu.ed)
- 3. Zhou F, Yu T, Du R, et al. Clinical course and risk factors for mortality of adult inpatients with COVID‐19 in Wuhan, China: a retrospective cohort study. Lancet. 2020;395:1054‐1062. [DOI] [PMC free article] [PubMed] [Google Scholar]
- 4. Guan W‐j, Ni Z‐y, Hu Y, et al. Clinical characteristics of coronavirus disease 2019 in China. N Engl J Med. 2020;382(18):1708‐1720. [DOI] [PMC free article] [PubMed] [Google Scholar]
- 5. Jiang S, Hillyer C, Du L. Neutralizing antibodies against SARS‐CoV‐2 and other human coronaviruses. Trends Immunol. 2020;41:355‐359. [DOI] [PMC free article] [PubMed] [Google Scholar]
- 6. Long Q‐X, Liu B‐Z, Deng H‐J, et al. Antibody responses to SARS‐CoV‐2 in patients with COVID‐19. Nature Med. 2020;26:1‐4. 10.1038/s41591-020-0897-1 [DOI] [PubMed] [Google Scholar]
- 7. Wang C, Li W, Drabek D, et al. A human monoclonal antibody blocking SARS‐CoV‐2 infection. Nat Commun. 2020;11(1). 2251‐2251. [DOI] [PMC free article] [PubMed] [Google Scholar]
- 8. Zhao J, Yuan Q, Wang H, et al. Antibody responses to SARS‐CoV‐2 in patients of novel coronavirus disease 2019. Clin Infect Dis. 2020. 10.1093/cid/ciaa344 [DOI] [PMC free article] [PubMed] [Google Scholar]
- 9. To KK‐W, Tsang OT‐Y, Leung W‐S, et al. Temporal profiles of viral load in posterior oropharyngeal saliva samples and serum antibody responses during infection by SARS‐CoV‐2: an observational cohort study. Lancet Infect Dis. 2020;20:565‐574. [DOI] [PMC free article] [PubMed] [Google Scholar]
- 10. Wölfel R, Corman VM, Guggemos W, et al. Virological assessment of hospitalized patients with COVID‐2019. Nature. 2020;581(7809):465‐469. [DOI] [PubMed] [Google Scholar]
- 11. Liu WJ, Zhao M, Liu K, et al. T‐cell immunity of SARS‐CoV: implications for vaccine development against MERS‐CoV. Antiviral Res. 2017;137:82‐92. [DOI] [PMC free article] [PubMed] [Google Scholar]
- 12. Lu R, Zhao X, Li J, et al. Genomic characterisation and epidemiology of 2019 novel coronavirus: implications for virus origins and receptor binding. Lancet. 2020;395:565‐574. [DOI] [PMC free article] [PubMed] [Google Scholar]
- 13. Braun J, Loyal L, Frentsch M, et al. Presence of SARS‐CoV‐2 reactive T cells in COVID‐19 patients and healthy donors. medRxiv. 2020. 10.1101/2020.04.17.20061440 [DOI] [PubMed] [Google Scholar]
- 14. Ni L, Ye F, Cheng M‐L, et al. Detection of SARS‐CoV‐2‐specific humoral and cellular immunity in COVID‐19 convalescent individuals. Immunity. 2020;S1074‐7613(20):30181‐30183. [DOI] [PMC free article] [PubMed] [Google Scholar]
- 15. Grifoni A, Weiskopf D, Ramirez SI, et al. Targets of T cell responses to SARS‐CoV‐2 coronavirus in humans with COVID‐19 disease and unexposed individuals. Cell. 2020;S0092‐8674(20):30610‐30613. [DOI] [PMC free article] [PubMed] [Google Scholar]
- 16. Solano C, Benet I, Clari MA, et al. Enumeration of cytomegalovirus‐specific interferongamma CD8+ and CD4+ T cells early after allogeneic stem cell transplantation may identify patients at risk of active cytomegalovirus infection. Haematologica. 2008;93(1434‐1426. [DOI] [PubMed] [Google Scholar]
- 17. Tormo N, Solano C, Benet I, et al. Lack of prompt expansion of cytomegalovirus pp65 and IE‐1‐specific IFNgamma CD8+ and CD4+ T cells is associated with rising levels of pp65 antigenemia and DNAemia during pre‐emptive therapy in allogeneic hematopoietic stem cell transplant recipients. Bone Marrow Transplant. 2010;45:543‐549. [DOI] [PubMed] [Google Scholar]
- 18. Channappanavar R, Fett C, Zhao J, Meyerholz DK, Perlman S. Virus‐specific memory CD8+ T cells provide substantial protection from lethal severe acute respiratory syndrome coronavirus infection. J Virol. 2014;88:11034‐11044. [DOI] [PMC free article] [PubMed] [Google Scholar]
- 19. Chen H, Hou J, Jiang X, et al. Response of memory CD8+ T cells to severe acute respiratory syndrome (SARS) coronavirus in recovered SARS patients and healthy individuals. J Immunol. 2005;175(1):591‐598. [DOI] [PubMed] [Google Scholar]
- 20. Channappanavar R, Zhao J, Perlman S. T cell‐mediated immune response to respiratory coronaviruses. Immunol Res. 2014;59:118‐128. [DOI] [PMC free article] [PubMed] [Google Scholar]
- 21. Cameron MJ, Bermejo‐Martin JF, Danesh A, Muller MP, Kelvin DJ. Human immunopathogenesis of severe acute respiratory syndrome (SARS). Virus Res. 2008;133(1):13‐19. [DOI] [PMC free article] [PubMed] [Google Scholar]
- 22. Wu F, Wang A, Liu M, et al. Neutralizing antibody responses to SARS‐CoV‐2 in a COVID‐19 recovered patient cohort and their implications. medRxiv. 2020. 10.1101/2020.03 2020–033020047365 30.20047365 [DOI] [Google Scholar]
- 23. Lin L, Lu L, Cao W, Li T. Hypothesis for potential pathogenesis of SARS‐CoV‐2 infection—a review of immune changes in patients with viral pneumonia. Emerg Microbes Infect. 2020;9:727‐732. [DOI] [PMC free article] [PubMed] [Google Scholar]
- 24. Negro F. Is antibody‐dependent enhancement playing a role in COVID‐19 pathogenesis? Swiss Med Wkly. 2020;150:w20249. 10.4414/smw.2020.20249 [DOI] [PubMed] [Google Scholar]