

Abstract
Objective
This study’s aim was to explore the association of obesity, type 2 diabetes, and hypertension with severe coronavirus disease 2019 (COVID‐19) on admission.
Methods
In the present study, a total of 23,593 patient samples were evaluated by a laboratory from the Mexican Institute of Epidemiological Diagnosis and Reference. Of these, 18,443 were negative for COVID‐19, 3,844 were positive for COVID‐19, and 1,306 were positive for other respiratory viruses. Severe types of respiratory disease were defined by the presence of pneumonia and other organ failure that requires intensive care. Multivariable logistic regression models were used to explore factors associated with severe COVID‐19 on admission.
Results
Patients who tested positive for COVID‐19 had a higher proportion of obesity (17.4%), diabetes (14.5%), and hypertension (18.9%) compared with those without a confirmed diagnosis. Compared with patients without obesity, those with obesity showed a 1.43‐fold higher odds of developing severe COVID‐19 on admission, whereas subjects with diabetes and hypertension showed a 1.87‐fold and 1.77‐fold higher odds of developing severe COVID‐19 on admission, respectively.
Conclusions
Obesity, diabetes, and hypertension were significantly associated with severe COVID‐19 on admission and the association of obesity was stronger in patients < 50 years of age.
Study Importance.
What is already known?
-
►
Previous studies have highlighted the relationship between obesity and higher risk of infectious diseases. Some of these studies have reported the association between obesity and the risk of a severe form of coronavirus disease 2019 (COVID‐19).
What does this study add?
-
►
After adjusting for age, sex, smoking status, history of chronic diseases (hypertension, diabetes, cardiovascular disease, chronic kidney disease, immunosuppression), and drug treatment, people with obesity in Mexico showed a 1.43‐fold higher odds of developing severe COVID‐19 on admission compared with patients without obesity.
How might these results change the focus of clinical practice?
-
►
If causality exists between obesity, diabetes, and hypertension and COVID‐19, it will help the health sector better target vulnerable populations and assess the risk of deterioration.
Introduction
The new coronavirus disease 2019 (COVID‐19) epidemic, which is caused by the severe acute respiratory syndrome coronavirus‐2 (SARS‐CoV‐2), has spread worldwide and poses a critical threat to public health around the world. Rapidly communicating information related to the virus is a current priority for disease prevention and control (1, 2, 3).
Obesity has been linked with a greater risk of inflammation and other chronic conditions (4, 5). In addition, previous studies have highlighted the relationship between obesity and diabetes and a higher risk of infectious diseases (6, 7). For example, obesity has long been recognized as a risk factor for increased morbidity and mortality associated with the influenza A (H1N1) infection (8). This is a major challenge in countries like Mexico, where obesity prevalence (40.1% in women and 26.6% in men) ranks as one of the highest in the world and has continued to increase during the last three decades, particularly in low‐ and middle‐income groups (9).
Previous reports (1, 3, 10, 11) suggest that people over age 60 and those with obesity have a higher risk of severe COVID‐19 complications. For that reason, understanding and quantifying this risk is key to enabling patients, caregivers, and health care professionals to make informed decisions about ways to manage risk in patients with obesity, type 2 diabetes, or hypertension during the COVID‐19 pandemic.
Thus, the present study hypothesized that patients with obesity, diabetes, and hypertension would experience greater odds of developing severe COVID‐19 on admission. If so, this might provide insights for Mexican health authorities and other middle‐income or developing countries with a high prevalence of obesity.
Methods
Design and study participants
In Mexico, COVID‐19 reporting follows two general procedures. Hospital surveillance keeps track of all deaths and hospitalizations, providing a census of confirmed COVID‐19 cases. In addition, sentinel surveillance is carried out through a system of selected health units that monitor respiratory diseases (USMER, for its name in Spanish) (Figure 1). USMER includes medical units from the first, second, or third level of care that have enough material and human resources to follow strict clinical evaluation protocols to identify respiratory disease, as well as having the infrastructure to produce timely and complete epidemiological reports (12). A total of 475 USMER units are distributed across the country, and every Mexican state has at least one reporting unit. Although sentinel units were not selected randomly, sentinel surveillance is the most effective way to collect good‐quality and timely data on respiratory diseases in Mexico. The spectrum of severity of COVID‐19 infections varies greatly. In this sense, the sentinel surveillance system focuses on mild manifestations of mostly community cases, whereas severe patients who require hospital treatment are documented by hospital‐based surveillance.
Figure 1.
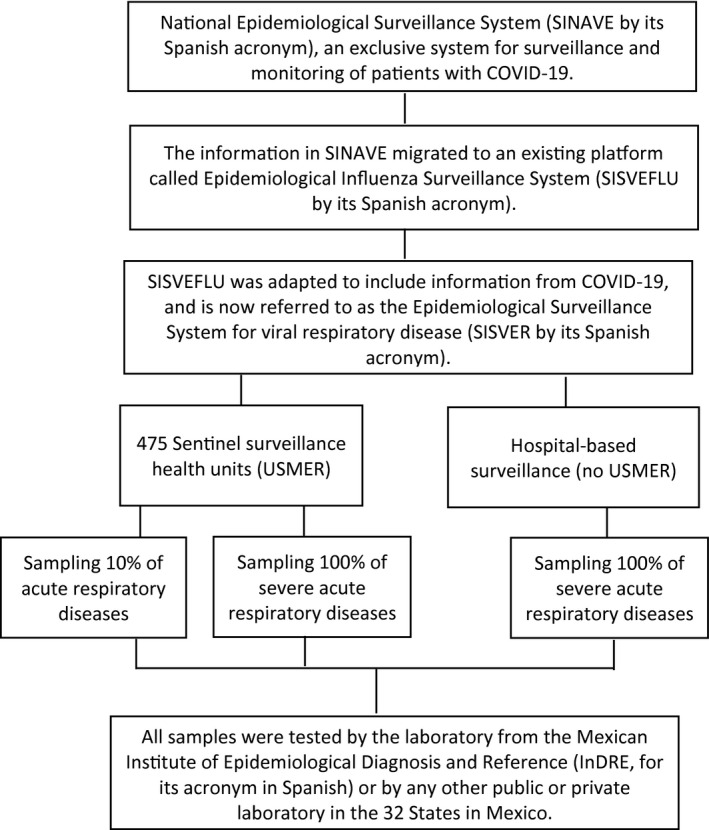
Flowchart of the Mexican National Epidemiological Surveillance System for Viral Respiratory Disease.
In the present study, the information collected from National Epidemiological Surveillance System started on February 27, 2020, when the first case of COVID‐19 in Mexico was confirmed, and ended on April 10, 2020. A total of 33,893 subjects were included in the Epidemiological Surveillance System for Viral Respiratory Disease (SISVER, for its name in Spanish) platform (Figure 1). Of these, 23,593 patient samples were tested for SARS‐CoV‐2 by the laboratory from the Mexican Institute of Epidemiological Diagnosis and Reference or by any other public or private laboratory in Mexico. Of the 23,593 samples for which results were available, 18,443 were negative for COVID‐19, 3,844 were positive for COVID‐19, and 1,306 were positive for other respiratory viruses such as H1N1.
For the initial analysis, we only included those who were negative or positive for COVID‐19 and who had complete information. In the final analysis, only those who were positive for COVID‐19 were included.
Data collection
Confirmation of COVID‐19
This study used the information collected by every state through first‐, second‐, and third‐level medical care units, which evaluate suspected cases of viral respiratory disease on the basis of an operational definition (person of any age who in the past 7 days has had cough, fever, or headache [at least two of these symptoms] accompanied by at least one of the following signs or symptoms: dyspnea, arthralgia, myalgia, odynophagia, rhinorrhea, conjunctivitis, or chest pain.) Among these suspected cases, two protocols were followed: (a) SARS‐CoV‐2 testing for suspected COVID‐19 cases with severe acute respiratory infection with signs of breathing difficulty and (b) sentinel surveillance was for all other suspected cases (13). This definition was approved by the National Epidemiological Surveillance Committee (14). Once collected, this information was uploaded to the SISVER online platform.
The presence of SARS‐CoV‐2 was diagnosed by using the real‐time reverse‐transcription polymerase chain reaction method, based on the Berlin protocol (15, 16). Only laboratory‐confirmed cases were included in the final analysis.
A consent disclaimer was obtained for the purposes of this study. This cross‐sectional study was performed in line with the Strengthening the Reporting of Observational Studies in Epidemiology Statement.
Outcome assessment
For the present study, the primary outcome was a severe form of COVID‐19. All patients were classified into severe and mild respiratory disease on the basis of results from a clinical examination and their symptoms. Patients who only had symptoms like cough, expectoration, and other upper‐respiratory‐tract symptoms were classified as nonsevere. Severe types of respiratory disease on admission were defined by the presence of pneumonia and other organ failure that requires monitoring and treatment in the intensive care unit (ICU).
Additionally, information on the date of the onset of symptoms and the date of hospital admission, as well as the status of treatment (outpatient or hospitalized), information on the diagnosis of pneumonia, and admission to the ICU, are available for all cases (13).
Assessment of covariates
In most cases (approximately 68%), information on obesity, type 2 diabetes, and hypertension was obtained by the attending physician by self‐report from the patient. For the rest (approximately 32%), information was obtained by self‐report and was corroborated with medical records.
The attending physician collected epidemiological, other clinical (presence of comorbidities), laboratory, and treatment information as well as demographic characteristics (e.g., age, sex) and tobacco consumption using a standardized questionnaire. This information was subsequently recorded on the SISVER online platform.
Statistical analyses
Descriptive analyses of the main characteristics of interest were performed. Categorical variables were described as percentages, and continuous variables were described as means and SDs. Means for continuous variables were compared using independent group t tests. Comparisons for categorical variables were done using the χ2 test or the Fisher exact test. Multivariable logistic regression models (one model for each condition) were used to explore obesity, diabetes, and hypertension with severe COVID‐19 on admission; odds ratios (ORs) and 95% CIs were estimated.
To assess the possible effect of modification, we explored stratified analyses by age (two categories: ≤50 vs. >50 years). We tested the significance of the interaction with a likelihood‐ratio test by comparing a model including the main‐effect variable and the interaction terms with a reduced model including only the main effects.
All P values presented are two‐sided; P < 0.05 was considered statistically significant. The statistical analyses were performed using the Stata Software statistical software package, version 13.0 (StataCorp, College Station, Texas).
Results
When comparing the patients who tested positive for COVID‐19 to those who tested negative, we observed that the positive patients had a mean age of 45.4 years, and a higher proportion of them were over age 60 (19.4%). Additionally, patients who were positive for COVID‐19 had a higher proportion of obesity (17.4%), diabetes (14.5%), and hypertension (18.9%) compared with those without a confirmed diagnosis (Table 1).
TABLE 1.
Characteristics of patients analyzed by Mexican Institute of Epidemiological Diagnosis and Reference
| COVID‐19 (n = 3,844) | Negative for COVID‐19 (n = 18,443) | P value | |
|---|---|---|---|
| Age, y a | 45.4 ± 15.8 | 38.8 ± 17.5 | <0.001 |
| Age, % | <0.001 | ||
| <19 years | 2.6 | 8.9 | |
| 20‐59 years | 78.0 | 78.5 | |
| ≥60 years | 19.4 | 12.6 | |
| Sex, % | <0.001 | ||
| Women | 42.0 | 54.5 | |
| Men | 58.0 | 45.5 | |
| Smoking status, % | 0.06 | ||
| Yes | 9.5 | 10.5 | |
| Chronic conditions, % | |||
| Obesity | 17.4 | 12.8 | <0.001 |
| Diabetes | 14.5 | 9.6 | <0.001 |
| Hypertension | 18.9 | 14.4 | <0.001 |
| Cardiovascular disease | 2.8 | 3.3 | 0.09 |
| Chronic kidney disease | 1.7 | 2.1 | 0.07 |
| Immunosuppression | 1.0 | 1.0 | 0.55 |
| Initial symptoms | |||
| Fever | 79.5 | 66.3 | <0.001 |
| Cough | 86.2 | 83.5 | <0.001 |
| Sore throat | 45.0 | 49.8 | <0.001 |
| Nasal congestion | 41.0 | 46.2 | <0.001 |
| Dyspnea | 37.2 | 27.6 | <0.001 |
| Headache | 78.9 | 76.9 | 0.02 |
| Muscle pain | 64.7 | 52.9 | <0.001 |
| Arthralgia | 58.3 | 48.0 | <0.001 |
| Diarrhea | 20.7 | 16.0 | <0.001 |
| Vomiting | 7.7 | 7.6 | 0.17 |
| Abdominal pain | 15.4 | 14.2 | 0.07 |
| Conjunctivitis | 14.9 | 13.9 | 0.09 |
| Treatment, % | |||
| Antiviral treatment | <0.001 | ||
| Yes | 19.2 | 15.7 | |
| Need ICU b care | <0.001 | ||
| Yes | 12.7 | 6.9 | |
| Invasive mechanical ventilation | <0.01 | ||
| Yes | 12.1 | 5.7 |
Mean ± SD.
ICU, intensive care unit.
The characteristics of patients who tested positive for COVID‐19 were stratified by obesity condition (Table 2). Of them, 17.4% had obesity and 82.6% did not have obesity. We observed a higher number of older patients among those with obesity than among the patients without obesity (23.0% vs. 18.7%; P < 0.001). Patients with obesity also had a higher prevalence of other chronic diseases, such as diabetes (29.3%), hypertension (36.1%), cardiovascular disease (5.9%), and chronic kidney disease (2.3%). Patients with obesity were more likely to have symptoms such as fever (P < 0.001), cough (P = 0.005), and dyspnea (P < 0.001) compared with patients without obesity. Finally, a higher proportion of patients with obesity required ICU support and invasive medical ventilation.
TABLE 2.
Characteristics of patients with COVID‐19 according to obesity condition
| Total (n = 3,844) | Without obesity (n = 3,176) | With obesity (n = 668) | P value | |
|---|---|---|---|---|
| Age, y a | 45.4 ± 15.8 | 44.9 ± 16.1 | 48.2 ± 14.0 | <0.001 |
| Age, % | 0.001 | |||
| <19 y | 2.6 | 2.9 | 0.9 | |
| 20‐59 y | 78.0 | 78.4 | 76.1 | |
| ≥60 y | 19.4 | 18.7 | 23.0 | |
| Sex, % | 0.85 | |||
| Women | 42.0 | 42.2 | 41.8 | |
| Men | 58.0 | 57.8 | 58.2 | |
| Smoking status, % | <0.001 | |||
| Yes | 9.5 | 8.5 | 13.9 | |
| Chronic conditions, % | ||||
| Diabetes | 17.4 | 11.3 | 29.3 | <0.001 |
| Hypertension | 14.5 | 15.3 | 36.1 | <0.001 |
| Cardiovascular disease | 18.9 | 2.1 | 5.9 | <0.001 |
| Chronic kidney disease | 2.8 | 1.6 | 2.3 | 0.27 |
| Immunosuppression | 1.0 | 0.85 | 1.1 | 0.55 |
| Initial symptoms | ||||
| Fever | 79.5 | 78.0 | 86.2 | <0.001 |
| Cough | 86.2 | 85.5 | 89.7 | 0.005 |
| Sore throat | 45.0 | 44.4 | 47.5 | 0.03 |
| Nasal congestion | 41.0 | 40.6 | 42.8 | 0.03 |
| Dyspnea | 37.2 | 34.2 | 51.2 | <0.001 |
| Headache | 78.9 | 78.9 | 78.7 | 0.76 |
| Muscle pain | 64.7 | 63.8 | 68.7 | 0.01 |
| Arthralgia | 58.3 | 57.1 | 64.1 | <0.001 |
| Diarrhea | 20.7 | 18.9 | 29.1 | <0.001 |
| Vomiting | 7.7 | 7.2 | 11.2 | <0.001 |
| Abdominal pain | 15.4 | 14.5 | 21.1 | <0.001 |
| Conjunctivitis | 14.9 | 14.4 | 17.4 | 0.02 |
| Treatment, % | ||||
| Antiviral treatment | <0.001 | |||
| Yes | 19.2 | 18.7 | 21.7 | |
| Need ICU b care | <0.001 | |||
| Yes | 12.7 | 3.5 | 6.7 | |
| Invasive mechanical ventilation | <0.01 | |||
| Yes | 12.1 | 3.2 | 6.3 | |
| Disease progression, % | <0.001 | |||
| Home monitoring | 15.5 | 16.1 | 12.3 | |
| In treatment | 56.6 | 58.4 | 47.2 | |
| Medical release | 2.7 | 2.8 | 2.6 | |
| Severe case | 16.4 | 15.1 | 22.9 | |
| Death | 8.8 | 7.5 | 15.0 |
Mean ± SD.
ICU, intensive care unit.
Table 3 shows that after adjusting for age, sex, smoking status, history of chronic diseases (cardiovascular disease, chronic kidney disease, immunosuppression), place of care, USMER, and drug treatment, patients with obesity showed a 1.43‐fold higher odds of developing severe COVID‐19 on admission compared with patients without obesity. Also, patients with diabetes had a 1.87‐fold higher odds of severe COVID‐19 on admission compared with those without diabetes. Finally, patients with hypertension had a 1.77‐fold higher odds of severe COVID‐19 on admission compared with those without hypertension.
TABLE 3.
Association of obesity, diabetes, and hypertension with severe COVID‐19 on admission
| Variable | Age‐adjusted model | Multivariate model | ||
|---|---|---|---|---|
| OR | 95% CI | OR | 95% CI | |
| Obesity a | ||||
| Total | ||||
| Without obesity | 1.0 | — | 1.0 | — |
| With obesity | 1.76 | 1.39, 2.23 | 1.43 | 1.11, 1.83 |
| Men | ||||
| Without obesity | 1.0 | — | 1.0 | — |
| With obesity | 2.25 | 1.55, 3.25 | 1.75 | 1.15, 2.57 |
| Women | ||||
| Without obesity | 1.0 | — | 1.0 | — |
| With obesity | 1.52 | 1.12, 2.08 | 1.30 | 1.03, 1.81 |
| Diabetes b | ||||
| Total | ||||
| Without diabetes | 1.0 | — | 1.0 | — |
| With diabetes | 3.53 | 2.78, 4.48 | 1.87 | 1.41, 4.26 |
| Men | ||||
| Without diabetes | 1.0 | — | 1.0 | — |
| With diabetes | 2.61 | 1.73, 3.81 | 1.87 | 1.19, 2.94 |
| Women | ||||
| Without diabetes | 1.0 | — | 1.0 | — |
| With diabetes | 2.10 | 1.52, 2.89 | 1.86 | 1.30, 2.64 |
| Hypertension c | ||||
| Total | ||||
| Without hypertension | 1.0 | — | 1.0 | — |
| With hypertension | 2.12 | 1.68, 2.68 | 1.77 | 1.37, 2.29 |
| Men | ||||
| Without hypertension | 1.0 | — | 1.0 | — |
| With hypertension | 2.85 | 1.96, 4.15 | 2.33 | 1.56, 3.49 |
| Women | ||||
| Without hypertension | 1.0 | — | 1.0 | — |
| With hypertension | 1.73 | 1.28, 2.34 | 1.50 | 1.07, 2.08 |
Adjusted for age, sex, smoking status, history of chronic diseases (diabetes, hypertension, cardiovascular disease, chronic kidney disease, immunosuppression), place of care, USMER unit, date of symptom onset, and drug treatment.
Adjusted for age, sex, smoking status, obesity, history of chronic diseases (hypertension, cardiovascular disease, chronic kidney disease, immunosuppression), place of care, USMER unit, date of symptom onset, and drug treatment.
Adjusted for age, sex, smoking status, obesity, history of chronic diseases (diabetes, cardiovascular disease, chronic kidney disease, immunosuppression), place of care, USMER unit, date of symptom onset, and drug treatment.
OR, odds ratio; USMER, system of selected health units that monitor respiratory diseases.
We examined the statistical interaction between age (≤50 vs. >50 years) and the presence of obesity on their odds for severe COVID‐19 on admission. The reference‐group members did not have obesity and were ≤ 50 years of age. Relative to the reference group, the OR of the group with obesity (also ≤50 years) was 1.88 (95% CI: 1.26‐2.55). The OR for the group without obesity > 50 years of age was 1.51 (95% CI: 1.03‐2.20) versus 1.67 for the group with obesity > 50 years (95% CI: 1.01‐2.63) (Figure 2) (P for interaction = 0.03). Additionally, we evaluated the possible interaction between hypertension and diabetes with age. However, these interactions were not statistically significant.
Figure 2.
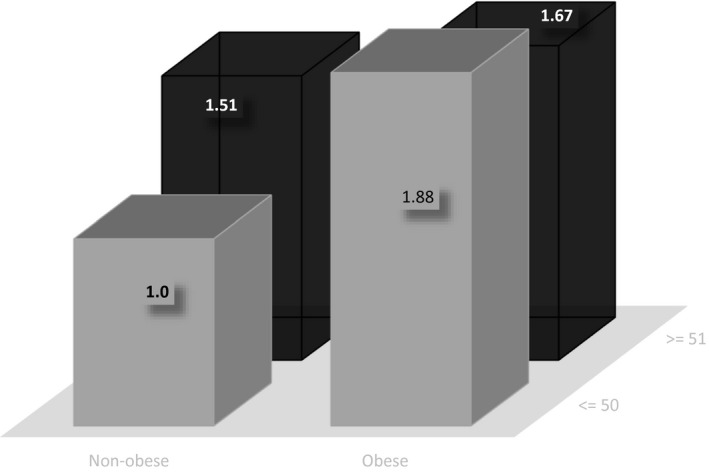
Joint association of obesity and age (≤50 and >50 years) with severe coronavirus disease 2019 (COVID‐19) on admission in the Mexican population. The reference group for comparisons was composed of subjects without obesity who were 50 years of age or younger. Odds ratios were adjusted for age (years), sex, smoking status, history of chronic diseases (hypertension, diabetes, cardiovascular disease, chronic kidney disease, immunosuppression, place of care, unit of the system of selected health units that monitor respiratory diseases (USMER), date of symptom onset, and drug treatment.
Finally, we performed a sensitivity analysis according to the origin of the patients (USMER vs. non‐USMER). Although the patients from USMER institutions had higher odds of severe COVID‐19 on admission, they were not statistically different from those who came from non‐USMER institutions (data not shown).
Discussion
To our knowledge, this is the first study that evaluates the association of obesity, diabetes, and hypertension with severe COVID‐19 on admission among the Mexican population. Our data suggests that these conditions are associated with severe COVID‐19 on admission.
We observed that among patients with COVID‐19, 17.4% had obesity, 14.5% had diabetes, 18.9% had hypertension, and 2.8% had cardiovascular disease. With findings similar to our data, recent studies from China claim that hypertension was prevalent in approximately 17% of the patients with COVID‐19, whereas diabetes, cardiovascular diseases, and chronic kidney disease were present in 8%, 5%, and 2% of the cases, respectively (17, 18, 19, 20, 21).
Our analysis found that compared with patients without obesity, patients with obesity had 1.42 times the odds of developing severe COVID‐19 on admission. A recent study by Xu et al. (3) found a similar association between higher BMI and greater odds of developing severe disease. Compared with patients with normal weight, patients with obesity showed 2.42‐fold higher odds (95% CI: 1.42‐8.27; P = 0.004) of developing a severe form of COVID‐19 (3). Additionally, recent studies conducted by Kalligeros et al. (11) and Simmonet et al. (10) found that obesity is a risk factor for severe COVID‐19.
People living with diabetes have been considered at higher risk of infections (17), which is consistent with our finding of 1.87‐fold higher odds of developing severe COVID‐19 on admission in patients with diabetes. However, a recent systematic review and meta‐analysis found that the odds of developing a severe form of COVID‐19 in people living with diabetes was not statistically significant (OR = 2.07; 95% CI: 0.89‐4.82) (18).
Specific comorbidities associated with an increased risk of infection and severity of COVID have been reported. In this sense, one of the most commonly reported comorbidities was hypertension (22, 23). However, there is still no evidence that hypertension is related to the COVID‐19 results. Our data suggest that patients with hypertension had 77% greater odds of developing severe COVID‐19 on admission, compared with patients without hypertension.
To our knowledge, there are no previous studies in Mexico evaluating the joint effect of age and the presence of obesity. Our findings suggest that patients with obesity aged ≤50 years were 1.88 times more likely to develop severe COVID‐19 on admission, whereas patients with obesity aged >50 years were 1.67 times more likely to develop severe COVID‐19 on admission, compared with patients without obesity aged ≤50 years. A study found that patients with obesity under age 60 were more likely to be admitted to acute and critical care (24).
Despite the fact that the exact mechanisms by which obesity increases the severity of COVID‐19 have not been clearly described, multiple mechanisms may play a role. Patients with obesity have an affected respiratory physiology, involving decreased functional residual capacity and expiratory reserve volume, as well as hypoxemia and ventilation/perfusion abnormalities (25). Obesity and other chronic conditions, like diabetes, might be significant in the pathogenesis of COVID‐19 infection. The immune system, which plays an important role in the pathogenesis of COVID‐19, is also a crucial element in obesity‐induced adipose tissue inflammation. This inflammation of adipose tissue has been linked to metabolic dysfunction, which in turn has been associated with dyslipidemia, type 2 diabetes, hypertension, and cardiovascular disease (26, 27). In addition, a number of possible mechanisms have been proposed for the increased risk of severe clinical outcomes in COVID‐19 for people living with diabetes, including elevated plasmin levels, an imbalance of angiotensin‐converting enzyme 2 and cytokines, reduced viral clearance, insulin resistance, and increased inflammatory markers (26, 27, 28, 29). Also, obesity and diabetes have been linked with impaired immune responses to viral and bacterial infections (6, 7, 19) like influenza A; therefore, by analogy, obesity may play an important role in COVID‐19 transmission and the severity of disease. For example, in the case of influenza A, obesity increases the duration of virus shedding; symptomatic patients with obesity shed the virus 42% longer than adults without obesity (26, 30). Moreover, diabetes was proven to be an important risk factor for mortality in patients infected with influenza A (19).
The present study has some important limitations. First, this is an administrative data set that was developed to monitor the epidemic and not specifically designed to follow patients; thus, information is only available at the moment in which people were registered in the system. Therefore, no information is available regarding the severity of the patients later on. Second, despite the fact that the data are from patients from all over Mexico, patients who were asymptomatic or treated at home are not part of the data, so our study represents only the more severe cases of COVID‐19, and the results cannot be extrapolated to nonsevere COVID‐19 cases. Furthermore, because sentinel units were not randomly selected, our findings are not likely to be representative of the entire population. Third, in most cases, obesity was defined by self‐report. In this sense, a classification error cannot be ruled out, and this would bias the observed associations toward the null value. In addition, self‐report of obesity may be the reason behind the low obesity prevalence in the present study, compared with the prevalence observed at the national level. An additional potential source of bias is the origin of the patients’ information (USMER vs. non‐USMER); however, the separate sensitivity analyses of patients according to their origin found consistent results between groups. Notwithstanding the limitations, this study has some strengths. First, comparative studies between obesity and chronic conditions associated with severe disease caused by SARS‐CoV‐2 are scarce; therefore, our results may help identify these associations. Second, the sample size permitted a multivariable analysis, consequently reducing the possibility of confounding factors. Third, although it is probable that our findings are not representative of the entire population, our study contains nationwide data.
In conclusion, obesity, diabetes, and hypertension—important public health problems in Mexico—were significantly associated with severe COVID‐19 on admission. In addition, the association of obesity was stronger in patients ≤ 50 years of age. As previously suggested (26), this pandemic has shown us that more must be done to combat and prevent obesity in our societies in order to reduce the burden of chronic diseases and adverse outcomes to viral pandemics. Finally, our data suggest the need for studies that evaluate the mechanisms associated with increased severity of COVID‐19 in patients with obesity, as well as the need for prevention strategies for these patients.
Disclosure
The authors declared no conflict of interest.
Author contributions
SB, HL‐G, TB‐G, JAR and ED‐G came up with the idea and analysis plan for the present study; RC‐A, JA‐Z, CZ‐J, DD‐L, TV‐R, RG‐V, KR‐G, CE‐M, and HL‐G had full access to all data and take responsibility for the integrity of the data; ED‐G and SB conducted the data analysis; EDG and SB contributed to writing the first version of the manuscript; ED‐G, RC‐A, JA‐Z, CZ‐J, DD‐L, HL‐G, TB‐G, JAR, and SB critically revised the manuscript; and all authors reviewed and approved the final version.
Acknowledgments
We thank Mariel White for her support in proofreading. Also, we thank Ana Estudillo for her time and support during the present analysis. The data that support the findings of this study are available from the corresponding author on reasonable request. A proposal with a detailed description of study objectives and a statistical analysis plan will be needed to evaluate requests for our data. The corresponding author will decide on the basis of these materials.
References
- 1. Lipsitch M, Swerdlow DL, Finelli L. Defining the epidemiology of Covid‐19 ‐ studies needed. N Engl J Med 2020;382:1194‐1196. [DOI] [PubMed] [Google Scholar]
- 2. Feng Y, Ling Y, Bai T, et al. COVID‐19 with different severity: a multi‐center study of clinical features. Am J Respir Crit Care Med 2020;201:1380‐1388. [DOI] [PMC free article] [PubMed] [Google Scholar]
- 3. Cai Q, Chen F, Wang T, et al. Obesity and COVID‐19 severity in a designated hospital in Shenzhen, China. Diabetes Care 2020;43:1392‐1398. [DOI] [PubMed] [Google Scholar]
- 4. Flores M, Barquera S, Carrión C, et al. C‐reactive protein concentrations in Mexican men and women: high prevalence of a cardiovascular risk factor. Salud Publica Mex 2007;49(suppl 3):S348‐S360. [Google Scholar]
- 5. Denova‐Gutiérrez E, Vargas‐Chanes D, Hernández S, Muñoz‐Aguirre P, Napier D, Barquera S. Linking socioeconomic inequalities and type 2 diabetes through obesity and lifestyle factors among Mexican adults: a structural equations modeling approach. Salud Publica Mex 2020;62:192‐202. [DOI] [PubMed] [Google Scholar]
- 6. Huttunen R, Syrjänen J. Obesity and the outcome of infection. Lancet Infect Dis 2010;10:442‐443. [DOI] [PubMed] [Google Scholar]
- 7. Milner JJ, Beck MA. The impact of obesity on the immune response to infection. Proc Nutr Soc 2012;71:298‐306. [DOI] [PMC free article] [PubMed] [Google Scholar]
- 8. Louie JK, Acosta M, Samuel MC, et al. A novel risk factor for a novel virus: obesity and 2009 pandemic influenza A (H1N1). Clin Infect Dis 2011;52:301‐312. [DOI] [PubMed] [Google Scholar]
- 9. Shamah‐Levy T, Campos‐Nonato I, Cuevas‐Nasu L, et al. Overweight and obesity in Mexican vulnerable population. Results of Ensanut 100k. Salud Publica Mex 2019;61:852‐865. [DOI] [PubMed] [Google Scholar]
- 10. Simonnet A, Chetboun M, Poissy J, et al. High prevalence of obesity in severe acute respiratory syndrome coronavirus‐2 (SARS‐CoV‐2) requiring invasive mechanical ventilation. Obesity (Silver Spring) 2020;28:1195‐1199. [DOI] [PMC free article] [PubMed] [Google Scholar]
- 11. Kalligeros M, Shehadeh F, Mylona EK, et al. Association of obesity with disease severity among patients with COVID‐19. Obesity (Silver Spring) 2020;28:1200‐1204. [DOI] [PMC free article] [PubMed] [Google Scholar]
- 12.Pan American Health Organization. Guía operativa para la vigilancia centinela de la Infección Respiratoria Aguda Grave (IRAG). Published September 2014. Accessed April 12, 2020. https://www.paho.org/revelac-i/wp-content/uploads/2015/10/2015-cha-guia-operativa-vigilancia-centinela-irag.pdf.
- 13. Bello‐Chavolla OY, Bahena‐López JP, Antonio‐Villa NE, et al. Predicting mortality due to SARS‐CoV‐ 2: A mechanistic score related obesity and diabetes to COVID‐19 outcomes in Mexico. J Clin Endocrinol Metab 2020;105:dgaa346. doi: 10.1210/clinem/dgaa346 [DOI] [PMC free article] [PubMed] [Google Scholar]
- 14. Government of Mexico, Secretary of Health . Lineamiento estandarizado para la vigilancia epidemiológica y por laboratorio de la enfermedad respiratoria viral. Accessed April 12, 2020. https://www.gob.mx/salud/documentos/lineamiento-estandarizado-para-la-vigilancia-epidemiologica-y-por-laboratorio-de-la-enfermedad-respiratoria-viral
- 15. World Health Organization . Laboratory testing of human suspected cases of novel coronavirus (nCoV) infection: interim guidance, 10 January 2020. Accessed April 16, 2020. https://apps.who.int/iris/handle/10665/330374
- 16. Corman V, Bleicker T, Brünink S, Drosten C. Diagnostic detection of Wuhan coronavirus 2019 by real‐time RT‐PCR. Published January 13, 2020. 2020. https://www.who.int/docs/default‐source/coronaviruse/wuhan‐virus‐assay‐v1991527e5122341d99287a1b17c111902.pdf [Google Scholar]
- 17. Yang J, Zheng Y, Gou X, et al. Prevalence of comorbidities in the Novel Wuhan Coronavirus (COVID‐19) infection: a systematic review and meta‐analysis. Int J Infect Dis 2020;94:91‐95. [DOI] [PMC free article] [PubMed] [Google Scholar]
- 18. Guan WJ, Ni ZY, Hu Y, et al. Clinical Characteristics of coronavirus disease 2019 in china. N Engl J Med 2020;382:1708‐1720. [DOI] [PMC free article] [PubMed] [Google Scholar]
- 19. Gupta R, Ghosh A, Singh AK, Misra A. Clinical considerations for patients with diabetes in times of COVID‐19 epidemic. Diabetes Metab Syndr 2020;14:211‐212. [DOI] [PMC free article] [PubMed] [Google Scholar]
- 20. Deng SQ, Peng HJ. Characteristics of and public health responses to the coronavirus disease 2019 outbreak in China. J Clin Med 2020;9:575. doi: 10.3390/jcm9020575 [DOI] [PMC free article] [PubMed] [Google Scholar]
- 21. Ruan Q, Yang K, Wang W, Jiang L, Song J. Clinical predictors of mortality due to COVID‐19 based on an analysis of data of 150 patients from Wuhan, China. Intensive Care Med 2020;46:846‐848. [DOI] [PMC free article] [PubMed] [Google Scholar]
- 22. Zhou F, Yu T, Du R, et al. Clinical course and risk factors for mortality of adult inpatients with COVID‐19 in Wuhan, China: a retrospective cohort study. Lancet 2020;395:1054‐1062. [DOI] [PMC free article] [PubMed] [Google Scholar]
- 23. Wu C, Chen X, Cai Y, et al. Risk factors associated with acute respiratory distress syndrome and death in patients with coronavirus disease 2019 pneumonia in Wuhan, China. JAMA Intern Med 2020;180:934‐943. [DOI] [PMC free article] [PubMed] [Google Scholar]
- 24. Lighter J, Phillips M, Hochman S, et al. Obesity in patients younger than 60 years is a risk factor for Covid‐19 hospital admission. Clin Infect Dis 2020;71:896‐897. [DOI] [PMC free article] [PubMed] [Google Scholar]
- 25. Parameswaran K, Todd DC, Soth M. Altered respiratory physiology in obesity. Can Respir J 2006;13:203‐210. [DOI] [PMC free article] [PubMed] [Google Scholar]
- 26. Kassir R. Risk of COVID‐19 for patients with obesity. Obes Rev 2020;21:e13034. doi: 10.1111/obr.13034 [DOI] [PMC free article] [PubMed] [Google Scholar]
- 27. Sattar N, McInnes IB, McMurray JJV. Obesity is a risk factor for severe COVID‐19 infection: multiple potential mechanisms. Circulation 2020;142:4‐6. [DOI] [PubMed] [Google Scholar]
- 28. Ji H‐L, Zhao R, Matalon S, Matthay MA. Elevated plasminogen as a common risk factor for COVID‐19 susceptibility. Physiol Rev 2020;100:1065‐1075. [DOI] [PMC free article] [PubMed] [Google Scholar]
- 29. Hanff TC, Harhay MO, Brown TS, Cohen JB, Mohareb AM. Is there an association between COVID‐19 mortality and the renin‐angiotensin system? A call for epidemiologic investigations. Clin Infect Dis. 2020;71:870‐874. [DOI] [PMC free article] [PubMed] [Google Scholar]
- 30. Misumi I, Starmer J, Uchimura T, Beck MA, Magnuson T, Whitmire JK. Obesity expands a distinct population of T cells in adipose tissue and increases vulnerability to infection. Cell Rep 2019;27:514‐524.e5. [DOI] [PMC free article] [PubMed] [Google Scholar]