

Abstract
Around implantation, the epiblast (Epi) transits from naïve to primed pluripotency, before giving rise to the three germ layers. How chromatin is reconfigured during this developmental window remains poorly understood. We performed a genome-wide investigation of chromatin landscapes during this period. We find that enhancers in ectoderm are already pre-accessible in embryonic day 6.5 (E6.5) Epi when cells enter a primed pluripotent state. Unexpectedly, strong trimethylation of histone H3 at lysine 4 (H3K4me3) emerges at developmental gene promoters in E6.5 Epi and positively correlates with H3K27me3, thus establishing bivalency. These genes also show enhanced spatial interactions. Both the strong bivalency and spatial clustering are virtually absent in preimplantation embryos and are markedly reduced in fate-committed lineages. Finally, we show that KMT2B is essential for establishing bivalent H3K4me3 at E6.5 but becomes partially dispensable later. Its deficiency leads to impaired activation of developmental genes and subsequent embryonic lethality. Thus, our data characterize lineage-specific chromatin reconfiguration and a unique chromatin state for primed pluripotency.
Early embryonic lineage specification provides the foundation for progenitor cells that give rise to all somatic tissues1. In mammals, the formation and separation of the inner cell mass (ICM) and the trophectoderm (TE) represent the first lineage specification event. The ICM then gives rise to epiblast and primitive endoderm cells2. The anterior Epi develops into ectoderm by E7.5, while posterior Epi forms the primitive streak (PS), which then differentiates into mesoderm and endoderm through gastrulation3,4. Primitive endoderm gives rise to visceral endoderm (VE) and parietal endoderm. VE cells provide developmental cues and further develop into the visceral yolk sac to support metabolic nutrition for later embryonic development5. Parietal endoderm contributes to the transient parietal yolk sac. How cell fates become committed during this key developmental period is a fundamental question in biology.
Previous studies in mice showed that pluripotency transiently emerges in the ICM and persists in a subset of cells until germ layer specification6. To understand the nature of pluripotency, various types of stem cells were derived from early lineages at different stages. For example, mouse embryonic stem cells (mESCs) cultured in 2i medium are believed to represent naïve pluripotency, while those cultured in serum, as well as epiblast stem cells (EpiSCs) and epiblast-like cells (EpiLCs), are considered to possess primed pluripotency7. These different types of pluripotent stem cells have distinct transcriptomes and epigenomes including three-dimensional chromatin structure8–10. One major technical hurdle to define the exact states of these pluripotent stem cells is the lack of clear characterization of chromatin states for naïve and primed pluripotency in vivo, mainly due to the limited experimental materials and the complexity of lineages in early embryos.
Histones and their chemical modifications play important roles in many fundamental biological processes, such as transcription, DNA replication and DNA repair11. H3K4me3 at permissive promoters can interact with the subunit of transcription factor II D (TFIID) to regulate gene transcription12. In mammals, H3K4me3 is deposited by a group of histone methyltransferases including SET1A/B and the MLL family (MLL1–MLL4)13. Usually, histone acetylation is enriched at active promoters and enhancers14. By contrast, H3K27me3, a repressive histone mark catalyzed by Polycomb repressive complex 2 (PRC2), is predominantly deposited at developmental gene promoters15. Mutations of these histone-modifying enzymes frequently lead to embryonic lethality in mice and tumorigenesis in humans13,16,17. In mammals, a subset of promoters are marked by both H3K4me3 and H3K27me3, which are termed as bivalent promoters18,19. KMT2B (MLL2) is responsible for specifically depositing H3K4me3 at bivalent promoters in mESCs20,21. Zygotic knockout or a knockout starting from E4.5 of Kmt2b leads to embryonic lethality by E10.5 (ref. 22). Surprisingly, the deficiency of Kmt2b after E11.5 is compatible with embryonic development23. Work in mESCs showed that deficiency of KMT2B does not affect pluripotency and developmental gene activation on retinoic-acid-induced differentiation20,21. In fact, SET1A (but not KMT2B) can deposit H3K4me3 at bivalent promoters on gene activation when bivalency resolves to monovalent H3K4me3 (ref. 24). However, a recent study showed that acute loss of Kmt2b results in the failure of ESC differentiation25. Thus, the roles of KMT2B and bivalent marks in the regulation of developmental genes remain elusive.
Histone modifications such as H3K4me3 and H3K27me3 undergo extensive reprogramming after fertilization in mammals26–31. Interestingly, the bivalent signature of H3K4me3 and H3K27me3 is largely absent from developmental gene promoters in mouse preimplantation embryos and reappears soon after implantation29. How the bivalent promoters are restored at developmental genes, and how they may regulate the expression of these key regulators are unclear. Furthermore, how the chromatin landscape reconfigures during germ layer specification in vivo remains poorly understood. Here, using highly sensitive chromatin analytical methods28,32,33, we conducted an integrated analysis of dynamic chromatin landscapes around gastrulation in mice. Our study provides high-resolution spatiotemporal views of the dynamic molecular architecture regulating early cell fate commitment. Moreover, we identified a unique chromatin state during the transition from naïve to primed pluripotency in vivo.
Results
Mapping global histone modifications and chromatin accessibility during mouse gastrulation.
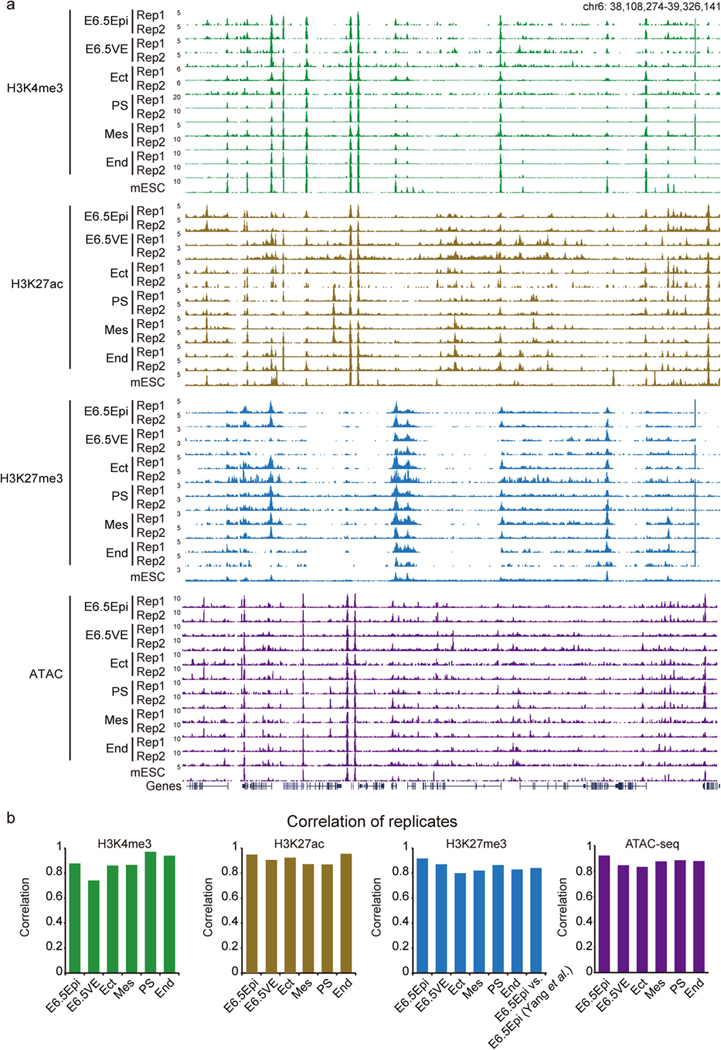
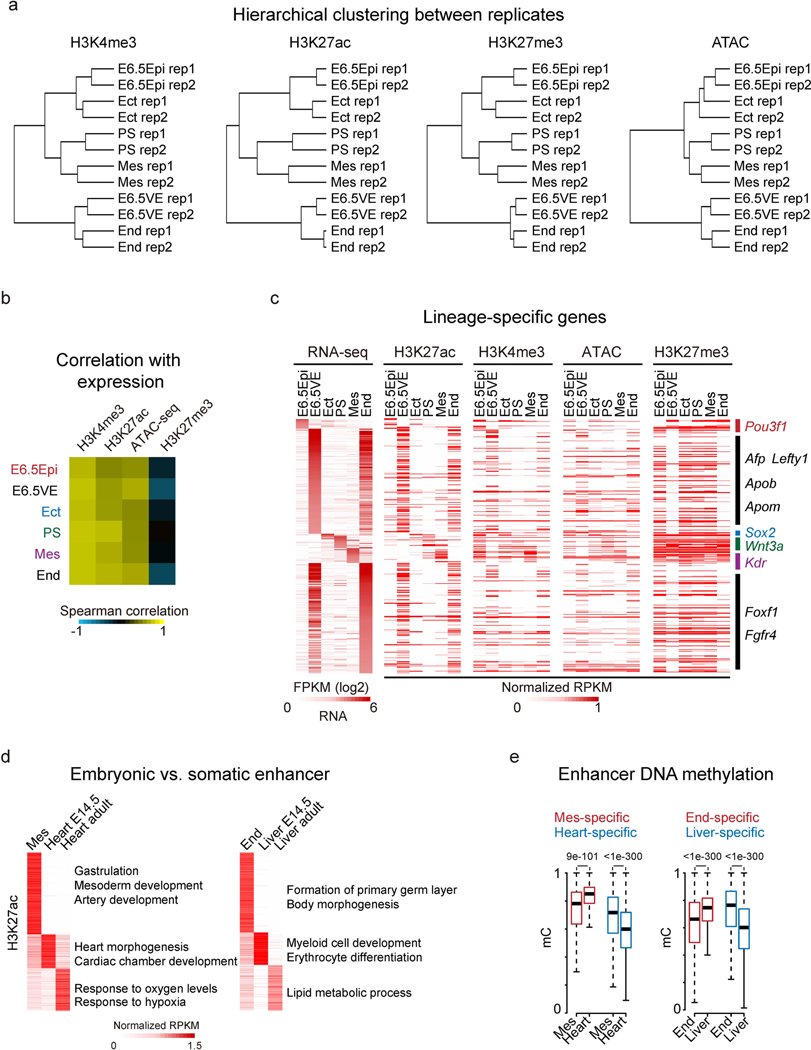
To investigate chromatin states during mammalian gastrulation, we first isolated multiple lineages from mouse early embryos including Epi and VE at E6.5, ectoderm (Ect), PS, mesoderm (Mes) and endoderm (End) at E7.5 (ref. 34) (Fig. 1a). We then conducted STAR chromatin immuno-precipitation–sequencing (ChIP-seq)28 for H3K4me3, H3K27ac and H3K27me3 in these tissues. To examine chromatin accessibility, we also performed miniATAC-seq32 in all tissues (Fig. 1a and Supplementary Table 1). We confirmed that these data are highly reproducible (Extended Data Fig. 1a,b). Hierarchical clustering analysis of lineage-dynamic promoters revealed that chromatin states are similar between replicates but are distinct among different lineages (Extended Data Fig. 2a). Globally, the enrichment of H3K4me3, H3K27ac and open chromatin signals at promoters are positively correlated with transcription (Extended Data Fig. 2b). By contrast, the repressive H3K27me3 anti-correlates with gene expression in all lineages. This is also true for lineage-specific genes (Fig. 1b and Extended Data Fig. 2c). As a control, H3K27ac and ATAC-seq signals, but not H3K27me3, are constitutively enriched at the promoter of a housekeeping gene, Psma1 (Fig. 1Fig.b). Notably, H3K4me3 is present at both active and silent promoters (although at lower enrichment) of developmental genes as reported19 (Fig. 1b). Note that due to the commonly observed batch variations of the global ChIP-seq data range even among replicates (Extended Data Fig. 1a), we manually adjusted the genome browser view scales based on the global data range (Methods). Hence, these results present lineage-specific chromatin maps during the primed pluripotency to gastrulation transition.
Fig. 1 |. Global view of chromatin states during gastrulation in mouse embryos.
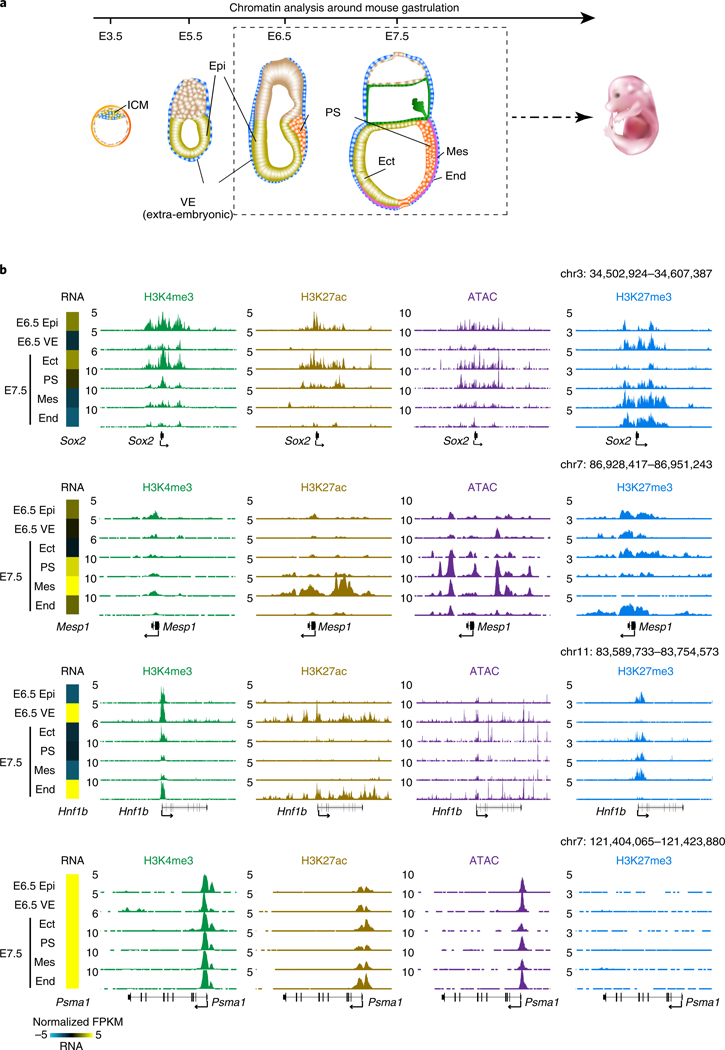
a, A schematic showing the overview of peri- to post-implantation embryonic development. Dashed box indicates isolated lineages in this study for chromatin analysis, including Epi (E6.5), VE (E6.5), Ect (E7.5), PS (E7.5), Mes (E7.5) and End (E7.5). b, Snapshots of UCSC genome browser showing the distributions of histone modifications (n = 2) and chromatin accessibility (n = 2) near lineage-specific marker genes. Gene expression34 is also displayed in heatmaps (log2 FPKM). The genome browser view scales were adjusted on the basis of the global data range.
Fig. 2 |. Epigenetic regulation of lineage-restricted putative enhancers.

a, Snapshots showing the enrichment of H3K4me3 (n = 2), H3K27ac (n = 2) and ATAC-seq (n = 2) signals at lineage-specific enhancers in postimplantation embryos. Ect-, PS- and Mes-specific putative enhancers are shaded. Arrows indicate the pre-accessible putative ectoderm enhancers in E6.5 Epi. b, The heatmaps showing the H3K27ac and ATAC-seq signals in the putative lineage-specific enhancers in E6.5 Epi and germ layers. GREAT analysis results for each lineage-specific enhancers are listed on the right. c, The enrichment of transcription factor-binding sites at putative enhancers in postimplantation embryos. Motif enrichment was identified from distal H3K27ac (n = 2) peaks against the whole genome. Motif enrichment is shown by the area of the circle, and the expression level of the corresponding transcription factor is color-coded.
Dynamic regulation of lineage-restricted enhancers.
Enhancers are known to play a critical role in regulating cell fate35. Using H3K27ac as a marker, we first identified putative enhancers for all embryonic tissues (Methods and Supplementary Table 2). GREAT analysis36 confirmed that stage-specific enhancers preferentially reside near genes functioning in corresponding lineages. For example, genes near ectoderm-specific enhancers are engaged for cerebellar lobule formation (P = 2.0 × 10⁻⁵), while mesodermal and endodermal enhancers are involved in heart morphogenesis (P =3.6 × 10⁻³³) and endoderm formation (P = 1.3 × 10⁻⁹), respectively (Fig. 2a,b). Furthermore, these enhancers show stage-specific accessibility (Fig. 2a,b). Interestingly, enhancers in ectoderm, but not in other lineages such as PS and mesoderm, appear to be already accessible in E6.5 epiblast (Fig. 2a,b). These results indicate that ectodermal enhancers may be primed in Epi and support the notion that ectoderm is the default fate for Epi37–39,40.
Next, we investigated factors that might act in these regulatory elements. Using HOMER41, we found motifs of distinct transcription factors enriched in these enhancers (Fig. 2c). For example, SOX2 and OCT4 (also known as POU5F1) are both enriched in the ectoderm, in agreement with their reported roles in ectoderm differentiation42. GATA and FOX factors are enriched in mesoderm and endoderm development, respectively43. Other notable candidate transcription factors include the TCF family (PS), which mediates Wnt signaling44, and SOX9 (ectoderm), which plays critical roles in the central nervous system and neural crest development45. MEIS1 (mesoderm) is involved in cardiac lineage specification and vascular patterning46. Thus, these data shed light on the potential transcription circuitry that regulates germ layer specification.
Finally, to assess how enhancers are dynamically regulated from embryonic to somatic tissues, we compared enhancers in early embryos at E7.5 to those previously identified in E14.5 embryonic tissues and adult tissues47 (Extended Data Fig. 2d). Encouragingly, genes near these enhancers are preferentially involved in temporally regulated functions. For example, E7.5 mesoderm-specific, E14.5 heart-specific and adult heart-specific enhancers tend to reside near genes involved in mesoderm development (P = 1 × 10−77) or gastrulation (P = 5 × 10−91), heart and cardiac chamber morphogenesis (P = 5 × 10−50) and response to oxygen levels and hypoxia (P=2 × 10−59), respectively (Extended Data Fig. 2d). Similarly, E7.5 endoderm-specific, E14.5 liver-specific and adult liver-specific enhancers are present near genes involved in the formation of the primary germ layer (P =6 × 10−45), myeloid cell development (P =7 × 10−42) and lipid metabolic process (P = 1 × 10−200), respectively. Moreover, by investigating DNA methylation levels34,48 at these tissue-specific enhancers, we found the temporal activities of these putative enhancers are inversely correlated with their DNA methylation levels at different stages (Extended Data Fig. 2e). To summarize, our chromatin analysis identified lineage-specific putative enhancers that are likely to regulate early lineage circuitry in a spatiotemporal-specific manner.
Strong bivalency marks primed pluripotent state.
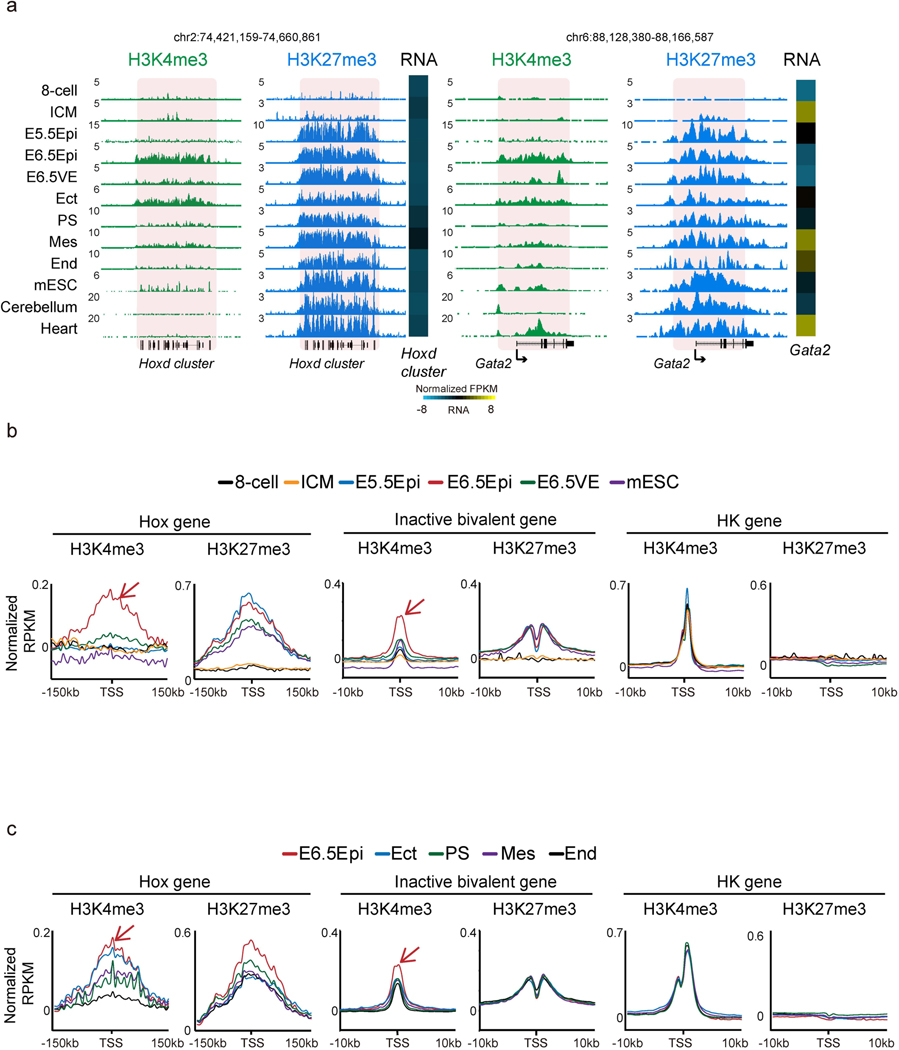
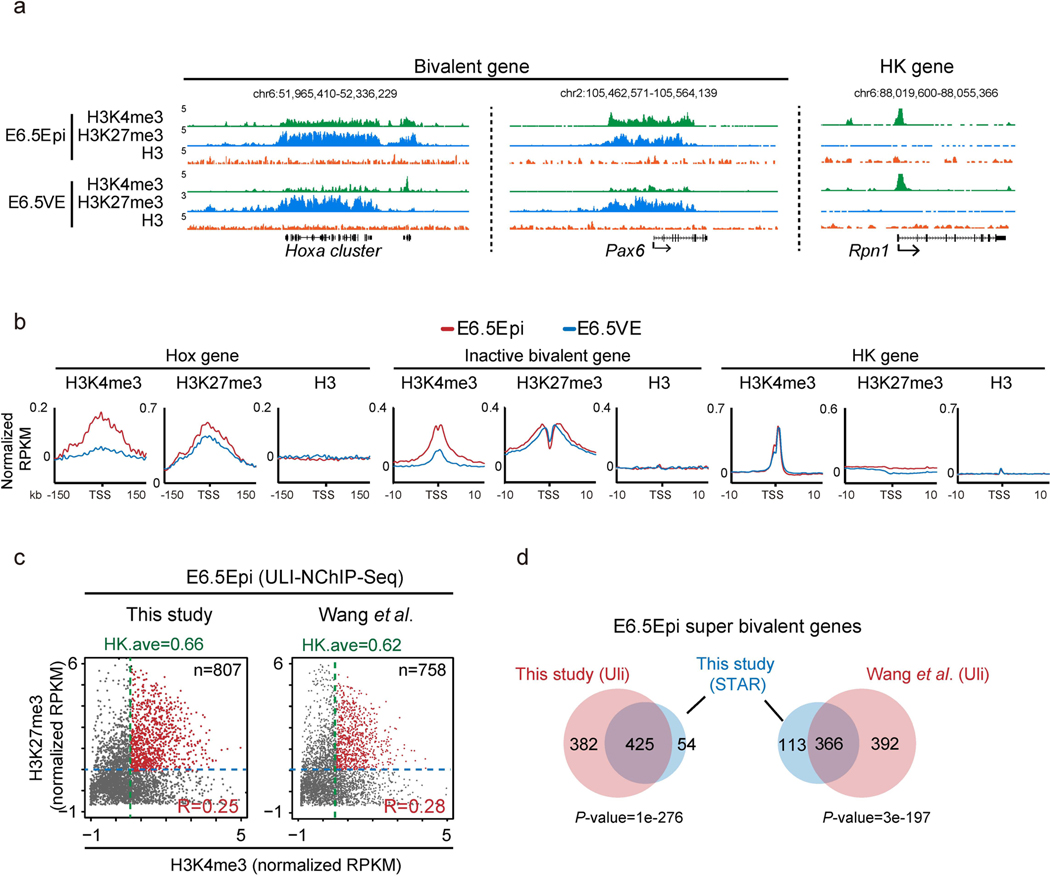
Developmental gene promoters are frequently marked by bivalent marks, including both H3K4me3 and H3K27me3 (ref. 19). Our previous work showed that bivalent marks are largely absent from developmental gene promoters in mouse preimplantation embryos but reappear after implantation29. To closely examine the kinetics of bivalency establishment, we also performed H3K4me3 and H3K27me3 ChIP-seq in E5.5 Epi. Interestingly, we found H3K27me3 first weakly emerges at developmental gene promoters in ICM and becomes strongly enriched in E5.5 Epi (Fig. 3a and Extended Data Fig. 3a). However, H3K4me3 is still not apparent at this stage. Surprisingly, we observed unusually strong H3K4me3 at developmental gene promoters in E6.5 Epi. By contrast, it is much weaker in E6.5 VE, mESCs and somatic lineages. This was observed at individual developmental gene promoters and also globally (Fig. 3a and Extended Data Fig. 3a,b). As a control, H3K4me3 enrichment is comparable for a housekeeping gene among all lineages (Fig. 3a, ‘RpnI’). Such strong H3K4me3 is also evident in E7.5 ectoderm (Fig. 3a and Extended Data Figs. 3a,c), indicating that germ layers may exist as a transitionary state between E6.5 Epi and somatic cells. The unusually strong H3K4me3 in E6.5 Epi is not due to different chromatin accessibility, as we used MNase digested mononucleosomal chromatin28 and a similar ChIP-seq experiment for H3 reveals comparable enrichment between E6.5 Epi and E6.5 VE (Extended Data Fig. 4a,b).
Fig. 3 |. Super bivalency identified in primed pluripotent Epi in vivo.
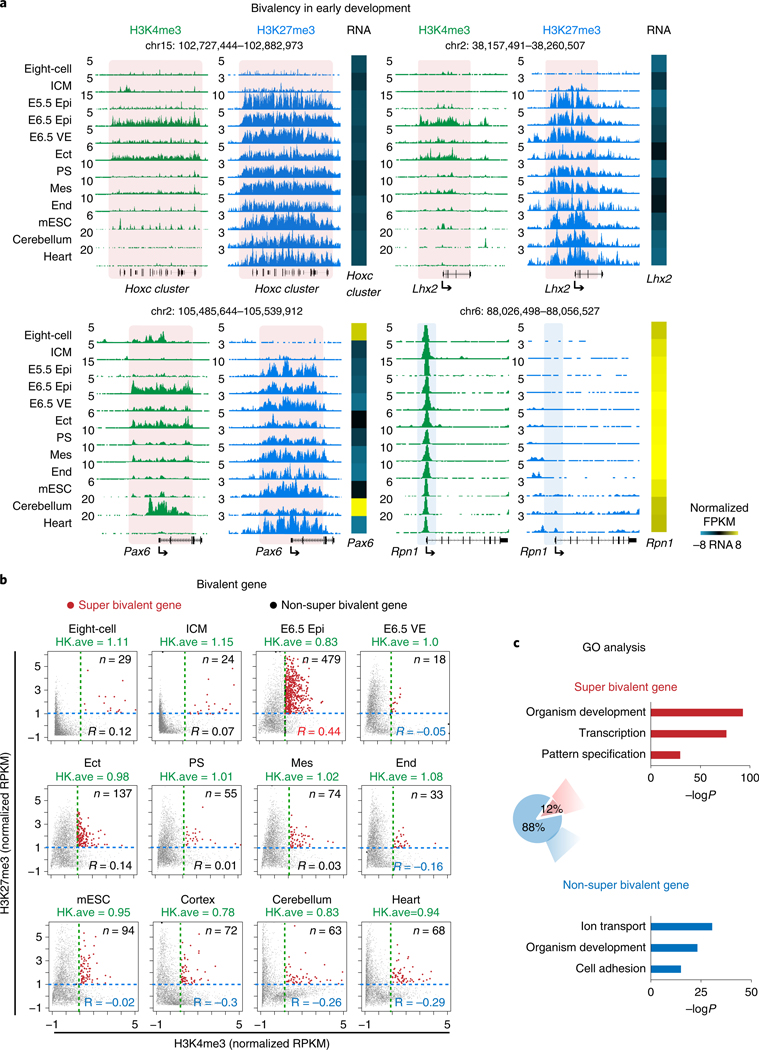
a, The UCSC genome browser views showing the enrichment of H3K4me3 (n = 2) and H3K27me3 (n = 2) at developmental genes Hoxc cluster, Lhx2, Pax6, as well as a housekeeping gene Rpn1 in mouse early embryos, mESCs and somatic tissues. Eight-cell and ICM data are adopted from previously published datasets28,29. mESCs, cerebellum and heart data are from ENCODE47. Heatmaps show the expression of corresponding genes in each lineage. The genome browser view scales were adjusted on the basis of the global data range. b, The scatter plots showing the enrichment of H3K4me3 and H3K27me3 of all bivalent genes (n = 3,992) for various cell types. The mESC and cortex ChIP-seq were performed with the same method as early lineages (STAR ChIP-seq). The average H3K4me3 enrichment of the housekeeping gene (HK.ave) is shown for each tissue. The numbers of super bivalent genes (top right) and Pearson correlations of H3K4me3 and H3K27me3 (bottom right) for each tissue are both shown. c, A pie chart showing the percentages of super and non-super bivalent genes in E6.5 Epi. The GO analysis results are also shown.
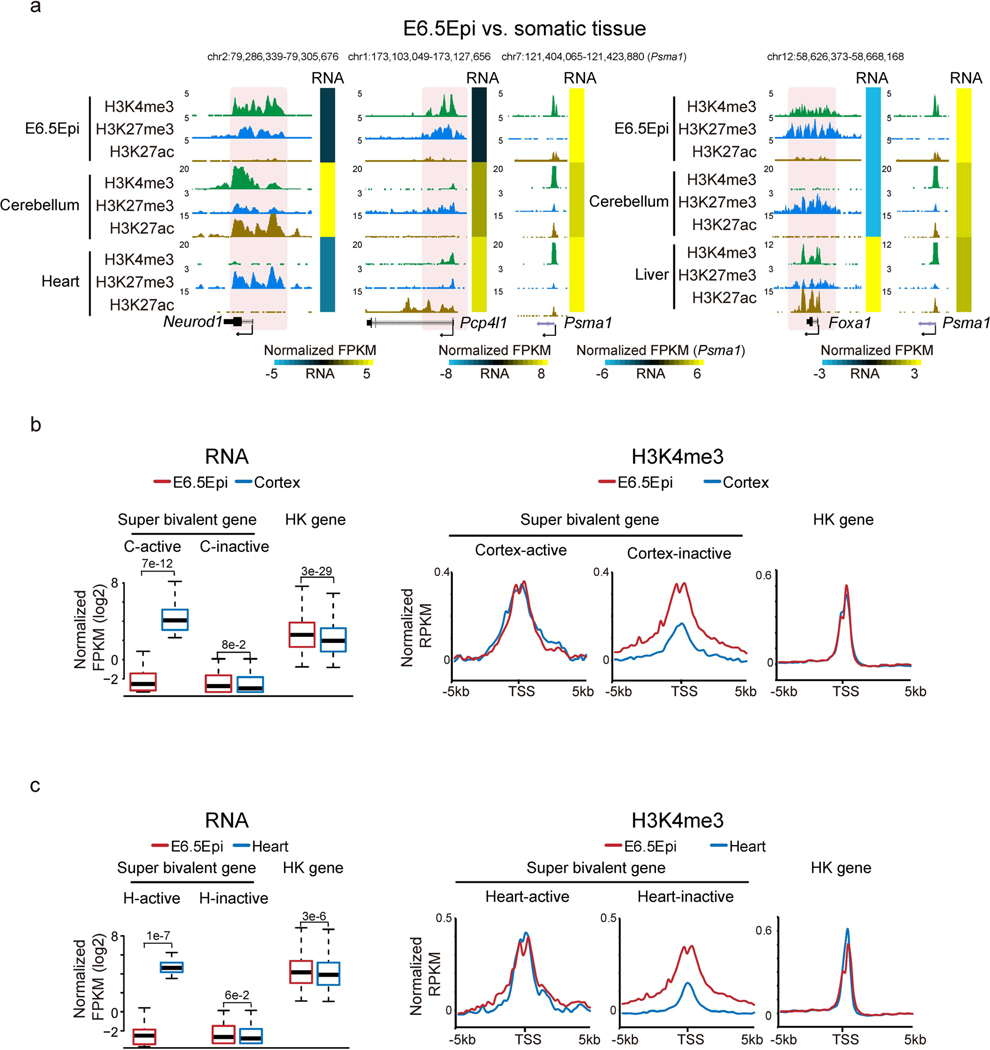
We then sought to systematically identify genes with unusually strong bivalency. We plotted H3K4me3 and H3K27me3 enrichment for all bivalent genes (identified from a panel of mouse cell types, n = 3,992, Methods) in each cell type. Strikingly, this already shows the uniqueness of bivalency in E6.5 Epi, where H3K4me3 and H3K27me3 globally have a strong positive correlation (R = 0.44, Pearson correlation) (Fig. 3b). Similar results were observed by a different ChIP-seq method, ULI-NChIP-seq49,50 (Extended Data Fig. 4c). The correlations are much lower or close to 0 in preimplantation embryos (which have very weak or nearly no H3K4me3 or H3K27me3, R = 0.07–0.12), germ layers (R = −0.16– 0.14) and mESCs (R = −0.02). The correlations further become negative in somatic cells (R = –0.26–0.3) (Fig. 3b). These data suggest that both marks strongly enrich on the same genes simultaneously in E6.5 Epi. In fate-committed cells, even though both marks are still present, bivalency tends to resolve with one mark becoming stronger while the other becomes weaker. A close examination revealed that H3K4me3 in E6.5 Epi at many bivalent genes is even stronger than the average H3K4me3 at housekeeping genes (Fig. 3b, ‘HK ave’). We then searched for bivalent genes in these tissues with unusually strong H3K4me3 and H3K27me3, as follows: (1) the promoter H3K4me3 enrichment is higher than that of average H3K4me3 at housekeeping genes; and (2) the promoter H3K27me3 is also strong (with an arbitrary cutoff, normalized reads per kilobase per million of sequenced reads (RPKM) > 1). Indeed, we found the number of such strong bivalent genes is much higher in E6.5 Epi (n = 479, Supplementary Table 3), compared to other tissues (n = 18–137) (Fig. 3b). We therefore termed these genes with strong bivalency as ‘super bivalent genes’, and the related bivalency and H3K4me3 as ‘super bivalency’ and ‘super bivalent H3K4me3, respectively. The super bivalency in E6.5 Epi was also captured by ULI-NChIP-seq (Extended Data Fig. 4c,d). The enrichment of super bivalent H3K4me3 in E6.5 Epi is comparable to that when the corresponding genes become activated at later stages such as in cortex or heart (Fig. 3a, compare Pax6 in E6.5 Epi and cerebellum, and Extended Data Fig. 5a–c). Gene ontology (GO) analysis showed that super bivalent genes in E6.5 Epi are enriched for organism development, transcription and pattern specification, whereas non-super bivalent genes are involved in ion transport, cell adhesion and organism development (Fig. 3c). In summary, these data suggest that E6.5 Epi acquires both primed pluripotency and strong bivalency.
Loss of bivalent H3K4me3 is associated with aberrant developmental gene activation.
Previous studies showed that KMT2B is specifically responsible for depositing H3K4me3 at bivalent promoters in mESCs20,21. Coincidently, Kmt2b is upregulated after implantation and is ubiquitously expressed among all postimplantation tissues we examined (Extended Data Fig. 6a). We knocked out Kmt2b by using CRISPR in mouse zygotes (Extended Data Fig. 6b, left) and transferred the resulting embryos to foster mothers before being dissected for Epi at E6.5 (Methods). H3K4me3 ChIP-seq was conducted in wild-type (WT) and Kmt2b−/− embryos identified through genotyping (Extended Data Fig. 6b, right). Remarkably, H3K4me3 is globally abolished at most bivalent genes in E6.5 Epi of Kmt2b−/− embryos for both super and non-super bivalent genes, while that at H3K4me3-only monovalent genes is not affected (Fig. 4a and Extended Data Fig. 6c). For example, H3K4me3 is lost at promoters of Pax6 and Nkx2–9, but not at a housekeeping gene Pmsa1 (Fig. 4b). The reduction of H3K4me3 was not due to developmental delay, as Kmt2b−/− embryos did not show obvious developmental defects in morphology or global transcription until around E9.5 (Extended Data Fig. 6d,e). These data suggest that bivalent H3K4me3 strictly requires KMT2B in E6.5 Epi.
Fig. 4 |. Loss of super bivalent H3K4me3 is associated with aberrant activation of developmental genes.
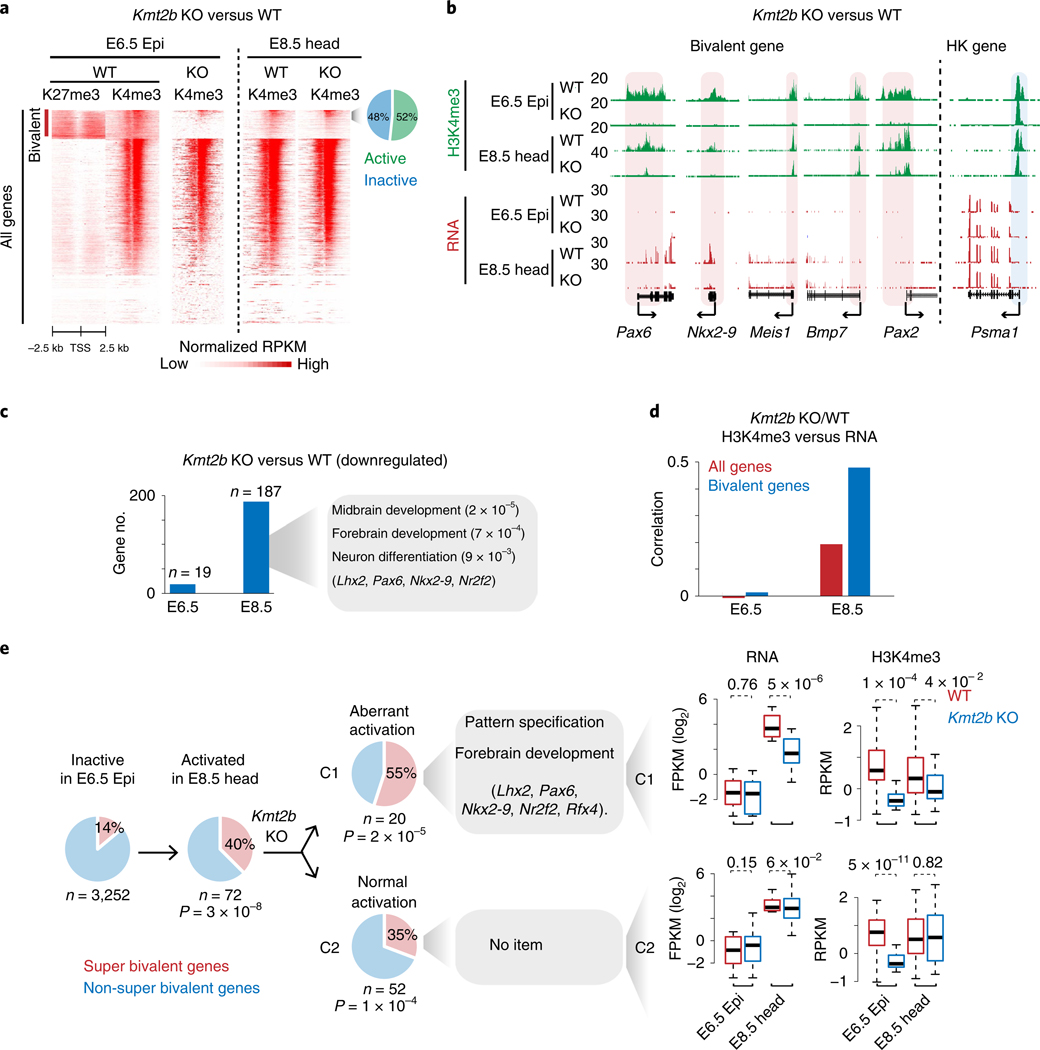
a, Heatmaps showing H3K27me3 and H3K4me3 enrichment at all promoters for WT and Kmt2b−/− embryos. The pie chart shows the percentages of active and inactive bivalent genes with enriched H3K4me3 (normalized RPKM > 0.5) in E8.5 Kmt2b−/− tissues. b, Snapshots showing H3K4me3 and gene expression at developmental genes for both WT and Kmt2b−/− embryos. The housekeeping gene Psma1 is shown as a control. Promoter H3K4me3 is shaded. The genome browser view scales were adjusted on the basis of the global data range. c, Bar charts showing the numbers of genes that are downregulated in E6.5 Epi and E8.5 head tissues in Kmt2b−/− embryos. GO and example genes at E8.5 are listed. d, Bar charts showing the Spearman correlation of changes between promoter H3K4me3 and gene expression for all genes and bivalent genes in WT (n = 3) and Kmt2b−/− (n = 3 for E6.5, n = 2 for E8.5) embryos. e, The pie charts show the percentages of super and non-super bivalent genes for inactive (FPKM < 2, n = 3,252) bivalent genes in E6.5 Epi (left). Among 72 genes that are activated (FPKM > 5) in E8.5 head (middle), 52 (C2) are activated normally while 20 (C1) show defective activation in Kmt2b−/− E8.5 embryos (right). The GO terms are also listed. The P values (hypergeometric test) show the enrichment of super bivalent genes in C1 or C2 (versus all inactive bivalent genes in E6.5 Epi). Boxplots show the gene expression and H3K4me3 enrichment in C1 or C2 for WT (n = 2) and Kmt2b−/− (n = 2) embryos. The P values were calculated by a one-tailed t-test. The median of each dataset is indicated by the center line. The bottom, top edges and whiskers represent the 25th and 75th percentiles and 1.5 times the interquartile range (IQR), respectively.
Notably, Kmt2b−/− mouse embryos die around E10.5 (ref. 22), indicating that major defects occur later in development. Intriguingly, while tamoxifen-induced knockout of Kmt2b at E4.5 causes similar embryonic lethality as Kmt2b−/− embryos, the deficiency of KMT2B after E11.5 is surprisingly compatible with embryonic development23. To assess why Kmt2b is only required at a defined developmental window, we dissected head tissues at E8.5 and performed H3K4me3 ChlP-seq in WT and mutant embryos. Surprisingly, while H3K4me3 remains globally downregulated at bivalent promoters in the mutants (Extended Data Fig. 6c), it is partially restored at a fraction of developmental gene promoters in E8.5 head tissues. These genes include not only actively transcribed genes, but also inactive bivalent genes, as exemplified by Meis1, Bmp7 and Pax2 (Fig. 4a,b). These data indicate that KMT2B becomes dispensable for some bivalent H3K4me3 at E8.5, when presumably other H3K4me3 methyltransferases may start to compensate.
To assess if losing bivalent H3K4me3 affects gene expression, we performed RNA-seq for both WT and Kmt2b−/− embryos in E6.5 Epi and E8.5 head tissues. Consistent with the notion that Kmt2b−/− embryos can survive to E10.5 (ref. 22), we only identified small numbers of genes that are consistently downregulated and upregulated in two replicates in E6.5 Epi (19 and 101, respectively, two-fold change, P< 0.05, Supplementary Table 4) (Fig. 4c and Methods). This is in contrast with the widespread loss of H3K4me3 at bivalent genes. In fact, a global analysis revealed no correlation between changes in gene expression and corresponding changes of promoter H3K4me3 (Fig. 4d), suggesting that the loss of bivalent H3K4me3 does not have a profound impact in transcription at E6.5. A larger impact on transcription was found in E8.5 head tissues (two replicates), where 187 and 81 genes are downregulated and upregulated in the mutants, respectively. The downregulated genes involve those that function in midbrain development (P = 2.1 × 10⁻⁵), neuron differentiation (P =9.3 × 10⁻³) and forebrain development (P =7.3 × 10⁻⁴), including known brain regulators such as Lhx2, Pax6, Nkx2–9 and Nr2f1/2 (Fig. 4c). Interestingly, the alterations of promoter H3K4me3 and gene expression are positively correlated in E8.5 head tissues, especially for bivalent genes (Fig. 4d). Furthermore, the percentage of bivalent genes among downregulated genes in Kmt2b−/− E8.5 head is moderately higher than background (24% versus 17.6%). A careful analysis showed that a total of 72 bivalent genes are activated in E8.5 head tissues (silenced at E6.5 Epi) (Fig. 4e). These bivalent genes are enriched for super bivalent genes (40% versus 14% of background, P = 3 × 10⁻⁸, hypergeometric test). Among these 72 bivalent genes, 20 genes (27.8%) failed to be properly activated in Kmt2b−/− mutants. Consistently, these genes failed to acquire H3K4me3 in E8.5 head tissues (Fig. 4e, C1). Despite the small number, these 20 genes are strongly enriched for super bivalent genes (55%, P =2 × 10⁻⁵) and those functioning in pattern specification (P = 4 × 10⁻⁸) and forebrain development (P = 1 × 10⁻⁹), including key regulators such as Lhx2 and Pax6 (Fig. 4e, ‘C1’). By contrast, 52 (72.2%) bivalent genes are still properly activated in Kmt2b−/− embryos at E8.5, when H3K4me3 is re-acquired (Fig. 4e, ‘C2’). However, they show no significant enrichment of GO terms. Thus, super bivalent genes are preferentially activated at E8.5, among which a significant portion depends on KMT2B for proper activation.
TET facilitates the establishment of strong bivalency.
Notably, KMT2B usually only deposits weak H3K4me3 to bivalent promoters (such as E8.5 head tissues or mESCs, Fig. 3b)20,21, suggesting additional mechanisms are involved in establishing strong bivalency specifically in E6.5 Epi. Interestingly, strong bivalency is rarely found in E6.5 VE. Previously, we reported that developmental gene promoters are often devoid of DNA methylation, forming large DNA methylation valleys (DMV)51,52. DMVs are partially methylated in E5.5 Epi and E6.5 VE but are selectively demethylated in E6.5 Epi through TET (ten-eleven translocation) proteins34. Thus, strong bivalent H3K4me3 appears to be anticorrelated with DNA methylation in postimplantation embryos (Fig. 5a,b). To ask if there is a causal relationship between bivalency and DNA hypomethylation, we performed whole-genome bisulfite sequencing with STEM-seq (small-scale TELP-enabled methylome sequencing)34 for Kmt2b−/− E6.5 Epi and E8.5 head tissues. Surprisingly, DMVs remain strongly hypomethylated in both E6.5 and E8.5 mutant embryos (Fig. 5c,d). Conversely, we asked whether DNA methylation may play a role in regulating bivalent H3K4me3. Therefore, we generated WT and Tet1/2 double knockout (DKO) embryos (Tet3 is barely expressed, FPKM = 1.4). Indeed, as DMVs become partially methylated in Tet1/2 DKO E6.5 Epi, H3K4me3 shows a significant decrease in these regions (Fig. 5e,f). The H3K4me3 decrease is not due to a decline of the Kmt2b gene expression or developmental delay (Extended Data Fig. 7a–c). These data are, however, consistent with the antagonism between DNA methylation and H3K4me353. In summary, our results suggest that TET proteins facilitate strong bivalency by maintaining the hypomethylation of DMVs at developmental gene promoters.
Fig. 5 |. TET proteins promote super bivalent H3K4me3 in E6.5 Epi.
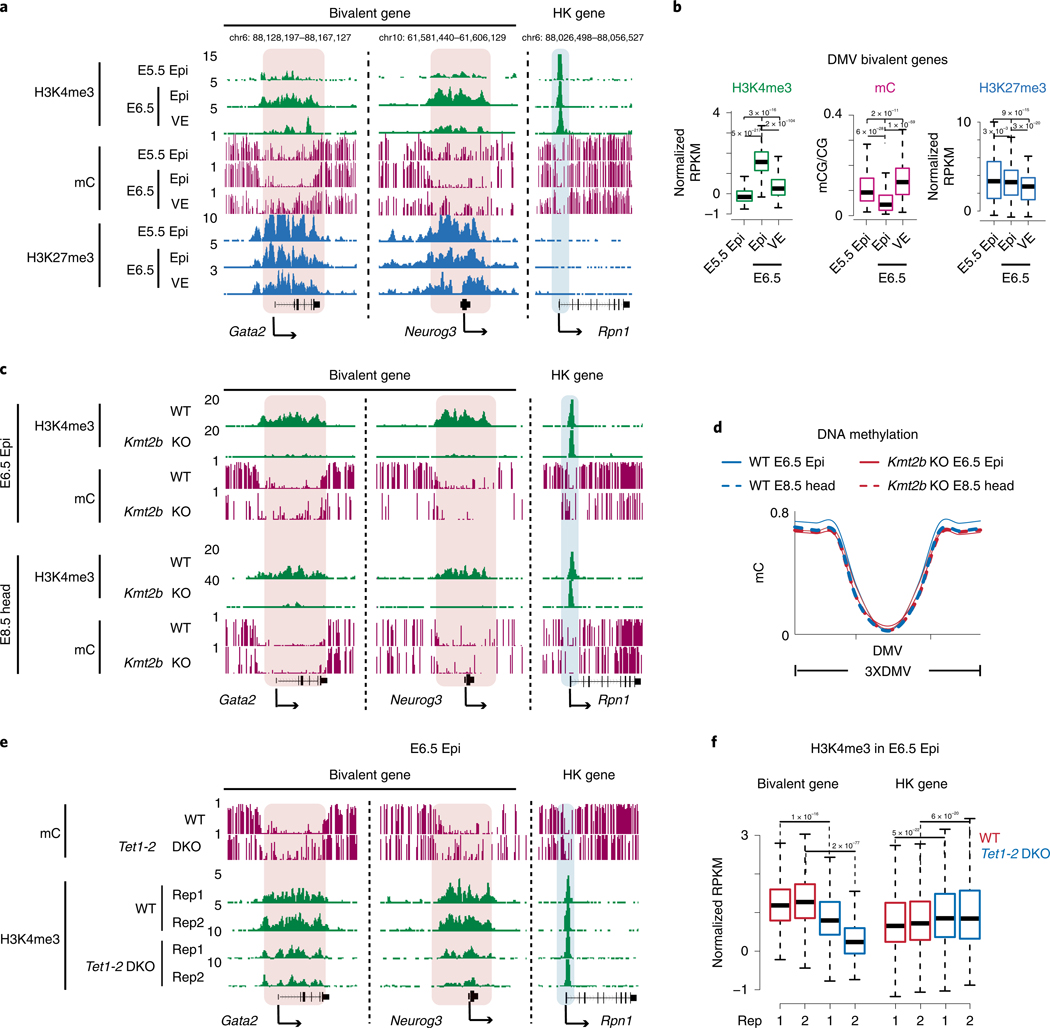
a, Snapshots showing H3K4me3, DNA methylation34 and H3K27me3 enrichment at two developmental genes Gata2 and Neurog3, and a housekeeping gene Rpn1 in E5.5 Epi (n = 2), E6.5 Epi (n = 2) and E6.5 VE (n = 2). The genome browser view scales were adjusted on the basis of the global data range. b, Boxplots showing H3K4me3, DNA methylation and H3K27me3 enrichment at DMVs in E5.5 Epi, E6.5 Epi and E6.5 VE. The median of each dataset is indicated by the center line. The bottom, top edges and whiskers represent the 25th and 75th percentiles and 1.5 times the IQR, respectively. The P values were calculated by two-sided t-test. c, Snapshots showing H3K4me3 and DNA methylation in WT and Kmt2b−/− E6.5 Epi (n = 3) and E8.5 head (n = 2). The genome browser view scales were adjusted on the basis of the global data range. d, Metaplots showing DNA methylation of DMVs at bivalent genes between WT and Kmt2b−/− E6.5 Epi or E8.5 head. e, Snapshots showing DNA methylation34 and H3K4me3 enrichment in WT and Tet1/2 DKO E6.5 Epi (n = 2). The genome browser view scales were adjusted on the basis of the global data range. f, Boxplots showing H3K4me3 for DMV bivalent genes and housekeeping genes between WT (n = 2) and Tet1/2 double knockout (n = 2) E6.5 Epi. The median of each dataset is indicated by the center line. The bottom, top edges and whiskers represent the 25th and 75th percentiles and 1.5 times the IQR, respectively. The P values were calculated by a two-sided t-test.
Spatial clustering of super bivalent genes in E6.5 Epi.
Previously, it was shown that developmental genes tend to show long-distance interactions in mESCs54. We then investigated whether such interactions can also be found in vivo. To do this, we analyzed spatial interactions among bivalent genes using the Hi-C data for preimplantation and postimplantation embryos we reported previously33,34. The interactions among housekeeping genes and inactive genes were also analyzed as comparisons. For ‘inactive genes’ we refer to non-bivalent genes that are silenced in all embryonic and somatic lineages (FPKM < 2, Methods). Strikingly, we found that the interactions between super bivalent gene pairs (such as Tbx2 and Tbx4, Fig. 6a) are largely absent or weak in eight-cell embryos and ICM, but become unusually strong in E6.5 Epi. The interactions are attenuated in E6.5 VE and mESCs (serum-cultured) and become absent again in fibroblasts (Fig. 6a and Extended Data Fig. 8a). Similar observations were also made for super bivalent genes from different chromosomes, albeit with overall weak interactions (Extended Data Fig. 8b). By contrast, such E6.5 Epi-specific interactions are much weaker for non-super bivalent genes, housekeeping and inactive genes (Fig. 6b). It has been reported that a subset (n = 108) of developmental genes show extremely long-range promoter-promoter interactions (ELRI) in serum-cultured mESCs but rarely do so in 2i-cultured mESCs10. These sites are believed to be the ‘nucleation sites’ where PRC2 is directly recruited to initiate de novo H3K27me3 establishment55. Indeed, both ELRI genes and the strongest nucleation sites overlap with super bivalent genes (Extended Data Fig. 9a). Importantly, E6.5 Epi-specific interactions are found not only for ELRI genes but also for non-ELRI super bivalent genes, albeit at weaker levels (Extended Data Fig. 9b). Therefore, these data reveal a strong spatial clustering of developmental genes in E6.5 Epi, followed by progressive de-clustering in differentiation or development.
Fig. 6 |. Super bivalent genes show strong spatial clustering.
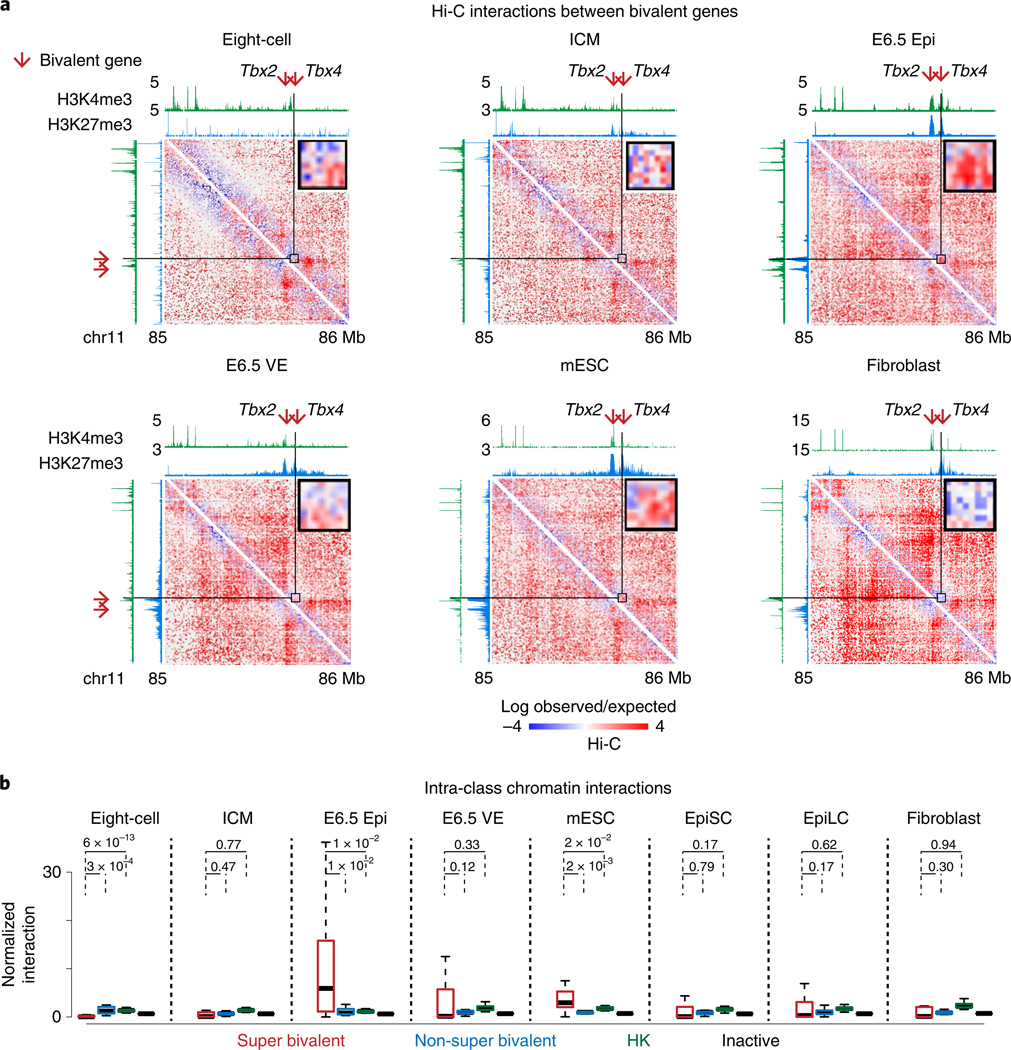
a, Heatmaps (5-kb resolution) showing the normalized interaction frequencies in eight-cell, ICM, E6.5 Epi, E6.5 VE, mESCs33 and fibroblasts57 at chromosome 11 (85–86Mb). A magnified view shows interactions between super bivalent genes Tbx2 and Tbx4. Each sample has comparable c/s-long reads (−115 million). The enrichment of H3K4me3 and H3K27me3 at each stage from this study and previous work28,29,47,58 is shown above the interaction heatmaps. b, Boxplots showing the normalized interaction frequencies among genes in each gene group in various cell types. Super bivalent, super bivalent genes; non-super bivalent, non-super bivalent genes; HK, housekeeping genes; inactive, nonbivalent inactive genes (Methods). The median of each dataset is indicated by the center line. The bottom, top edges and whiskers represent the 25th and 75th percentiles and 1.5 times the IQR, respectively. P values calculated by two-sided t-test are also shown.
Previous work showed that the ablation of Eed only partially affects interactions among different ‘nucleation sites’55. The coincidence of super bivalency and strong spatial clustering of developmental genes in E6.5 Epi raises the question of whether KMT2B may be involved in such clustering. Therefore, we collected E6.5 Epi from WT and Kmt2b−/− embryos and performed sisHi-C analysis33. Despite variations among replicates, we found interactions among super bivalent genes tend to decrease upon the ablation of Kmt2b (Extended Data Fig. 10a). The residual interactions among bivalent genes are consistent with the notion that PRC2 also mediates long-distance interactions among their targets54. Finally, we assessed how such spatial configuration may change when developmental genes become active. To do this, we first developed a metric to define the ‘spatial position’ of a gene relative to developmental genes and housekeeping genes through its relative interactions between these two classes. We computed the ratios between total interactions with all bivalent genes and total interactions with all housekeeping genes (RbiT-hk) for each gene. We then plotted the ratios for super inactive bivalent genes (FPKM < 2, n = 459), non-super inactive developmental genes (FPKM < 2, n = 2,843), all active developmental genes (FPKM > 5, n = 336) and housekeeping genes (FPKM > 2 in all tissues, n = 3,181) in E6.5 Epi. Interestingly, we found active developmental genes have smaller Rbiv-hk compared to inactive developmental genes (Extended Data Fig. 10b), suggesting these genes are relatively further away from the bivalent gene cluster and are in closer proximity to housekeeping genes. In summary, these data demonstrate that KMT2B facilitates spatial interactions among bivalent genes in E6.5 Epi.
Discussion
How cells transit from a pluripotent state to fate-committed states is a fundamental question in both developmental biology and stem cell biology. The epiblast represents a critical stage as cells exit naïve pluripotency and are poised for germ layer differentiation4. However, how epigenetic transition occurs around the emergence of the Epi remains poorly characterized. Here, we conducted an in-depth investigation of chromatin programming in early lineages around gastrulation. We found enhancers in ectoderm preferentially being pre-accessible in E6.5 Epi, which is in line with the notion that ectoderm is a default state of lineage commitment from Epi37 and mESCs56. At promoters, developmental genes acquire strong bivalency specifically in E6.5 Epi. Loss of Kmt2b leads to failure in the establishment of promoter H3K4me3 and subsequent activation of a subset of key developmental genes, as well as the ultimate embryonic lethality. Finally, genes with super bivalency tend to show strong spatial clustering, which is absent in the ICM and fibroblasts. These data demonstrate that the transition of naïve pluripotency to primed pluripotency followed by germ layer specification is accompanied by drastic chromatin reconfiguration.
Despite the well-documented presence of bivalent marks at developmental gene promoters, the roles of H3K4me3 at bivalent promoters have been controversial. Kmt2b−/− mESCs appear to properly activate most bivalent genes upon differentiation20,21, as SET1A can deposit H3K4me3 to bivalent promoters on gene activation24. However, the acute knockout of Kmt2b in mESCs leads to defects in embryoid body differentiation25. Our results indicate that Kmt2b is only required for bivalent H3K4me3 during a very short period including E6.5, but becomes partially dispensable at E8.5 (Fig. 7). In addition, a subset of bivalent promoters failed to be activated on Kmt2b deficiency. These data are well in line with the notion that Kmt2b is critically required at early stages but becomes dispensable for development after E11.5 (ref. 23). It may also explain why Kmt2b−/− embryos can survive beyond E6.5 until E9.5 (ref. 22), as only a selected (but critical) set of genes is affected. However, why KMT2B is only briefly required for bivalent H3K4me3 in vivo remains unclear. It is possible that other enzymes such as SET1A can only slowly deposit H3K4me3 at bivalent promoters, and the accumulated H3K4me3 only becomes evident by E8.5. Alternatively, unknown mechanisms may prevent other enzymes from depositing bivalent H3K4me3 before E6.5. In fact, H3K4me3 from silenced bivalent promoters is not found throughout mouse preimplantation development29. Notably, the widespread deposition of H3K4me3 at E6.5 Epi may reflect the needs of a non-directional, global transcription competence in anticipation of germ layer differentiation. Intriguingly, our study revealed bivalent H3K4me3 in E6.5 Epi is unusually strong. This appears to be mediated at least in part through TET proteins. Interestingly, we found bivalent genes also tend to form unusually strong spatial interactions specifically in E6.5 Epi. It is tempting to speculate that strong bivalency and clustering in primed Epi may help key developmental genes to be coordinated and poised for activation. Once the differentiation process starts, different developmental genes leave the bivalent gene territory for activation in distinct lineages. Such a unique chromatin configuration may allow these key regulators to properly respond to developmental cues in a rapidly dividing embryo. Taken together, our data not only uncovered chromatin dynamics during early cell fate commitment but also revealed a highly unique chromatin architecture in primed pluripotency.
Fig. 7 |. Dynamic chromatin regulation of developmental genes from naïve pluripotency to committed lineages in vivo.
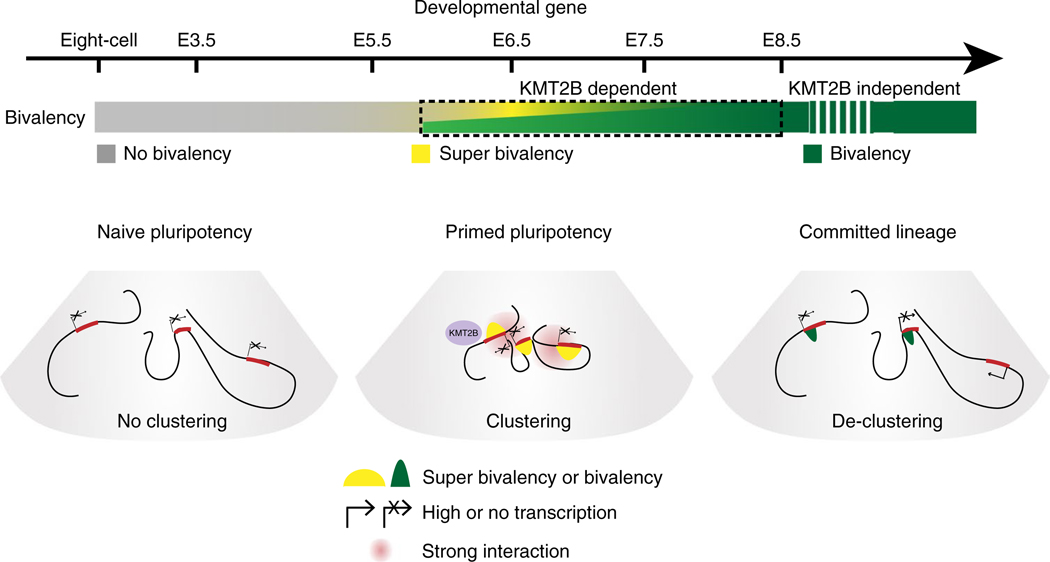
In mice, bivalency is absent from the promoters of developmental genes in preimplantation embryos including ICM, which shows naïve pluripotency in vivo. These developmental genes are mostly silenced and do not show spatial clustering. After implantation, developmental genes gain strong or super bivalency and strong spatial clustering in Epi, which shows primed pluripotency. After lineage specification, super bivalency and spatial clustering among developmental genes are significantly reduced. KMT2B is required for the onset of super bivalency, but only in a short period (from E6.5 to E8.5).
Online content
Any methods, additional references, Nature Research reporting summaries, source data, extended data, supplementary information, acknowledgements, peer review information; details of author contributions and competing interests; and statements of data and code availability are available at https://doi.org/10.1038/s41588-019-0545-1.
Methods
Mouse early lineage dissection.
Germ layers of postimplantation embryos were separated as described previously34,59,60. Briefly, female (C57BL/6N) and male mice (DBA2) were mated, and the time when the vaginal plug was observed the next day was considered E0.5. To dissect the E6.5 Epi and VE, we first collected embryos by removing decidua and Reichert’s membrane. Then embryonic regions were dissected away from extra-embryonic tissues in Dulbecco’s modified Eagle medium containing 10% fetal bovine serum and incubated in pancreatic and trypsin enzyme solution for 2 min at room temperature. Epi and VE were obtained by pipetting embryonic regions through a capillary to detach each other. Endoderm at E7.5 was first isolated similarly as that to obtain TE. Mesoderm was then collected by making a cut parallel to the PS. After cutting the ‘J-shaped’ PS where the mesoderm was attached, the rest of the embryo was collected as ectoderm. To obtain E8.5 head tissues, embryos were firstly dissected and the amniotic membrane was removed in PBS buffer. Then a cut was made directly near the neck region. The head part was collected as head tissues.
Mouse maintenance.
Tetl/2 DKO mice (B6;129 S4-Tet1tm1 1Jae/J and B6;129S- Tet2tml lIaai/J) were maintained following the guidelines of Animal Care and Use Committee of Tsinghua University. After mating Tet1+/−; Tet2−/− heterozygotes, E6.5 Epi from embryonic regions were collected from Tetl/2 DKO embryos as described above. Extra-embryonic regions were used for genotyping.
Generating Kmt2b knockout embryos.
C57BL/6N female mice (5 weeks old) were injected with pregnant mare serum gonadotropin (5 IU) and, 48 h later, human chorionic gonadotrophin (hCG, 5 IU). After the mice were mated with PWK mice, PN3 zygotes were harvested in M2 medium 26 h after injecting hCG. The electroporation method61 was used to introduce Cas9 protein and single guide RNA (ctctccgactcaagattatc, tccccgtgcaacttgataag, ggctggatttcatgtagcgc, cccttgttgtttgatctgta and gatgcacacttggtaggtaa), which targeted exon 31 to 37 including SET domain, into zygotes. Embryos were then cultured to the two-cell stage and transferred to E0.5 pseudopregnancy foster mothers. Epi were harvested at E6.5 as described above. Head tissues were directly cut from the upper region of the neck at E8.5, the rest of the embryos were also collected for genotyping (common forward primer, gctggggcttactactccatc; inner reverse primer, tcctaccttcctgtccatggt; outer reverse primer, gcttgtgggtcttgctcctat).
STAR ChlP-Seq library and sequencing.
STAR ChIP-seq28 was performed as previously described. Briefly, samples were lysed and treated with MNase at 37 °C for 5 min and then incubated with primary antibody (see Life Sciences Reporting Summary) overnight at 4 °C. Then 100 μg protein A Dynabeads (Life Technologies) was added to each sample and incubated for another 3 h with rotation at 4 °C. The beads were then washed with RIPA buffer (five times) and LiCl buffer (once) and resuspended with buffer containing 27 μl of ddH2O, 1 μl of 10× Ex-Taq buffer (TaKaRa) and 1 μl of proteinase K (Roche, 10910000). After incubation at 55 °C for 90 min to digest proteins and another 40 min at 80 °C to inactivate the proteinase K, the DNA library was constructed using TELP62. All libraries, including STAR ChIP-seq, miniATAC-seq and sisHi-C, were sequenced by using XTen or HiSeq 2500 following the manufacturer’s protocol (Illumina).
MiniATAC-seq library generation.
The miniATAC-seq was conducted as previously described32. Briefly, cells were lysed on ice in a 250 μl tube containing 6 μl of lysis buffer for 10 min, then 4 μl of 5× TTBL, 5 μl of TTE mix V5 (TD502, Vazyme) and 4 μl of ddH2O were added to the tube and incubated at 37 °C for 30 min. After addition 5 μl of TS stop buffer, 40 ng of carrier RNA (EpiTect Fast DNA Bisulphite Kit 59824) and 103 μl of Tris-EDTA buffer was added to the reaction product, followed by phenol-chloroform purification. The DNA was then resuspended in 29 μl of ddH2O and used in the library construction process according to the manufacturer’s protocol (TD202 and TD502, Vazyme).
RNA-Seq library generation.
Smart-seq2 libraries were prepared as previously reported63. In brief, cells were transferred to a 250 μl tube containing 2 μl of lysis buffer (Amresco, M334), 1 μl of oligo-dT primer (10 μM) and 1 μl of dNTP mix (Fermentas, R0192). After incubation at 72 °C for 3 min, the reaction product was subjected to reverse transcription and pre-amplification for 12 cycles. DNA was then purified using isopycnic Ampure XP beads (Beckman Coulter, A63881) and used in the library construction process with commercial kits (TD202 and TD502, Vazyme).
STEM-Seq library generation.
STEM-seq libraries of Kmt2b knockout embryos were generated as previously reported34. Briefly, the embryos were lysed with 10 μl of lysis buffer and 1 μl of protease K at 55 °C for 3 h. All the mixture was then treated with the bisulfite conversion reagent and then purified following the instructions of a EpiTect Fast Bisulfite Conversion Kit (Qiagen; 59824). The converted DNA was subjected to the TELP library construction process as previously reported62.
sisHi-C library generation.
The sisHi-C libraries were generated as previously described33,34. Briefly, embryos were collected and crosslinked with 1% formaldehyde at room temperature for 10 min. Then the mixture was treated with glycine for 10 min at RT to quench the formaldehyde. The washed embryos were lysed on ice and solubilized with 0.5% SDS. All nuclei were digested with the restriction enzyme MboI at 37 °C for 12 h. Then the fragments were ligated in a small volume with biotin-14-dCTP. After ligation, crosslink reversal, DNA purification and sonication were performed sequentially, the biotin-14-dCTP labeled targets were pulled down by Dynabeads MyOne Streptavidin C1 (Life Technology). The purified DNA was subjected to the True-seq library construction process.
ChIP-seq and ATAC-seq data processing.
After removal of reads with poor quality calls and adapters with Trim Galore (v. 0.4.2) using default parameters, reads from ChIP-seq and ATAC-seq datasets were mapped to the mouse mm9 reference genome using Bowtie2 v. 2.2.2 (ref. 64) with the parameters: --t --q --N 1 --L 25. Multiple mapped reads and PCR duplicates were further removed with a javascript (MarkDuplicates.jar). The monoclonal reads were then normalized by calculating the number of RPKM. After validation of the reproducibility, replicates were pooled for downstream analysis. The UCSC genome browser was used to visualize ChIP-seq and ATAC-seq data. Due to the commonly observed batch variations of these data, we manually adjusted the genome browser view scales based on the global data range.
RNA-seq data processing.
All RNA-seq datasets were mapped to the mouse mm9 reference genome by using Tophat v. 2.0.11. Gene expression was then calculated according to refFlat database by using cufflinks v. 2.0.2 (ref. 65).
STEM-seq data processing.
All STEM-seq datasets were first trimmed of adapters with Trim Galore and low-quality reads were removed before mapping. Then all reads were aligned to the mm9 reference genome through BSSeeker2 (ref. 66) with the following parameters: --bt2-p 8 --XS 0.2,3 -- a CCCCCC -- m 4. After mapping, the multiple mapped and duplicated reads were removed. We also removed the unconverted reads marked by BSSeeker2 with the flag --XS 0.2,3, and mapped reads shorter than 30 bp.
Hi-C data processing.
Previously published Hi-C datasets were used in the study33,34. Sequencing reads were mapped, processed and iteratively corrected using HiC-Pro (v. 2.7.8) as described previously33. The valid pairs produced by HiC-Pro were used for.hic file generation with Juicer v.0.7.5 (ref, 67) with the parameters: hicpro2juicebox.sh -i all Valid Pairs -g chrom_mm9.sizes -j juicer_tools_0.7.5.jar -r MboI_resfrag_mm9.bed. The hicpro2juicebox.sh script was provided by HiC-Pro. Juicebox was used for the visualization of the Hi-C datasets. Juicer (v.0.7.5) was also used for matrix generation with the parameters: java --jar juicer_tools_0.7.5.jar dump observed NONE target.hic chr chr BP 5000 output. The observed/expected matrix was produced with similar commands: java --jar juicer_tools_0.7.5.jar dump oe NONE target.hic chr chr BP 5000 output. The observed/expected matrix with 5-kb resolution was used for the promoter-promoter interaction calculation. The observed matrix with 5-kb resolution was used for the ‘Virtual 4 C’ analysis.
Analyses of putative enhancers.
Peak calling for H3K4me3, H3K27me3 and H3K27ac was performed by using MACS2 (ref. 68) with the parameters --nomodel --nolambda. For putative enhancer identification, those H3K27ac peaks that overlapped with promoters and the H3K4me3 signals were excluded. The H3K27ac peaks that were unique to each lineage were identified as tissue-specific enhancers. The GO enrichment for tissue-specific enhancer related genes were analyzed with the GREAT tool36. The software HOMER41 was used to identify potential transcription factor motifs in all putative enhancers for each lineage.
Identification of bivalent, housekeeping and inactive genes.
We first called H3K4me3 and H3K27me3 peaks in 27 tissues including our data (E5.5 Epi, E6.5 Epi, E6.5 VE, Ect, PS, Mes and End), eight-cell (GSE71434), ICM (GSE71434) and 18 mouse ENCODE datasets (bone, cerebellum, cortex, E14.5 brain, E14.5 heart, E14.5 limb, E14.5 liver, heart, intestine, kidney, liver, lung, MEF, mESC, olfactory, placenta, spleen and thymus; GSE36026 and GSE31039). All H3K4me3 and H3K27me3 marked genes were pooled, and those that were inactive (FPKM < 2) in at least half of all tissues were identified as bivalent genes (n = 3,992). Genes that are expressed in all stages including early embryos, mESCs and somatic tissues (FPKM > 2) were identified as housekeeping genes. For comparison of bivalent H3K4me3 between E6.5 Epi and somatic cells, bivalent genes that were silenced in E6.5 Epi (FPKM < 2) but activated in the cortex (FPKM > 5) or heart were identified.
Super bivalent gene identification.
Among all bivalent genes (described above), we sought to search for those with unusually strong H3K4me3 and H3K27me3 by the following criteria: 1) H3K4me3 enrichment (normalized by Z-score) is higher than that of average H3K4me3 at housekeeping genes in each lineage; and 2) H3K27me3 (normalized by Z-score) is also strong (with an arbitrary cutoff, normalized RPKM > 1). We required strong H3K27me3 because bivalent genes can have very low H3K27me3 when they become activated in E6.5 Epi.
Identification of PRC2 nucleation site genes.
We downloaded H3K27me3 ChIP-seq data in Eed Y365A mutant mESCs55 and called H3K27me3 peaks by MACS2 (ref. 68). The top 100 nucleation genes were defined by promoters, as follows: (1) identify genes with promoter H3K27me3 (transcriptional start site (TSS) ± 5 kb overlapping with H3K27me3 peaks identified by MACS2); (2) sort promoter H3K27me3 enrichment (TSS ± 5 kb) (thus all lengths of promoters are equal); 3) identify the strongest top 100 genes as nucleation genes.
Identification of differentially expressed genes.
DESeq2 (ref. 69) was used to calculate the P values for differentially expressed genes between WT and mutant cells. Gene expression levels (FPKM) for each sample was calculated by Cufflinks65. Genes with P value less than 0.01 (P < 0.01), the fold change more than 2 and FPKM more than 5 in the upregulated tissues or samples are considered as differentially expressed genes.
Identification of DMVs.
The DMVs were identified as described previously51. First, the whole mouse genome was divided into 1-kb bins. We then calculated the average methylation levels within each 1-kb bin. Next, we used a sliding window (5 kb, with 1-kb step size) to identify regions with an average methylation level of less than 0.15 in the 5-kb window. Continuous 5-kb windows were merged to form DMVs. The bivalent genes located in the DMV regions were named DMV bivalent genes.
Promoter H3K4me3 and H3K27me3 enrichment analysis.
The mm9 refFlat annotation database downloaded from UCSC70 was used for the promoter (TSS ± 10 kb for bivalent and housekeeping genes, TSS ± 150 kb for Hox clusters) enrichment analysis. The whole-genome Z-score normalized RPKM scores were used in the calculation.
Clustering analysis.
The K-means clustering of gene expression and histone modification enrichment was conducted using Cluster 3.0 (uncentered correlation). The hierarchical clustering analysis was based on the Spearman rank correlation. Data were further visualized by Java Treeview.
GO analysis.
Analysis of GO terms was performed using DAVID web-tools71. All terms listed in the figures have a P value of less than 0.01.
Rbiv-hk calculation.
The 5-kb observed/expected matrix was used for Rbiv-hk calculation. We computed the ratio between total interactions with all bivalent genes and total interactions with all housekeeping genes (Rbiv-hk) for each gene in different classes. The average Rbiv-hk value among different chromosomes were used for the boxplot analysis.
Virtual 4C.
The 5-kb observed matrix was generated with Juicer67 as described before. Interactions between bait region and all other detected signals in the same chromosome were kept and visualized in the UCSC genome browser.
Hi-C analysis of interactions among bivalent gene pairs.
First, we generated the observed/expected matrix by Juicer67,72 with a 5-kb bin (~115 million cis-long reads for each sample) to eliminate the bias introduced by genomic distance between region pairs. We then plotted the composite interaction frequency by averaging pairs of the identified super-bivalent genes, ELRI genes, non-ELRI super bivalent genes in E6.5 Epi and non-ELRI, non-super bivalent genes in E6.5 Epi regions within the TSS ± 50 kb. The resulted matrices were then normalized by dividing the average levels of the matrix values to generate the log ratio values. Genes silenced in all these tissues (FPKM < 2) were considered inactive genes. The interactions among the housekeeping gene pairs and the inactive gene pairs were calculated with the same method and used as controls.
Reporting Summary.
Further information on research design is available in the Nature Research Reporting Summary linked to this article.
Extended Data
Extended Data Fig. 1 |. Global view of histone modifications and chromatin accessibility in mouse early lineages.
a, Snapshots showing two replicates of H3K4me3, H3K27ac, H3K27me3, and ATAC-seq in E6.5Epi, E6.5VE, Ect, PS, Mes, and End at E7.5. mESC data from ENCODE47 are also shown for comparison. The genome browser view scales were adjusted based on the global data range. b, The Pearson correlation between two replicates for H3K4me3, H3K27me3, H3K27ac, and ATAC-seq in post-implantation lineages. The correlation between our dataset and a published dataset73 for H3K27me3 in E6.5 epiblast is also shown.
Extended Data Fig. 2 |. Global view of histone modifications, chromatin accessibility, and dynamics of putative enhancers during mouse early lineage specification.
a, Hierarchical clustering of two replicates for histone modifications and ATAC-seq data at promoters among post-implantation tissues. b, The heatmap showing the Spearman correlation between gene expression and enrichment of histone modifications and open chromatin at promoters in the post-implantation embryos. c, Heatmaps showing gene expression and related histone modifications/open chromatin enrichment at promoters for lineage-specific genes. d, Heatmaps showing tissue-specific enhancers from mesoderm to heart (left), and endoderm to liver (right). GO terms enriched for each tissue-specific enhancers are also listed. Somatic enhancers were obtained from a previous study47. e, Boxplots showing the dynamics of DNA methylation for tissue-specific enhancers34,47 during development. The median of each dataset is shown by the center line. The bottom, top edges and whiskers represent the twenty-fifth and seventy-fifth percentiles, and 1.5 times the interquartile range (IQR), respectively.
Extended Data Fig. 3 |. Bivalency establishment in early embryo.
a, Snapshots showing H3K4me3 and H3K27me3 enrichment at developmental genes Hoxd cluster and Gata2 in various cell types (n=2). Gene expression is also shown (log2 transformed FPKM). mESC and somatic tissue data from ENCODE47 are shown. Published data in 8-cell embryos and ICM28,29 are also shown for comparison. The genome browser view scales were adjusted based on the global data range. b, Average plots showing H3K4me3 and H3K27me3 enrichment at the Hox genes, bivalent genes inactive at all stages examined (8-cell, ICM, E5.5Epi, E6.5Epi, E6.5VE, and mESC), and housekeeping genes. The H3K4me3 enrichment is normalized against H3K4me3 signals at housekeeping (HK) gene promoters for each lineage. Arrows indicate E6.5 Epi. c, Average plots showing H3K4me3 and H3K27me3 enrichment at inactive bivalent genes (inactive at E6.5Epi, Ect, PS, Mes, and End), and housekeeping genes. The H3K4me3 enrichment is normalized against H3K4me3 signals at housekeeping (HK) gene promoters for each lineage. Arrows indicate E6.5 Epi.
Extended Data Fig. 4 |. Bivalency states in E6.5Epi and E6.5VE.
a, The UCSC genome browser views showing the enrichment of H3K4me3 (n=2), H3K27me3 (n=2) and H3 (n=1) at developmental genes Hoxa cluster, Pax6, as well as a housekeeping gene Rpn1 in mouse E6.5Epi and E6.5VE. b, Average plots showing H3K4me3 (n=2), H3K27me3 (n=2) and H3 (n=1) enrichment at the Hox gene cluster, inactive bivalent genes (inactive in E6.5Epi and E6.5VE), and housekeeping genes in E6.5Epi and E6.5VE. c, The scatter plot showing the enrichment of H3K4me3 (ULI-NChlP-seq), either done in this study (left) or in a previous study50 (right), and H3K27me3 (STAR ChlP-seq) of all bivalent genes (n=3,992) for E6.5 epiblast. The average H3K4me3 enrichment of housekeeping gene (HK.ave) is shown for each tissue. The number of super bivalent genes (top right) and Pearson correlation of H3K4me3 and H3K27me3 for each tissue (bottom right) are shown. d, The Venn diagram shows the overlap of super bivalent genes identified by ULI-NChlP-seq (Uli) and STAR ChIP-seq in E6.5 epiblast. The P-values was calculated by Fisher’s test.
Extended Data Fig. 5 |. Super bivalency marks primed pluripotent state in early lineages and somatic tissues.
a, Snapshots comparing the enrichment of H3K4me3, H3K27me3, and H3K27ac in E6.5 epiblast and somatic tissues from ENCODE47 at developmental genes Neurod1, Pcp4l1, and Foxa1. The heatmaps showing related gene expression levels. The genome browser view scales were adjusted based on the global data range. b, Left, the boxplot showing the expression levels of super bivalent genes and housekeeping genes in E6.5Epi34 and cortex47. The median of each dataset is shown by the center line. The bottom, top edges and whiskers represent the twenty-fifth and seventy-fifth percentiles, and 1.5 times the interquartile range (IQR), respectively. Two-sided P-values calculated by t-test are also shown. Super bivalent genes are identified in E6.5Epi (inactive). C-active, E6.5Epi super bivalent genes that become active in cortex (FPKM > 5); C-inactive, E6.5Epi super bivalent genes that remain inactive in cortex (FPKM < 2). Right, average plots showing the enrichment of H3K4me3 around the active and inactive super bivalent genes and housekeeping genes in E6.5Epi and cortex. c, A similar analysis as b in E6.5Epi and heart. H-active, E6.5Epi super bivalent genes that become active in heart (FPKM > 5); H-inactive, E6.5Epi super bivalent genes that remain inactive in heart (FPKM < 2).
Extended Data Fig. 6 |. Loss of super bivalent H3K4me3 is associated with aberrant developmental gene activation.
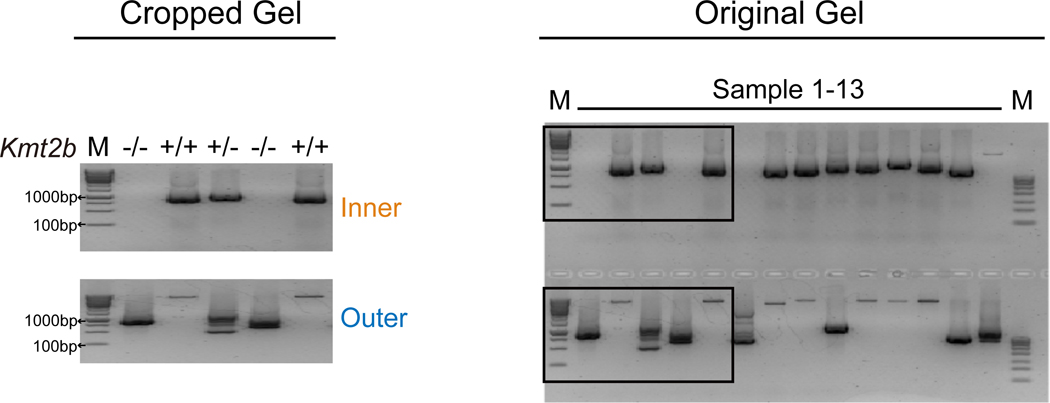
a, Gene expression of Kmt2b in pre- and post-implantation embryos is shown as bar graphs using previously published datasets28,34. b, Left, a schematic showing Kmt2b knockout strategy using Cas9/CRISPR as previously described61. Inner and outer primers for genotyping are shown. Right, the genotyping results of identified wild-type and Kmt2b−/− embryos using extra-embryonic tissues at E6.5. One representative image from three independent experiments is shown. Uncropped gel is also shown in Source data. M, DNA ladder; +/+, wild-type; +/−, heterozygote; −/−, homozygote. c, Average plots showing H3K4me3 enrichment at super bivalent/non-super bivalent/housekeeping genes (defined in E6.5 epiblast) for wild-type (n=2) and Kmt2b−/− E6.5Epi (n=3) and E8.5 head (n=2). The H3K4me3 enrichment is normalized against H3K4me3 signals at housekeeping (HK) gene promoters for each lineage. d, The morphology of wild-type and Kmt2b KO embryos from E6.5 to E9.5. Three independent experiments were performed. e, Hierarchical clustering based on gene expression in wild-type and Kmt2b KO embryos from E6.5 to E9.5. Arrow indicates E9.5 Kmt2b−/− embryo.
Extended Data Fig. 7 |. WT vs. Tet1/2 DKO embryos in E6.5 epiblasts.
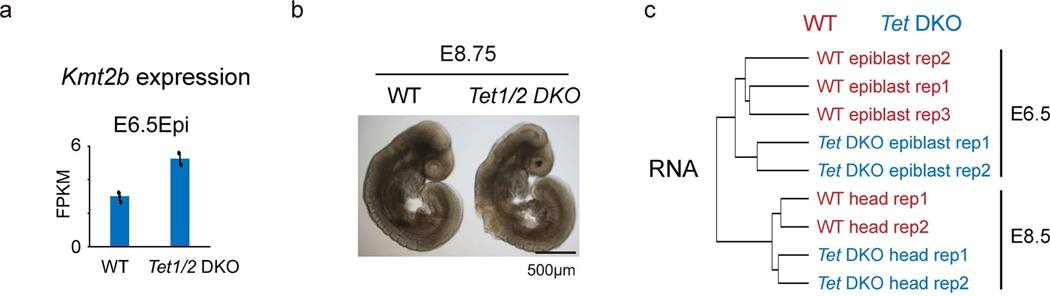
a, Bar chart showing the expression levels of Kmt2b in wild-type (n=3) and Tet1/2 DKO (n=2) E6.5 epiblasts. The error bar represents the S.D with the barplot showing the the mean value. b, The morphology of wild type and Tet1/2 DKO embryos at E8.75. Two independent experiments were performed. c, Hierarchical clustering based on gene expression in wild-type and Tet1/2 DKO embryos from E6.5 to E8.5.
Extended Data Fig. 8 |. Spatial interactions of super bivalent genes in E6.5 epiblast.
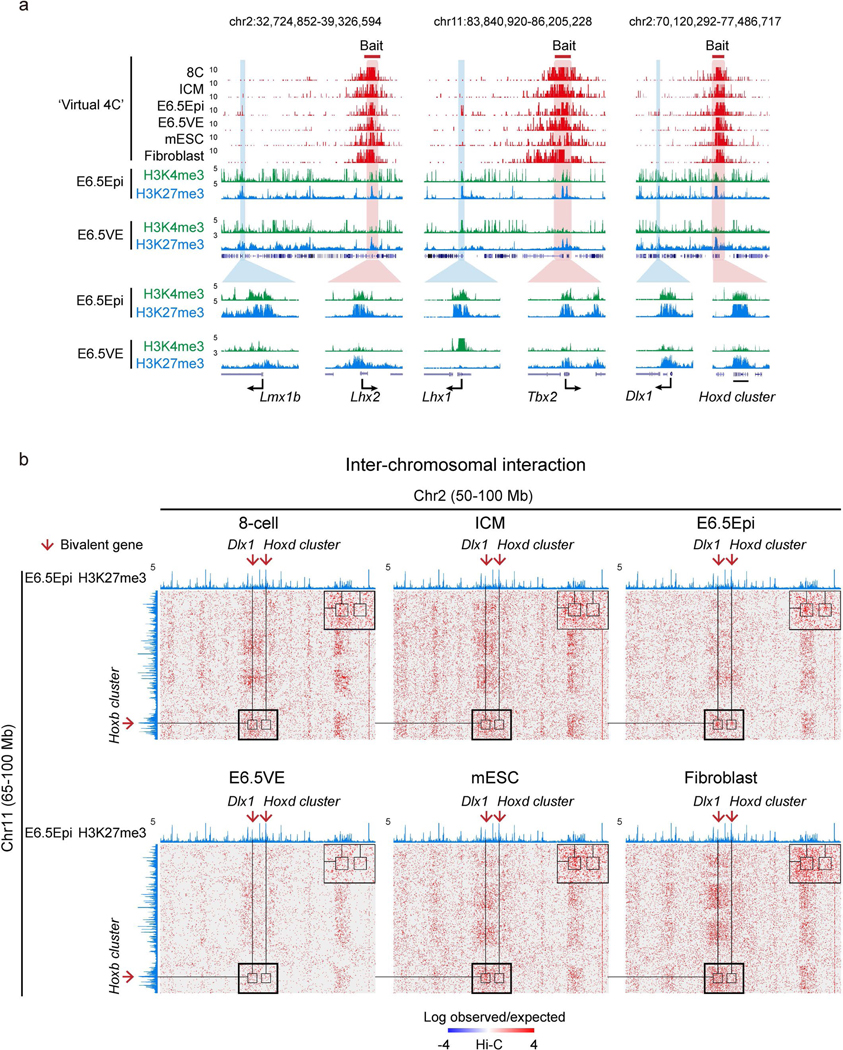
a, The snapshots showing the ‘Virtual 4C’ (converted from Hi-C datasets) among bivalent genes in 8-cell, ICM, E6.5Epi, E6.5VE, mESC, and fibroblast. The enrichment of H3K4me3 and H3K27me3 in E6.5Epi (n=2) and E6.5VE (n=2) are shown below. Magnified views of interactions between bivalent genes are also shown. b, Heatmaps showing the inter-chromosomal interactions between chromosomes 2 and 11. Boxes show the zoomed-in views of interactions between Dlx, Hoxd cluster (chr2) and Hoxb clusters (chr11). A UCSC genome browser of H3K27me3 enrichment in wild-type E6.5Epi is shown on the top to indicate the positions of Polycomb targets.
Extended Data Fig. 9 |. Super bivalent genes show strong spatial clustering.
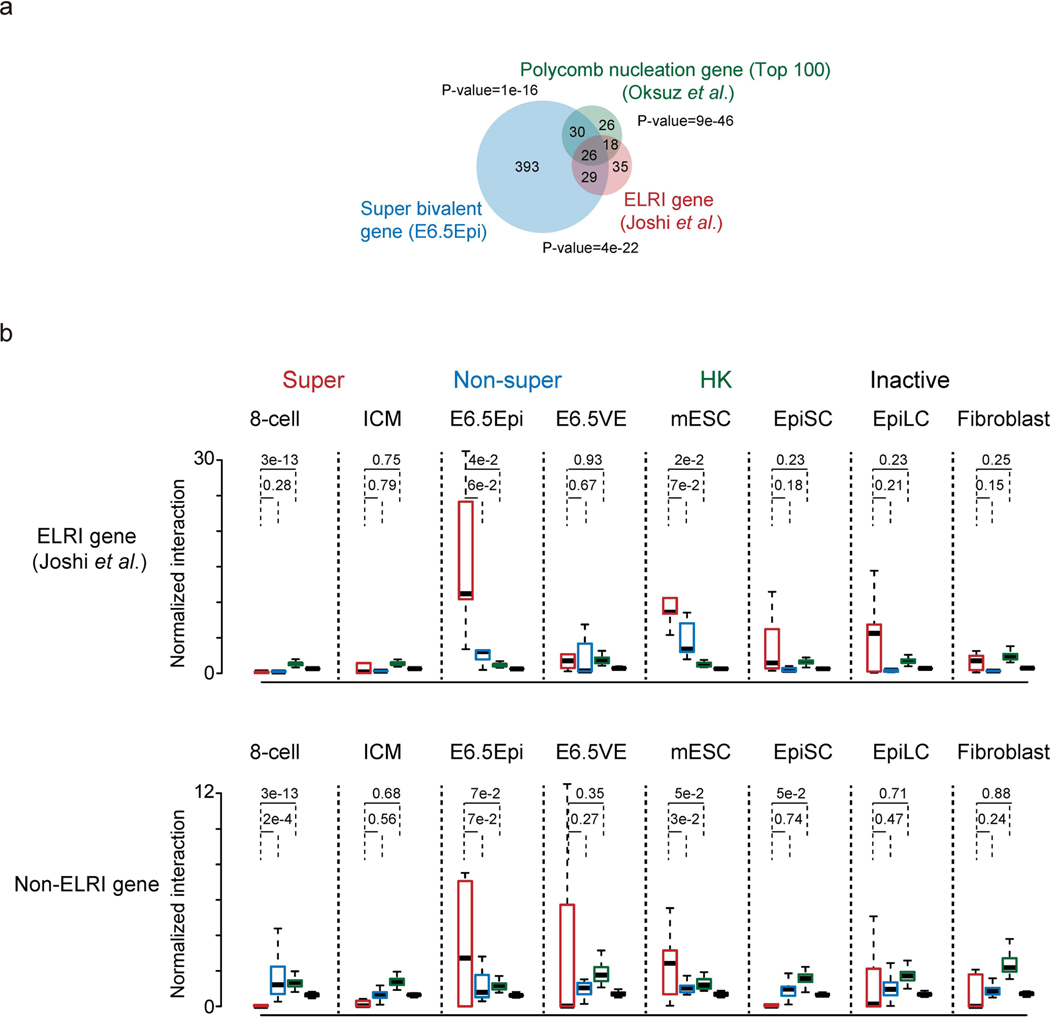
a, A Venn diagram shows the overlap between ELRI genes10 (n=108), top 100 Polycomb nucleation genes55, and super bivalent genes identified in E6.5Epi (see Methods). The P-values showing the overlap among pairwise comparison were calculated by Fisher test. b, Boxplots showing the normalized interaction frequencies among different gene groups in 8-cell, ICM, E6.5Epi, E6.5VE, mESC, EpiSC, EpiLC and fibroblast for ELRI bivalent genes(top) and non-ELRI bivalent genes (bottom). Super, super bivalent genes; Non-super, non-super bivalent genes; HK, housekeeping genes; Inactive, non-bivalent inactive genes (Methods). The median of each dataset is shown by the center line. The bottom, top edges and whiskers represent the twenty-fifth and seventy-fifth percentiles, and 1.5 times the interquartile range (IQR), respectively. Two-sided P-values calculated by t-test are also shown.
Extended Data Fig. 10 |. Strong spatial clustering of developmental genes in E6.5 epiblast.
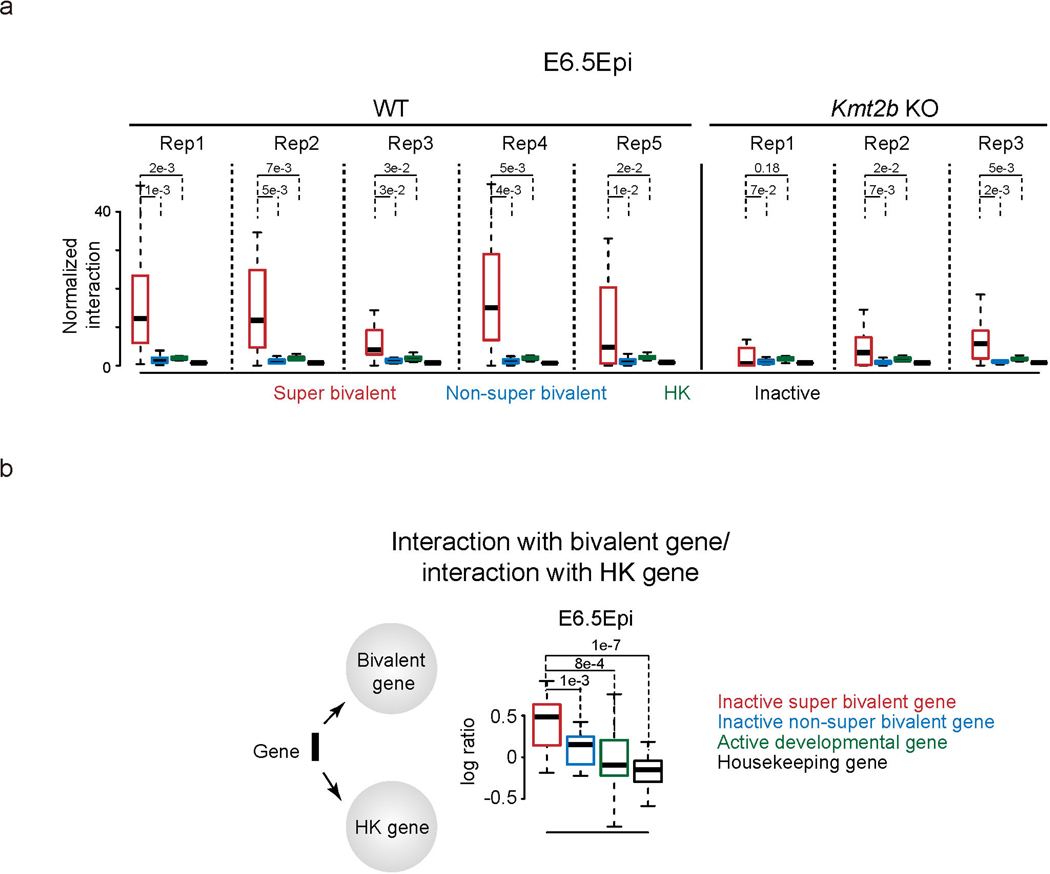
a, Boxplots showing the normalized interaction frequencies among genes in each gene group in wild-type (n = 5) and Kmt2b−/− (n=3) E6.5 Epi. P-values calculated by two-sided t-test are also shown. b, Left, a schematic diagram shows the relative spatial position of a selected gene defined by its interactions with developmental genes divided by its interactions with housekeeping genes. Right, boxplots showing the log ratios of such bivalent/housekeeping gene interactions for different gene groups (inactive, active developmental genes, housekeeping genes) in E6.5 epiblast.
Supplementary Material
Acknowledgements
We thank members of the Xie laboratory for comments during the preparation of the manuscript. We appreciate the support from the animal core facility, the sequencing core facility and biocomputing facility at Tsinghua University. This work was funded by the Beijing Municipal Science & Technology Commission (Z181100001318006 to W.X.), National Natural Science Foundation of China (31422031 and 31725018 to W.X.), Beijing Advanced Innovation Center for Structural Biology (100300001 to W.X.), the National Basic Research Program of China (2015CB856201 to W.X.) and the THU-PKU Center for Life Sciences (W.X.). W.X. is a recipient of an HHMI International Research Scholar.
Footnotes
Competing interests
The authors declare no competing interests.
Data availability
All data have been deposited to GEO with the accession number GSE125318. Source data for Extended Data Fig. 6 are available online.
Code availability
Software and code used to analyze these data are listed in the Nature Research Reporting Summary.
Additional information
Extended data is available for this paper at https://doi.org/10.1038/s41588–019-0545–1.
Supplementary information is available for this paper at https://doi.org/10.1038/s41588–019-0545–1.
Publisher’s note Springer Nature remains neutral with regard to jurisdictional claims in published maps and institutional affiliations.
References
- 1.Rossant J & Tam PP Emerging asymmetry and embryonic patterning in early mouse development. Dev. Cell 7, 155–164 (2004). [DOI] [PubMed] [Google Scholar]
- 2.Zernicka-Goetz M, Morris SA & Bruce AW Making a firm decision: multifaceted regulation of cell fate in the early mouse embryo. Nat. Rev. Genet. 10, 467–477 (2009). [DOI] [PubMed] [Google Scholar]
- 3.Arnold SJ & Robertson EJ Making a commitment: cell lineage allocation and axis patterning in the early mouse embryo. Nat. Rev. Mol. Cell Biol. 10, 91–103 (2009). [DOI] [PubMed] [Google Scholar]
- 4.Lawson KA, Meneses JJ & Pedersen RA Clonal analysis of epiblast fate during germ layer formation in the mouse embryo. Development 113, 891–911 (1991). [DOI] [PubMed] [Google Scholar]
- 5.Bielinska M, Narita N & Wilson DB Distinct roles for visceral endoderm during embryonic mouse development. Int. J. Dev. Biol. 43, 183–205 (1999). [PubMed] [Google Scholar]
- 6.Nichols J & Smith A Naive and primed pluripotent states. Cell Stem Cell 4, 487–492 (2009). [DOI] [PubMed] [Google Scholar]
- 7.Marks H & Stunnenberg HG Transcription regulation and chromatin structure in the pluripotent ground state. Biochim. Biophys. Acta 1839, 129–137 (2014). [DOI] [PubMed] [Google Scholar]
- 8.Hayashi K, Ohta H, Kurimoto K, Aramaki S & Saitou M Reconstitution of the mouse germ cell specification pathway in culture by pluripotent stem cells. Cell 146, 519–532 (2011). [DOI] [PubMed] [Google Scholar]
- 9.Habibi E et al. Whole-genome bisulfite sequencing of two distinct interconvertible DNA methylomes of mouse embryonic stem cells. Cell Stem Cell 13, 360–369 (2013). [DOI] [PubMed] [Google Scholar]
- 10.Joshi O et al. Dynamic reorganization of extremely long-range promoter-promoter interactions between two states of pluripotency. Cell Stem Cell 17, 748–757 (2015). [DOI] [PubMed] [Google Scholar]
- 11.Kouzarides T Chromatin modifications and their function. Cell 128, 693–705 (2007). [DOI] [PubMed] [Google Scholar]
- 12.Vermeulen M & Timmers HT Grasping trimethylation of histone H3 at lysine 4. Epigenomics 2, 395–406 (2010). [DOI] [PubMed] [Google Scholar]
- 13.Shilatifard A The COMPASS family of histone H3K4 methylases: mechanisms of regulation in development and disease pathogenesis. Annu. Rev. Biochem. 81, 65–95 (2012). [DOI] [PMC free article] [PubMed] [Google Scholar]
- 14.Calo E & Wysocka J Modification of enhancer chromatin: what, how, and why? Mol. Cell 49, 825–837 (2013). [DOI] [PMC free article] [PubMed] [Google Scholar]
- 15.Margueron R & Reinberg D The Polycomb complex PRC2 and its mark in life. Nature 469, 343–349 (2011). [DOI] [PMC free article] [PubMed] [Google Scholar]
- 16.Vastenhouw NL & Schier AF Bivalent histone modifications in early embryogenesis. Curr. Opin. Cell Biol. 24, 374–386 (2012). [DOI] [PMC free article] [PubMed] [Google Scholar]
- 17.Rao RC & Dou Y Hijacked in cancer: the KMT2 (MLL) family of methyltransferases. Nat. Rev. Cancer 15, 334–346 (2015). [DOI] [PMC free article] [PubMed] [Google Scholar]
- 18.Azuara V et al. Chromatin signatures of pluripotent cell lines. Nat. Cell Biol. 8, 532–538 (2006). [DOI] [PubMed] [Google Scholar]
- 19.Bernstein BE et al. A bivalent chromatin structure marks key developmental genes in embryonic stem cells. Cell 125, 315–326 (2006). [DOI] [PubMed] [Google Scholar]
- 20.Hu D et al. The Mll2 branch of the COMPASS family regulates bivalent promoters in mouse embryonic stem cells. Nat. Struct. Mol. Biol. 20, 1093–1097 (2013). [DOI] [PMC free article] [PubMed] [Google Scholar]
- 21.Denissov S et al. Mll2 is required for H3K4 trimethylation on bivalent promoters in embryonic stem cells, whereas Mll1 is redundant. Development 141, 526–537 (2014). [DOI] [PubMed] [Google Scholar]
- 22.Glaser S et al. Multiple epigenetic maintenance factors implicated by the loss of Mll2 in mouse development. Development 133, 1423–1432 (2006). [DOI] [PubMed] [Google Scholar]
- 23.Glaser S et al. The histone 3 lysine 4 methyltransferase, Mll2, is only required briefly in development and spermatogenesis. Epigenetics Chromatin 5 (2009). [DOI] [PMC free article] [PubMed] [Google Scholar]
- 24.Sze CC et al. Histone H3K4 methylation-dependent and -independent functions of Set1A/COMPASS in embryonic stem cell self-renewal and differentiation. Genes Dev. 31, 1732–1737 (2017). [DOI] [PMC free article] [PubMed] [Google Scholar]
- 25.Mas G et al. Promoter bivalency favors an open chromatin architecture in embryonic stem cells. Nat. Genet. 50, 1452–1462 (2018). [DOI] [PubMed] [Google Scholar]
- 26.Xia W et al. Resetting histone modifications during human parental-to-zygotic transition. Science 365, 353–360 (2019). [DOI] [PubMed] [Google Scholar]
- 27.Liu X et al. Distinct features of H3K4me3 and H3K27me3 chromatin domains in pre-implantation embryos. Nature 537, 558–562 (2016). [DOI] [PubMed] [Google Scholar]
- 28.Zhang B et al. Allelic reprogramming of the histone modification H3K4me3 in early mammalian development. Nature 537, 553–557 (2016). [DOI] [PubMed] [Google Scholar]
- 29.Zheng H et al. Resetting epigenetic memory by reprogramming of histone modifications in mammals. Mol. Cell 63, 1066–1079 (2016). [DOI] [PubMed] [Google Scholar]
- 30.Dahl JA et al. Broad histone H3K4me3 domains in mouse oocytes modulate maternal-to-zygotic transition. Nature 537, 548–552 (2016). [DOI] [PMC free article] [PubMed] [Google Scholar]
- 31.Hanna CW et al. MLL2 conveys transcription-independent H3K4 trimethylation in oocytes. Nat. Struct. Mol. Biol. 25, 73–82 (2018). [DOI] [PubMed] [Google Scholar]
- 32.Wu J et al. Chromatin analysis in human early development reveals epigenetic transition during ZGA. Nature 557, 256–260 (2018). [DOI] [PubMed] [Google Scholar]
- 33.Du Z et al. Allelic reprogramming of 3D chromatin architecture during early mammalian development. Nature 547, 232–235 (2017). [DOI] [PubMed] [Google Scholar]
- 34.Zhang Y et al. Dynamic epigenomic landscapes during early lineage specification in mouse embryos. Nat. Genet. 50, 96–105 (2018). [DOI] [PubMed] [Google Scholar]
- 35.Ren B & Yue F Transcriptional enhancers: Bridging the genome and phenome. Cold Spring Harb. Symp. Quant. Biol. 80, 17–26 (2015). [DOI] [PubMed] [Google Scholar]
- 36.McLean CY et al. GREAT improves functional interpretation of cis-regulatory regions. Nat. Biotechnol. 28, 495–501 (2010). [DOI] [PMC free article] [PubMed] [Google Scholar]
- 37.Ang SL & Rossant J Anterior mesendoderm induces mouse Engrailed genes in explant cultures. Development 118, 139–149 (1993). [DOI] [PubMed] [Google Scholar]
- 38.Burdsal CA, Flannery ML & Pedersen RA FGF-2 alters the fate of mouse epiblast from ectoderm to mesoderm in vitro. Dev. Biol. 198, 231–244 (1998). [PubMed] [Google Scholar]
- 39.Argelaguet R et al. Multi-omics profiling of mouse gastrulation at single-cell resolution. Nature 10.1038/s41586-019-1825-8 (2019). [DOI] [PMC free article] [PubMed] [Google Scholar]
- 40.Yang X et al. Distinct enhancer signatures in the mouse gastrula delineate progressive cell fate continuum during embryo development. Cell Res. 29, 911–926 (2019). [DOI] [PMC free article] [PubMed] [Google Scholar]
- 41.Heinz S et al. Simple combinations of lineage-determining transcription factors prime cis-regulatory elements required for macrophage and B cell identities. Mol. Cell 38, 576–589 (2010). [DOI] [PMC free article] [PubMed] [Google Scholar]
- 42.Scholer HR, Dressler GR, Balling R, Rohdewohld H & Gruss P Oct-4: a germline-specific transcription factor mapping to the mouse t-complex. EMBO J. 9, 2185–2195 (1990). [DOI] [PMC free article] [PubMed] [Google Scholar]
- 43.Ang SL et al. The formation and maintenance of the definitive endoderm lineage in the mouse: involvement of HNF3/forkhead proteins. Development 119, 1301–1315 (1993). [DOI] [PubMed] [Google Scholar]
- 44.Clevers H Wnt/beta-catenin signaling in development and disease. Cell 127, 469–480 (2006). [DOI] [PubMed] [Google Scholar]
- 45.Cheung M & Briscoe J Neural crest development is regulated by the transcription factor Sox9. Development 130, 5681–5693 (2003). [DOI] [PubMed] [Google Scholar]
- 46.Azcoitia V, Aracil M, Martinez AC & Torres M The homeodomain protein Meis1 is essential for definitive hematopoiesis and vascular patterning in the mouse embryo. Dev. Biol. 280, 307–320 (2005). [DOI] [PubMed] [Google Scholar]
- 47.Shen Y et al. A map of the cis-regulatory sequences in the mouse genome. Nature 488, 116–120 (2012). [DOI] [PMC free article] [PubMed] [Google Scholar]
- 48.Hon GC et al. Epigenetic memory at embryonic enhancers identified in DNA methylation maps from adult mouse tissues. Nat. Genet. 45, 1198–1206 (2013). [DOI] [PMC free article] [PubMed] [Google Scholar]
- 49.Brind’Amour J et al. An ultra-low-input native ChIP-seq protocol for genome-wide profiling of rare cell populations. Nat. Commun. 6, 6033 (2015). [DOI] [PubMed] [Google Scholar]
- 50.Wang CF et al. Reprogramming of H3K9me3-dependent heterochromatin during mammalian embryo development. Nat. Cell Biol. 20, 620 (2018). -+. [DOI] [PubMed] [Google Scholar]
- 51.Xie W et al. Epigenomic analysis of multilineage differentiation of human embryonic stem cells. Cell 153, 1134–1148 (2013). [DOI] [PMC free article] [PubMed] [Google Scholar]
- 52.Jeong M et al. Large conserved domains of low DNA methylation maintained by Dnmt3a. Nat. Genet. 46, 17–23 (2014). [DOI] [PMC free article] [PubMed] [Google Scholar]
- 53.Deaton AM & Bird A CpG islands and the regulation of transcription. Genes Dev. 25, 1010–1022 (2011). [DOI] [PMC free article] [PubMed] [Google Scholar]
- 54.Cheutin T & Cavalli G Polycomb silencing: from linear chromatin domains to 3D chromosome folding. Curr. Opin. Genet. Dev. 25, 30–37 (2014). [DOI] [PubMed] [Google Scholar]
- 55.Oksuz O et al. Capturing the onset of PRC2-mediated repressive domain formation. Mol. Cell 70, 1149–1162 e5 (2018). [DOI] [PMC free article] [PubMed] [Google Scholar]
- 56.Tropepe V et al. Direct neural fate specification from embryonic stem cells: a primitive mammalian neural stem cell stage acquired through a default mechanism. Neuron 30, 65–78 (2001). [DOI] [PubMed] [Google Scholar]
- 57.Darrow EM et al. Deletion of DXZ4 on the human inactive X chromosome alters higher-order genome architecture. Proc. Natl Acad. Sci. USA 113, E4504–E4512 (2016). [DOI] [PMC free article] [PubMed] [Google Scholar]
- 58.Delbarre E et al. PML protein organizes heterochromatin domains where it regulates histone H3.3 deposition by ATRX/DAXX. Genome Res. 27, 913–921 (2017). [DOI] [PMC free article] [PubMed] [Google Scholar]
References
- 59.Harrison SM, Dunwoodie SL, Arkell RM, Lehrach H & Beddington RS Isolation of novel tissue-specific genes from cDNA libraries representing the individual tissue constituents of the gastrulating mouse embryo. Development 121, 2479–2489 (1995). [DOI] [PubMed] [Google Scholar]
- 60.Nagy A, Gertsenstein M, Vintersten K & Behringer R Separating postimplantation germ layers. CSH Protoc. 2006, 10.1101/pdb.prot4368 (2006). [DOI] [PubMed] [Google Scholar]
- 61.sWang W, Zhang Y & Wang H Generating mouse models using zygote electroporation of nucleases (ZEN) Technology with high efficiency and throughput. Methods Mol. Biol. 1605, 219–230 (2017). [DOI] [PubMed] [Google Scholar]
- 62.Peng X et al. TELP, a sensitive and versatile library construction method for next-generation sequencing. Nucleic Acids Res. 43, e35 (2015). [DOI] [PMC free article] [PubMed] [Google Scholar]
- 63.Picelli S et al. Full-length RNA-seq from single cells using Smart-seq2. Nat. Protoc. 9, 171–181 (2014). [DOI] [PubMed] [Google Scholar]
- 64.Langmead B & Salzberg SL Fast gapped-read alignment with Bowtie 2. Nat. Methods 9, 357–359 (2012). [DOI] [PMC free article] [PubMed] [Google Scholar]
- 65.Trapnell C et al. Differential gene and transcript expression analysis of RNA-seq experiments with TopH at and Cufflinks. Nat. Protoc. 7,562–578 (2012). [DOI] [PMC free article] [PubMed] [Google Scholar]
- 66.Guo W et al. BS-Seeker2: a versatile aligning pipeline for bisulfite sequencing data. BMC Genomics 14, 774 (2013). [DOI] [PMC free article] [PubMed] [Google Scholar]
- 67.Durand NC et al. Juicer provides a one-click system for analyzing loop-resolution hi-C experiments. Cell Syst. 3, 95–98 (2016). [DOI] [PMC free article] [PubMed] [Google Scholar]
- 68.Zhang Y et al. Model-based analysis of ChIP-Seq (MACS). Genome Biol. 9, R137 (2008). [DOI] [PMC free article] [PubMed] [Google Scholar]
- 69.Love MI, Huber W & Anders S Moderated estimation of fold change and dispersion for RNA-seq data with DESeq2. Genome Biol. 15, 550 (2014). [DOI] [PMC free article] [PubMed] [Google Scholar]
- 70.Kent WJ et al. The human genome browser at UCSC. Genome Res. 12, 996–1006 (2002). [DOI] [PMC free article] [PubMed] [Google Scholar]
- 71.Dennis G Jr. et al. DAVID: Database for annotation, visualization, and integrated discovery. Genome Biol. 4, P3 (2003). [PubMed] [Google Scholar]
- 72.Durand NC et al. Juicebox provides a visualization system for hi-C contact maps with unlimited zoom. Cell Systems 3, 99–7101 (2016). [DOI] [PMC free article] [PubMed] [Google Scholar]
- 73.Yang X et al. Silencing of developmental genes by H3K27me3 and DNA methylation reflects the discrepant plasticity of embryonic and extraembryonic lineages. Cell Res. 28, 593–596 (2018). [DOI] [PMC free article] [PubMed] [Google Scholar]
Associated Data
This section collects any data citations, data availability statements, or supplementary materials included in this article.