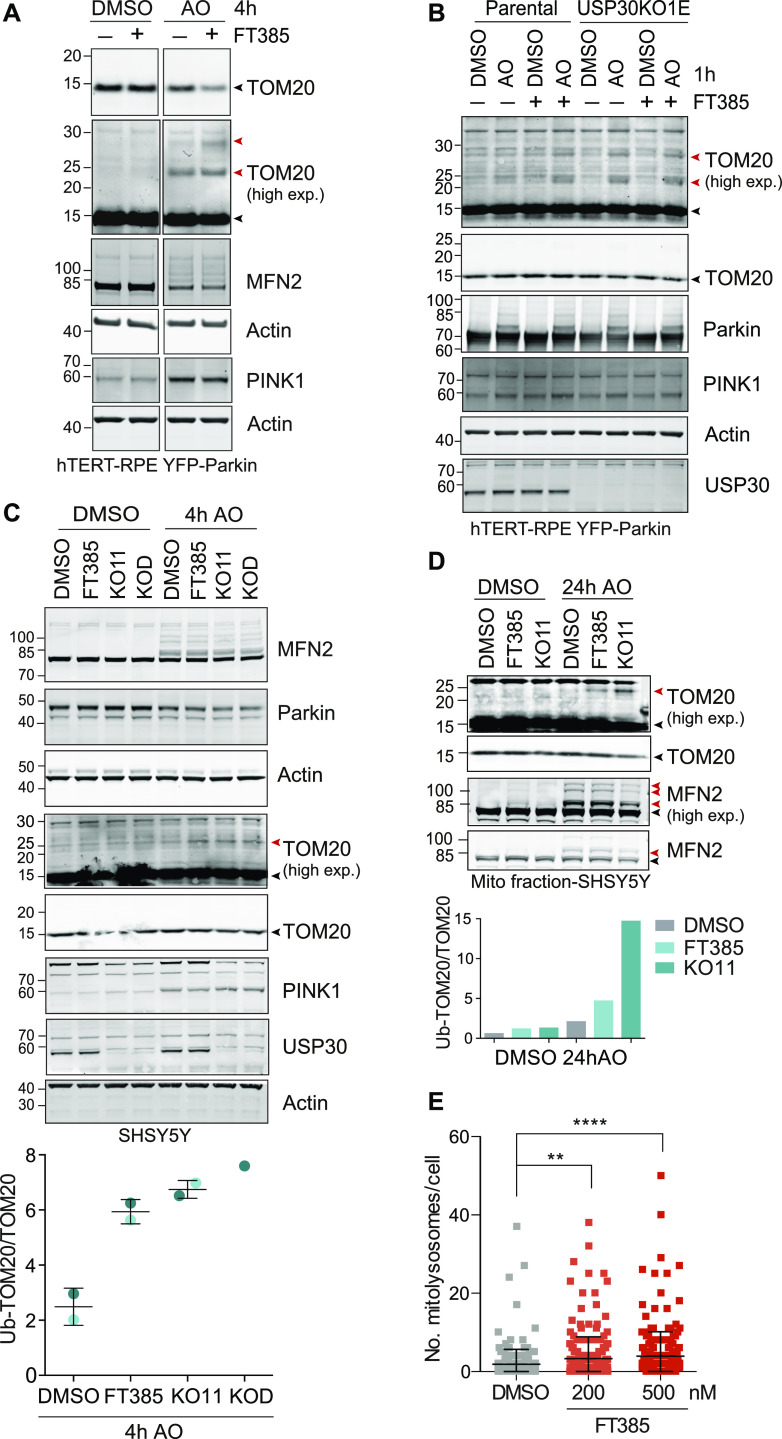
Figure 3. Pharmacological inhibition of USP30 phenocopies USP30 KO in enhancing basal mitophagy and promoting ubiquitylation of TOM20 upon depolarisation.
(A) Inhibition of USP30 enhances the ubiquitylation and degradation of TOM20 in YFP–Parkin overexpressing hTERT-RPE1 cells in response to mitophagy induction. Cells were treated for 4 h with DMSO or antimycin A and oligomycin A (AO; 1 μM each) in the absence or presence of 200 nM FT385, lysed, and analysed by Western blotting. (B) USP30 inhibitor (FT385) treatment of parental YFP-Parkin overexpressing hTERT-RPE1 cells phenocopies USP30 deletion (KO1E) by promoting TOM20 ubiquitylation. In contrast, TOM20 ubiquitylation is unaffected by FT385 in the USP30 KO (KO1E) cells. Cells were treated for 1 h with or without AO (1 μM) in the absence or presence of 200 nM FT385, lysed, and samples analysed by immunoblotting. (C) TOM20 ubiquitylation is enhanced by USP30 inhibition and deletion in SHSY5Y cells expressing endogenous Parkin. SHSY5Y with or without FT385 (200 nM) and USP30 CRISPR/Cas9 KO cells (KO11 and KOD, two distinct sgRNAs) were treated with AO (1 μM each) for 4 h as indicated. Cells were then lysed and samples analysed by immunoblotting as shown. Graph shows quantification of ubiquitylated TOM20 normalised to unmodified TOM20 for two independent experiments with individual data points shown in dark and light blue. Error bars indicate the range. (D) SHSY5Y (mitoQC) and USP30 KO cells (KO11) were treated for 24 h with AO (1 μM each) in the presence or absence of FT385 (100 nM). Cells were subjected to subcellular fractionation and the mitochondrial fraction (MF) was analysed by immunoblotting as indicated. Bar chart shows quantification of ubiquitylated TOM20 normalised to unmodified TOM20. (A, B, C, D) Black and red arrowheads indicate unmodified and ubiquitylated TOM20 or MFN2 species, respectively (high exp, higher exposure). (E) Quantification of the number of mitolysosomes in SHSY5Y-mitoQC cells, treated with DMSO or FT385 (200 or 500 nM) for 96 h before imaging. Average ± SD; n = 3 independent experiments; 80 cells per experiment; one-way ANOVA with Dunnett’s multiple comparisons test, **P < 0.01, ****P < 0.0001.
Source data are available for this figure.

