Abstract
Background
Whole body magnetic resonance imaging (MRI) is now incorporated into international guidance for imaging patients with multiple myeloma. The aim of this study was to investigate inter-observer agreement of triple reported baseline whole-body MRI in myeloma and highlight potential pitfalls.
Methods
Fifty-seven patients with symptomatic myeloma at first presentation or relapse and planned for autologous stem cell transplant were included. All patients completed baseline whole body MRI within 2 weeks prior to starting treatment. Each scan was reported independently by 3 radiologists using a defined scoring system. Differences in observer scores were compared using analysis of variance (ANOVA) and inter-observer agreement assessed using intra class correlation coefficient (ICC).
Results
There was no significant difference in mean observer scores for whole skeleton and ICC demonstrated excellent inter-observer agreement at 0.91. ICC varied between skeletal regions with spine, pelvis and ribs showing good inter-observer agreement, whereas skull and long bones were moderate. Scans with variation in observer scores were re-examined and cause of discrepancies identified. This information was used to describe potential anatomical pitfalls in reporting .
Conclusion
Whole-body MRI has excellent inter-observer agreement in reporting symptomatic myeloma at baseline. Inter-observer agreement varied between skeletal regions highlighting specific areas of difficulty.
Keywords: Multiple myeloma, Magnetic resonance imaging, MRI, Diffusion weighted imaging, Bone disease, Inter-observer agreement
Background
Magnetic resonance imaging (MRI) has higher specificity and sensitivity in the detection of focal lesions in multiple myeloma when compared with x-ray, computed tomography (CT) and Fluorodeoxyglucose (FDG) positron emission tomography (PET)-CT [1–4]. It can also detect myeloma infiltration within the bone marrow before the development of cortical bone destruction [5]. This provides prognostic information, as more than one focal lesion is associated with higher risk of disease progression [6, 7]. If disease can be detected early, and patients stratified and treated according to clinical risk, survival advantages are conferred [7–12]. MRI is therefore the gold standard imaging technique for assessment of bone marrow involvement in myeloma. The presence of > 1 focal lesion of at least 5 mm is considered evidence of symptomatic disease requiring treatment as per the International Myeloma Working Group (IMWG). Whole body (WB) MRI is also recommended by the IMWG for all patients with suspected myeloma and negative/inconclusive CT and is offered as an option for bone marrow imaging by the European Society for Medical Oncology guidelines [6, 13, 14]. In the UK WB MRI is recommended as first line imaging for all patients with a suspected new diagnosis of myeloma [15].
WB MRI has shown particular value in myeloma due to excellent image contrast between normal and diseased bone marrow. This has translated into improved sensitivity of lesion detection when compared with conventional MRI techniques [5]. It also has the unique ability to quantify differences in bone marrow through measurement of apparent diffusion coefficient (ADC). This has been shown to differentiate normal from myeloma infiltrated bone marrow with a sensitivity of 90% and specificity of 93% but can also be used to quantify response to treatment [5, 16, 17]. Recently the Myeloma Response Assessment and Diagnosis System (MY-RADS) was published outlining recommendations for standardised acquisition and reporting [18].
Data regarding the visual inter-observer agreement of WB MRI in myeloma is limited to a small series. While shown to be superior to that of skeletal survey, specific anatomical areas such as the skull and ribs were shown to be more challenging [2, 17]. We therefore investigated inter-observer variation of triple reported WB MRI in a prospective study.
Materials and methods
This was a single centre prospective study carried out in accordance with the Declaration of Helsinki (1996), with local Committee for Clinical Research and national Ethics Committee approval. Patients gave written consent to enter the study.
Study population
Fifty-seven patients with symptomatic myeloma as per IMWG criteria [19] completed WB MRI including diffusion weighted (DW) MRI sequences, within 2 weeks prior to starting treatment between November 2015 and February 2018. Patients included had new presentation or first relapse of myeloma and were planned for autologous stem cell transplant at the Royal Marsden Hospital. Exclusion criteria were MRI incompatible metal implants, claustrophobia or the diagnosis of other malignancies within the past 5 years.
Image acquisition
WB MRI studies were performed using an Avanto 1.5 T system (Siemens, Erlangen, Germany) as per the MY-RADS recommendations [18]. All subjects were scanned supine with arms by their sides. Coil elements were positioned from skull vertex to knees. Sagittal T1-weighted images (TR 590 ms, TE 11 ms, FOV 400 mm, slice thickness 4 mm), and T2-weighted images (TR 2690 ms, TE 93 ms, FOV 400 mm, slice thickness 4 mm) of the spine were acquired, followed by axial DW sequences (single-shot double spin echo echo-planar technique with STIR fat suppression in free breathing) using b-values of 50 and 900 s/mm2 applied in 3 orthogonal directions and combined to the isotropic trace images. DW images were acquired in multiple contiguous stations of 50 slices per station (slice thickness 5 mm, no gap, FOV 430 mm, phase direction AP, parallel imaging (GRAPPA) factor 2, TR 14800 ms, TE 66 ms, inversion time (TI) 180 ms, voxel size 2.9 mm × 2.9 mm × 5 mm, number of signal averages 4, matrix 150 × 150, bandwidth 1960 Hz per pixel). Axial T1-weighted Vibe Dixon 3D gradient echo breath-hold sequences (52 slices per slab, FOV 470 mm, TR/TE 7/2.38, 4.76 ms, flip angle 30, matrix 192 × 192) were also acquired, matching the acquisition stacks and partition thickness to the DW images. No intravenous gadolinium contrast was used.
Image analyses
Images were scored independently by 3 radiologists (> 8 years of experience) based on a previously described WB DW score [2, 17]. Focal disease of each skeletal region (cervical spine, dorsal spine, lumber spine, pelvis, long bones, skull, ribs/other) was scored (3, 2, 1) for number (> 20, 10–20, < 10) and size (> 20,10–20, < 10 mm) of lesions respectively.
Statistical analyses
One-way analysis of variance (ANOVA) was used to compare the mean difference in observer scores for whole skeleton and individual skeletal regions. Tukey Honest Significant Differences (Tukey HSD) was used to perform multiple pairwise comparisons of mean scores between each observer if ANOVA was consistent with a significant difference. A two-sided P-value of ≤0.05 was considered statistically significant. Inter-observer agreement was described using the intra class correlation coefficient (ICC). ICC estimates and corresponding 95% confident intervals were calculated using R package psych, based on two-way mixed effects, consistency, and single rater measurement. An ICC of < 0.5 was considered poor, 0.5–0.75 moderate, 0.75–0.9 good and > 0.9 excellent as previously reported [20].
Results
A total of 57 patients were included in his study (32 male, 25 female, age range 31–71). Of these 45 were newly diagnosed and 12 at first relapse. All patients at first relapse achieved > 18 months progression free survival from previous transplant. Induction regimens prior to first transplant involved triplet combinations that included proteasome inhibitor (PI) and immunomodulatory (IMiD) in 75%, IMiD only (17%) and PI only (8%). 75% of patients proceeded successfully to planned autologous stem cell transplant. Patient demographics can be seen in Table 1.
Table 1.
Patient demographics at study baseline
| Sex, n (%) | Male | 32 (56) |
| Female | 25 (44) | |
| Mean age, years (range) | 58 (31–71) | |
| Isotype, n (%) | IgA | 4 (7) |
| IgG | 33 (58) | |
| LCO | 3 (23) | |
| NS | 3 (5) | |
| Unknown | 3 (5) | |
| Time-point, n (%) | Presentation | 45 (79) |
| 1st Relapse | 12 (21) |
LCO Light chain only, NS Non secretory, PP Paraprotein, SFLC Serum free light chain
WB DW scores
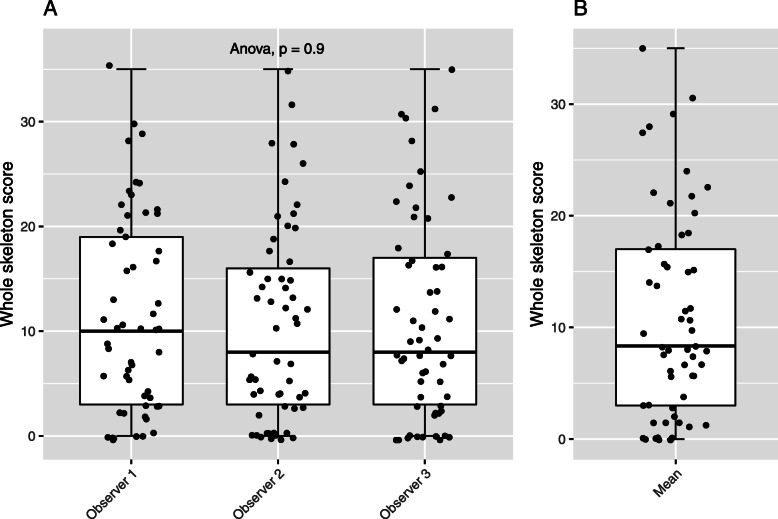
Distribution of bone disease was varied with whole skeleton scores ranging from 0 to 35. The mean score per skeletal region was lowest in the cervical spine (0.72) and highest in the pelvis (2.29). Distribution of mean whole skeleton scores per patient is shown in Fig. 1.
Fig. 1.
Whole skeleton scores (a) per observer, (b) mean scores
Mean observer scores for whole skeleton and individual skeletal regions are shown in Table 2 and comparison of whole skeleton scores per observer is demonstrated in Fig. 1. There was no significant difference between mean observer scores for whole skeleton or individual skeletal regions suggesting high inter-observer agreement. Pairwise comparison of observers also confirmed no significant difference in mean scores.
Table 2.
Mean, standard deviation (SD) and range of combined scores for size and number of focal lesions per skeletal region. Statistical difference calculated using ANOVA
| Observer 1 | Observer 2 | Observer 3 | ||||||||
|---|---|---|---|---|---|---|---|---|---|---|
| Region | Mean | SD | Range | Mean | SD | Range | Mean | SD | Range | ANOVA (p value) |
| Cervical Spine | 0.77 | 1.34 | 0–5 | 0.68 | 1.27 | 0–4 | 0.65 | 1.34 | 0–6 | 0.88 |
| Dorsal Spine | 1.88 | 1.96 | 0–6 | 1.53 | 1.95 | 0–6 | 1.67 | 1.92 | 0–6 | 0.63 |
| Lumbar Spine | 1.39 | 1.68 | 0–6 | 1.32 | 1.69 | 0–5 | 1.33 | 1.76 | 0–6 | 0.95 |
| Pelvis | 2.35 | 2.22 | 0–6 | 2.21 | 2.41 | 0–6 | 2.30 | 2.25 | 0–6 | 0.93 |
| Long Bones | 1.95 | 1.87 | 0–6 | 1.91 | 2.12 | 0–6 | 2.05 | 2.02 | 0–6 | 0.97 |
| Skull | 0.67 | 1.30 | 0–4 | 0.98 | 1.38 | 0–4 | 0.72 | 1.25 | 0–4 | 0.55 |
| Ribs | 2.19 | 2.34 | 0–6 | 1.77 | 2.29 | 0–6 | 2.18 | 2.35 | 0–6 | 0.39 |
| Whole Skeleton | 11.19 | 9.43 | 0–35 | 10.40 | 9.35 | 0–35 | 10.89 | 9.61 | 0–35 | 0.90 |
The ICC [20] for whole skeleton and individual skeletal regions are shown in Table 3. There was excellent inter-observer reliability overall with whole skeleton ICC 0.91 (95% CI 0.87–0.94). Spine, pelvis and ribs all showed good inter-observer reliability with ICC ranging from 0.79–0.87, whereas long bones and skull were moderate. The ICC for the skull was 0.62 [95% CI 0.51–0.72] indicating worse inter-observer reliability compared to other skeletal regions, this is consistent with previous reports comparing MRI to skeletal survey [2].
Table 3.
Intraclass correlation coefficient between observer scores per skeletal region
| Region | ICC | 95% CI |
|---|---|---|
| Cervical Spine | 0.84 | 0.78–0.89 |
| Dorsal Spine | 0.85 | 0.80–0.90 |
| Lumbar Spine | 0.87 | 0.81–0.91 |
| Pelvis | 0.79 | 0.72–0.85 |
| Long Bones | 0.74 | 0.65–0.81 |
| Skull | 0.62 | 0.51–0.72 |
| Ribs | 0.82 | 0.76–0.88 |
| Whole skeleton | 0.91 | 0.87–0.94 |
CI Confidence intervals
Discussion
This study investigated inter-observer agreement of WB MRI for baseline assessment of myeloma related bone disease in symptomatic patients at presentation or first relapse. Using ICC we demonstrate overall excellent inter-observer reliability on a simple scoring system, based on the number and size of focal lesions detected. When compared with previous studies, the ICC values were superior [2], which likely reflects growing expertise and knowledge of the technique. This is further highlighted by lack of significant difference in mean observer scores, an observation Giles et al. were previously unable to demonstrate [17]. With the exception of the skull, our ICC values were also consistently higher than those previously reported for skeletal survey [2], consolidating evidence for the superiority of WB MRI in the assessment of myeloma related bone disease.
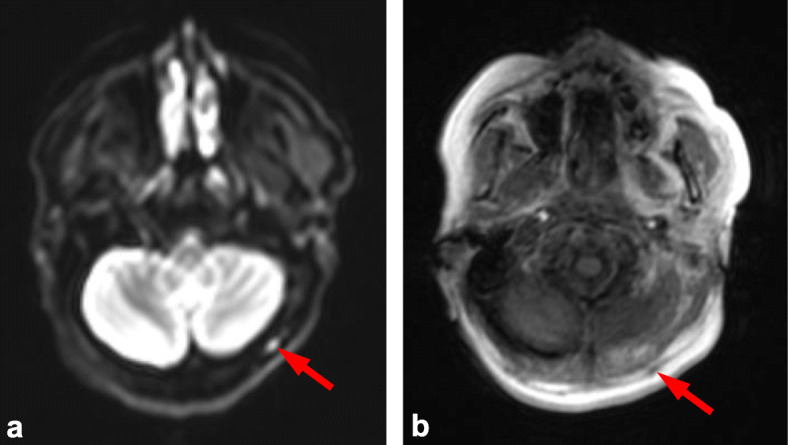
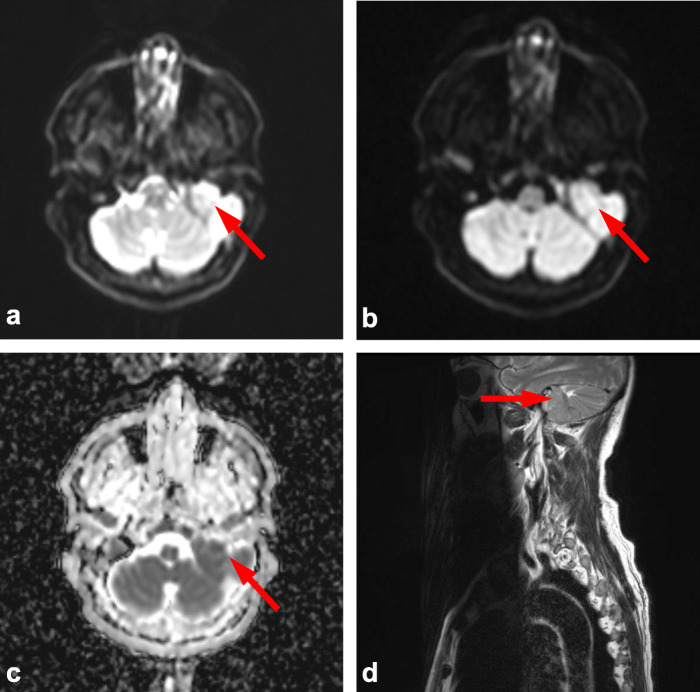
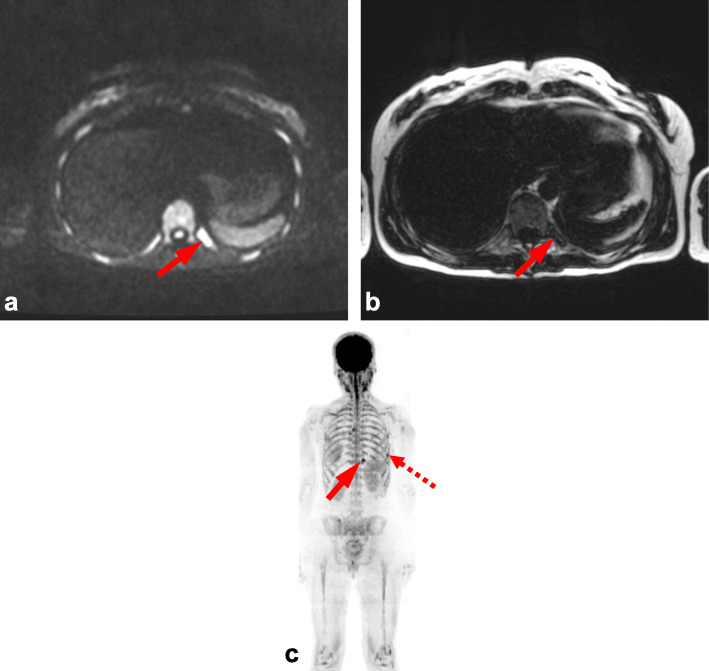
Variation between skeletal regions suggests that certain anatomical sites can be more challenging to score. Consistent with previous studies this was most notable in the skull, which is likely due to difficulties in interrogating relatively small marrow volume against adjacent high diffusion signal of the brain (Figs. 2 and 3) [5]. This limitation is paralleled in PET-CT where high FDG uptake of the brain also leads to difficulty in reporting adjacent bone lesions. Conversely, false positive results can occur with plain film of the skull due to venous lakes and arachnoid granulations [5]. Marrow assessment in the femora is also widely acknowledged to be challenging as areas of red marrow regeneration in the proximal femora can appear hypercellular mimicking disease and this uncertainty was reflected in a moderate ICC (0.74). Figure 4 demonstrates a focal rib lesion superimposed on diffuse marrow infiltration. Diffuse high signal throughout the ribs caused one observer to miss the focal lesion. Guidance from the IMWG advises anti-myeloma therapy for patients with> 1 focal lesion of > 5 mm. Therefore, false positive or negative reporting of any focal lesions could have significant clinical impact, highlighting the importance of examples we report. Knowledge and identification of such pitfalls are important to facilitate education and improve reporting accuracy.
Fig. 2.
Base of skull lesion. Observer score variation within the skull due to large base of skull lesion (arrows) shown by (a) axial b50 DW MRI, b axial b900 DW MRI, c corresponding ADC map and (d) sagittal T2 weighted MRI of upper spine. Both brain and skull lesion have high diffusion signal (a-b) with low ADC (c), due to close proximity one observer reported images as normal
Fig. 3.

Thickening of subcutaneous facia. Observer score variation within the skull due to thickening of subcutaneous fascia (arrows) shown by (a) axial b900 DW MRI and (b) axial in-phase Dixon MRI. High diffusion signal leads to a false positive report of a skull lesion (arrow a), in-phase Dixon images show the lesion to not be within the skull and instead relate to thickening of subcutaneous facia (arrow b). Synonymous to this we also found sub-occipital lymph nodes can lead to false positive reporting of focal lesions within the skull
Fig. 4.
Focal lesion of ribs. Observer score variation within the ribs due to focal lesion (arrows) superimposed on diffuse marrow infiltration, shown by (a) axial b900 DW MRI, b axial fat-only Dixon and (c) b900 maximum intensity projection (MIP). Diffuse marrow infiltration results in high diffusion signal throughout ribs (a, c) which conceals superimposed focal lesion (arrow a). Fat only Dixon and MIP facilitate focal lesion differentiation (arrows b, c). Note MIP also demonstrates second focal lesion (dashed arrow c)
Although the mixed cohort of patients with a new diagnosis of myeloma and relapsed myeloma reflects real world application, the imbalance of the classes (45 newly diagnosed and 12 relapsed) negates separate analysis. Background changes in bone marrow post treatment could make assessment more challenging and this has not been explored.
Conclusion
WB MRI has excellent overall inter-observer reliability for the visual assessment of bone disease in symptomatic patients with multiple myeloma at presentation or first relapse. As with all imaging modalities, pitfalls in visual reporting exist and by reporting our own experience we hope to facilitate ongoing improvement to enable effective utilisation of the technique.
Acknowledgements
We acknowledge Cancer Research UK (https://www.cancerresearchuk.org/) and Engineering and Physical Sciences Research Council support to the Cancer Imaging Centre at Institute of Cancer Research and Royal Marsden Hospital in association with Medical Research Council and Department of Health C1060/A10334, C1060/A16464 and National Health Service funding to the National Institute for Health Research (https://www.nihr.ac.uk/) Biomedical Research Centre, Clinical Research Facility in Imaging and the Cancer Research Network.
Abbreviations
- MRI
Magnetic resonance imaging
- ICC
Intra class correlation coefficient
- CT
Computed tomography
- FDG
Fluorodeoxyglucose
- PET
Positron emission tomography
- IMWG
International Myeloma Working Group
- WB
Whole body
- DW
Diffusion weighted
- ADC
Apparent diffusion coefficient
- MY-RADS
Myeloma Response Assessment and Diagnosis System
- PI
Proteasome inhibitor
- IMiD
Immunomodulatory drug
- LCO
Light chain only
- NS
Non secretory
Authors’ contributions
CM, JC, MK designed study. Patient recruitment CM, JC, MK and KB. Image acquisition MK, CM. Image reporting/scoring CM, AR and KD. Data analysis and interpretation JC and CM. Manuscript written – all authors contributed. All authors read and approved final manuscript.
Funding
This report is independent research funded by the National Institute for Health Research. The views expressed in this publication are those of the author(s) and not necessarily those of the National Health Service, the National Institute for Health Research or the Department of Health.
Availability of data and materials
The datasets used and analysed during the current study are available from the corresponding author on reasonable request.
Ethics approval and consent to participate
This study was approved by local Committee for Clinical Research and national Ethics Committee.
Consent for publication
Written informed consent was obtained from each patient.
Competing interests
The authors declare that they have no competing interests.
Footnotes
Publisher’s Note
Springer Nature remains neutral with regard to jurisdictional claims in published maps and institutional affiliations.
References
- 1.Messiou C, Kaiser M. Whole-body imaging in multiple myeloma. Magn Reson Imaging Clin N Am. 2018;26(4):509–525. doi: 10.1016/j.mric.2018.06.006. [DOI] [PubMed] [Google Scholar]
- 2.Giles SL, et al. Assessing myeloma bone disease with whole-body diffusion-weighted imaging: comparison with x-ray skeletal survey by region and relationship with laboratory estimates of disease burden. Clin Radiol. 2015;70(6):614–621. doi: 10.1016/j.crad.2015.02.013. [DOI] [PMC free article] [PubMed] [Google Scholar]
- 3.Pawlyn C, et al. Whole-body diffusion-weighted MRI: a new gold standard for assessing disease burden in patients with multiple myeloma? Leukemia. 2016;30(6):1446–1448. doi: 10.1038/leu.2015.338. [DOI] [PMC free article] [PubMed] [Google Scholar]
- 4.Rasche L, et al. Low expression of hexokinase-2 is associated with false-negative FDG-positron emission tomography in multiple myeloma. Blood. 2017;130(1):30–34. doi: 10.1182/blood-2017-03-774422. [DOI] [PMC free article] [PubMed] [Google Scholar]
- 5.Messiou C, Kaiser M. Whole body diffusion weighted MRI--a new view of myeloma. Br J Haematol. 2015;171(1):29–37. doi: 10.1111/bjh.13509. [DOI] [PMC free article] [PubMed] [Google Scholar]
- 6.Dimopoulos MA, et al. Role of magnetic resonance imaging in the management of patients with multiple myeloma: a consensus statement. J Clin Oncol. 2015;33(6):657–664. doi: 10.1200/JCO.2014.57.9961. [DOI] [PubMed] [Google Scholar]
- 7.Hillengass J, et al. Prognostic significance of focal lesions in whole-body magnetic resonance imaging in patients with asymptomatic multiple myeloma. J Clin Oncol. 2010;28(9):1606–1610. doi: 10.1200/JCO.2009.25.5356. [DOI] [PubMed] [Google Scholar]
- 8.Merz M, et al. Predictive value of longitudinal whole-body magnetic resonance imaging in patients with smoldering multiple myeloma. Leukemia. 2014;28(9):1902–1908. doi: 10.1038/leu.2014.75. [DOI] [PubMed] [Google Scholar]
- 9.Kastritis E, et al. Extensive bone marrow infiltration and abnormal free light chain ratio identifies patients with asymptomatic myeloma at high risk for progression to symptomatic disease. Leukemia. 2013;27(4):947–953. doi: 10.1038/leu.2012.309. [DOI] [PubMed] [Google Scholar]
- 10.Mateos MV, et al. Lenalidomide plus dexamethasone for high-risk smoldering multiple myeloma. N Engl J Med. 2013;369(5):438–447. doi: 10.1056/NEJMoa1300439. [DOI] [PubMed] [Google Scholar]
- 11.Moulopoulos LA, et al. Prognostic significance of magnetic resonance imaging of bone marrow in previously untreated patients with multiple myeloma. Ann Oncol. 2005;16(11):1824–1828. doi: 10.1093/annonc/mdi362. [DOI] [PubMed] [Google Scholar]
- 12.Mai EK, et al. A magnetic resonance imaging-based prognostic scoring system to predict outcome in transplant-eligible patients with multiple myeloma. Haematologica. 2015;100(6):818–825. doi: 10.3324/haematol.2015.124115. [DOI] [PMC free article] [PubMed] [Google Scholar]
- 13.Hillengass J, et al. International myeloma working group consensus recommendations on imaging in monoclonal plasma cell disorders. Lancet Oncol. 2019;20(6):e302–e312. doi: 10.1016/S1470-2045(19)30309-2. [DOI] [PubMed] [Google Scholar]
- 14.Moreau P, et al. Multiple myeloma: ESMO Clinical Practice Guidelines for diagnosis, treatment and follow-up. Ann Oncol. 2017;28(suppl_4):iv52–iv61. doi: 10.1093/annonc/mdx096. [DOI] [PubMed] [Google Scholar]
- 15.Chantry A, et al. Guidelines for the use of imaging in the management of patients with myeloma. Br J Haematol. 2017;178(3):380–393. doi: 10.1111/bjh.14827. [DOI] [PubMed] [Google Scholar]
- 16.Messiou C, et al. Assessing response of myeloma bone disease with diffusion-weighted MRI. Br J Radiol. 2012;85(1020):e1198–e1203. doi: 10.1259/bjr/52759767. [DOI] [PMC free article] [PubMed] [Google Scholar]
- 17.Giles SL, et al. Whole-body diffusion-weighted MR imaging for assessment of treatment response in myeloma. Radiology. 2014;271(3):785–794. doi: 10.1148/radiol.13131529. [DOI] [PubMed] [Google Scholar]
- 18.Messiou C, et al. Guidelines for acquisition, interpretation, and reporting of whole-body MRI in myeloma: myeloma response assessment and diagnosis system (MY-RADS) Radiology. 2019;291(1):5–13. doi: 10.1148/radiol.2019181949. [DOI] [PubMed] [Google Scholar]
- 19.Rajkumar SV. Updated diagnostic criteria and staging system for multiple myeloma. Am Soc Clin Oncol Educ Book. 2016;35:e418–e423. doi: 10.14694/EDBK_159009. [DOI] [PubMed] [Google Scholar]
- 20.Koo TK, Li MY. A guideline of selecting and reporting Intraclass correlation coefficients for reliability research. J Chiropr Med. 2016;15(2):155–163. doi: 10.1016/j.jcm.2016.02.012. [DOI] [PMC free article] [PubMed] [Google Scholar]
Associated Data
This section collects any data citations, data availability statements, or supplementary materials included in this article.
Data Availability Statement
The datasets used and analysed during the current study are available from the corresponding author on reasonable request.


