

Abstract
Gut microbiome plays fundamental roles in host physiology, and gut microbial metabolism is important to the host-microbiome homeostasis. As major contributors to gut microbial metabolism, the medium nutritional components are essential to in vitro gut microbiome growths, and four nutrients, namely inorganic salts, bile salts, short chain fatty acids (SCFAs), and mucin, have gained particular attention because their significant variation found in different growth environments and their ability to modulate the gut microbial population and functions. However, a systematic study is lacking to evaluate the effects of these four nutrients on gut microbiome in terms of their impact to the microbial metabolic profiles. To fill the gap of the knowledge, we applied mass spectrometry based targeted metabolomics approach to study the regulation effects of these four medium components on in vitro cultured gut microbiota. Our results show inorganic salts and mucin had the greatest impacts on the gut microbiome metabolic profile compared to the other components studied, with gut microbial cultures grown with low concentration inorganic salts and mucin supplemented medium demonstrating greater numbers of metabolites detected. We also applied metabolic pathway impact analysis which reveled several significantly impacted metabolic pathways during the comparison of different medium supplements, which could further assist our understanding of the overall impacts of certain critical nutrients on gut microbial metabolism. In summary, this pilot study can serve as a first attempt to evaluate individual nutritional component in their contribution to gut microbial metabolic functions.
Keywords: Gut microbiome, metabolomics, targeted mass spectrometry, medium nutrition
Graphical Abstract
Introduction
The human gut microbiome has been linked to both human health and disease.1–3 As a consequence, targeting the gut microbiota using drug therapeutics has become popular as well as the increasing interest in understanding how gut microbiome responds to the therapies.4–5 In vivo animal and human models have been used to study the function and dynamics of host-associated microbiomes.6–8 However, logistical constraints limited the usages of these models and thus, compounds were generally tested using cultured bacterium and microbiome.9–10 Instead of culturing single bacteria in vitro, culturing the whole gut microbiome can reveal the direct interaction between gut microbiome and nutritional components, and it is an approach that helps to provide invaluable evidence to guide further nutritional studies that investigating nutrient-gut microbe interactions.
Previous studies suggested that the interaction between the microbiota and the host are often mediated by bacterial metabolites, such as amino acids, short chain fatty acids (SCFAs) and vitamins.6, 11 In order to investigate the gut microbiota metabolic capacity and the metabolic interactions among different microbiome communities, an in vitro culture-based model system is essential for preliminary studies. However, the complex composition of culturing medium has been rarely defined.12 Consequently, a severe limitation on mechanistic investigations of community functions, for example, identifying cross-fed metabolites or correlating functional metabolites to their producers, is obstructing the progress in studying the gut microbiome.13
Nutritional components in the culture medium are key determinants for the performance of in vitro culture systems of gut microbes.5 Gifu Anaerobic medium (GAM) is recommended as a general culture medium for cultivation and isolation of anaerobic bacteria and to test their susceptibility to antibiotics other than sulfa drugs. Composition of GAM broth includes yeast, beef and liver extract, peptone, inorganic salts, and bile salts. Previous studies performed by other researchers have demonstrated how the nutrients contents modifications can alter the microbial communities and increase the diversity of the gut bacterial community.14–15 However, there is still a lack of a systematical evaluation of how some vital nutrients impact the metabolome of gut microbiome. Four nutrients, inorganic salts, bile salts, SCFAs, and mucin have caught particularly attentions since they can vary significantly in different growth environments.5 Therefore, it can be helpful to understand the holistic impact of these nutrients on the gut microbiome and their metabolites, and the gained knowledge can also be used as scientific evidence for choosing the optimal medium compositions for culturing gut microbiota in vitro.
In this study, we designed experiments to test the impact of four medium components (inorganic salts, mucin, bile salts, and SCFAs) on the metabolic profiles of cultured human gut microbiome by utilizing a targeted metabolomics approach. A high-performance liquid chromatography-triple quadrupole mass spectrometry (HPLC-QQQ-MS) was used to analyze the metabolic differences of gut microbiome incubated with different medium components. The goal of this study is to reveal the influences of several essential nutritional components on the metabolome of the complex gut microbiome cultured anaerobically in vitro. The discovery work performed can be used to further improve our understanding of gut microbial metabolism and their potential impact to human host.
Materials & method
Human Gut Microbiota
Human gut microbiota was cultured from the fecal samples of two healthy volunteers by following a gut bacterial isolation and enrichment procedure published before.16 The fecal content was vortexed and suspended in pre-reduce PBS with 0.1% cysteine. The diluted suspension was plated on Gifu Anaerobic (GAM) Agar plate (HiMedia Laboratories LLC, West Chester, PA, USA) for 48 h at 37 °C in an anaerobic environment inside a type A vinyl anaerobic chamber (COY lab, Grass Lake, MI, USA). A sterilized wire loop was used to inoculate multiple colonies from the agar plate to GAM broth and incubated for 48 hours under the same condition as stated above.
Experimental design
In this study, experiments were designed for the evaluation of the influences of different medium components towards gut microbiome when cultured in vitro.5 Briefly, all experimental groups were assigned to one or multiple supplements of the four factors (inorganic salts, mucin, bile salts, and short chain fatty acids) during the gut microbial growth in GAM evaluate one-factor and multi-factor interactions. A group of cultures grown in base GAM medium were included and served as a baseline comparison. Gut microbiomes were donated from volunteer and were cultured for 48 hours under anaerobic condition in four replicates in each treatment group, to give a total of 64 cultured samples in this study. Optical density (OD) value of each cultured sample was measured at 595 nm. All samples were extracted by a cold methanol metabolite extraction method and analyzed by LC-MS/MS system for target metabolites analysis. The metabolite level was then normalized by the OD value of each biological replicate, then log-transferred and put through autoscaling to minimize the possible bias from skewed distribution from the raw data.
Culture medium preparation
Sixteen variety of freshly prepared culture medium were included in this study and listed in Table 1. All medium were made and modified from GAM broth which contains 2.5 g L−1 proteose peptone, 3.4 g L−1 digested serum, 1.25 g L−1 yeast extract, 0.55 g L−1 beef extract, 0.75 g L−1 dextrose, 0.625 g L−1 KH2PO4, 0.75 g L−1 NaCl, 1.25 g L−1 starch, 0.075 g L−1 L-Cysteine hydrochloride, 0.075 g L−1 sodium thioglycolate, 2 mL L−1 Tween 80, 5 mg L−1 Hemin and 10 μL L−1 vitamin K1. The low concentration inorganic salts (LCIS) groups were prepared referencing to basal culture medium (BCM) with modification, which was to add 0.08 g L−1 K2HPO4, 0.01 g L−1 MgSO4, 0.01 g L−1 CaCl2 and 2 g L−1 NaHCO3 to the GAM medium;5 the high concentration inorganic salts (HCIS) groups were prepared by adding 0.8 g L−1 K2HPO4, 0.1 g L−1 MgSO4, 0.1 g L−1 CaCl2 and 20 g L−1 NaHCO3 to the GAM medium.17 0.5 g L−1 bile salts was supplemented to medium 1, 2, 6 and 8 in both LCIS and HCIS groups; 4 g L−1 mucin was supplemented to medium 1, 2, 3 and 7 in both LCIS and HCIS groups; and medium 1, 5, 6 and 7 in both LCIS and HCIS groups were supplemented with a SCFA mixture (Sigma-Aldrich, St. Louis, MO, USA) to reach the final concentration of 1 mM.12
Table 1.
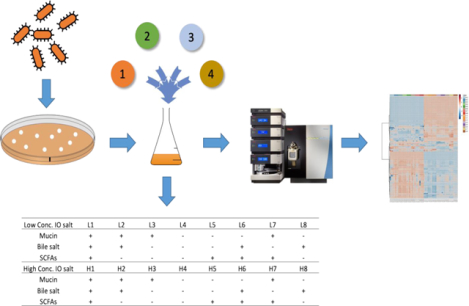
Experiment design and group information. In groups of low (L) and high (H) concentration inorganic salts, group 1, 2, 3 and 7 were treated with mucin; group 1, 2, 6 and 8 were treated with bile salt and group 1, 5, 6 and 7 were treated with short-chain fatty acid mix.
| Low Conc. IO salt | Mucin | Bile salt | SCFAs | High Conc. IO salt | Mucin | Bile salt | SCFAs | |
|---|---|---|---|---|---|---|---|---|
| L1 | + | + | + | H1 | + | + | + | |
| L2 | + | + | − | H2 | + | + | − | |
| L3 | + | − | − | H3 | + | − | − | |
| L4 | − | − | − | H4 | − | − | − | |
| L5 | − | − | + | H5 | − | − | + | |
| L6 | − | + | + | H6 | − | + | + | |
| L7 | + | − | + | H7 | + | − | + | |
| L8 | − | + | − | H8 | − | + | − |
Metabolites extraction
Metabolites extraction of intracellular contents of bacterial cells were prepared using a cold methanol method following the sampling protocol from our previous work18. Briefly, 1 mL bacterial culture was taken from the culture tube, then followed by two rounds of rapid centrifugation and phosphate buffer saline (PBS) wash. 250 μL methanol plus 50 μL of C13N15 labeled internal standards mixture was added to the cell pellet in the tube, and the samples were vortexed vigorously for 2 min. After incubation at −20 °C for 20 mins, 150 μL supernatant was collected and dried by using a Speedvac system and centrifugation. Samples were then reconstituted by using 250 μL 1:1 mixture of acetonitrile and ultrapure water and loaded into liquid chromatography vials for analysis.
Metabolic profiling
Both positive and negative mode detection were performed on a Thermo Scientific TSQ Quantiva triple quadrupole mass spectrometer equipped with an electrospray ionization source, which coupled with a Thermo Scientific Ultimate 3000 high performance liquid chromatography (HPLC) equipped with a 2.1×150 mm, 2.5 μm hydrophilic interaction chromatography (HILIC) amide column (Waters Corporation, Milford, MA, USA),. Metabolites separation was completed on HPLC by eluting the extracted bacterial intracellular samples through the column. The reconstituted samples were gradient-eluted at 0.300 mL/min using solvents A (5 mM ammonium acetate in 90% water / 10% acetonitrile + 0.2% acetic acid) and B (5 mM ammonium acetate in 90% acetonitrile / 10% water + 0.2% acetic acid). The auto-sampler temperature was kept at 4 °C, the column compartment was kept at 40 °C, and the separation time for each sample was 20 min. Retention time and selected reaction monitoring (SRM) transition of targeted metabolites were established by running pure standards (purchased from Sigma, Saint Louis, MO, USA and IROA Technology, Boston, MA) and collecting the tandem mass spectrum (MS/MS), so the orthogonal information of retention time and two pairs of SRM transitions can be used to confidently detect and identify targeted compounds. Stable 13C and 15N universal labeled amino acid mix (Cambridge Isotope, Tewksbury, MA, USA) was used as internal standards for quality control purpose. Pooled quality control samples were also tested in between every ten samples to monitor the instrument stability. The mass spectrometry data have been deposited to the MassIVE datasets (https://massive.ucsd.edu/ProteoSAFe/dataset.jsp?task=66b7afdf91574567bea8bf95c8199715) with the data set identifier MSV000084888.
Statistical analyses
The Quanbrowser module of Xcalibur 4.0 was used to manually process targeted metabolite profiling data. Acquired peak intensities were normalized to corresponding optical density values at 595 nm wavelength of the gut microbial culture. MetaboAnalyst 4.0 was used for statistical analysis (http://www.metaboanalyst.ca/). Peak intensities were subjected to a log transform and auto-scaling to achieve an approximately normal distribution. ANOVA module, a principal component analysis module, and heatmap module, as well as pathway analysis module, were used for data analysis and visualization.
Results & Discussion
Targeted metabolic profiling differentiates the gut microbial growth in LCIS and HCIS
Detailed experiment design of the multiple medium components used to supplement with the base medium were shown in Table 1. The OD results showed gut microbiome treated with LCIS were generally growing better than those treated with HCIS, as the mean OD value of L1, L2 L3 and L7 were 0.642, 0.647, 0.742 and 0.671, respectively. The ODs of the rest LCIS groups (L4–6 and L8) were all above 0.3. However, gut microbiome treated with HCIS showed relative lower OD values, even the top three OD values (0.456, 0.386 and 0.340 correspond to H1, H8 and H2, respectively) were significantly lower than the same nutrition combinations in the LCIS groups. The workflow shows as Figure 1 and as a result, a total of 122 polar metabolites were detected based on our targeted method with 84 out of 122 found in high concentration inorganic salts groups and 112 out of 122 can be found in low concentration inorganic salts groups. We first evaluate the average coefficient of variation (CV) for all the detected metabolites, and an average CV value of 14.87% indicated a good reproducibility of our experiments. A list of detected metabolites in this study can be found in supplementary Table 1 (Table S1).
Figure 1.

Workflow of this study. The multi-components experimental design was used to evaluate the gut microbiome cultured with base media enriched with four nutritional components: (1) inorganic salts, (2) bile salts, (3) SCFAs and (4) mucin. Post incubation, the intracellular metabolites of each sample were extracted and analyzed by a HPLC-QQQ-MS metabolomics platform and followed by multivariate statistical analysis.
We then applied statistical analysis on all samples to tease out major and minor nutritional factors that can shape the overall metabolic profiles of cultured gut microbes. Based on the ANOVA test, 115 out of the 122 detected metabolites were significantly different among the tested groups. Figure 2a showed the PCA score plot of all 16 test groups, with the x-axis and y-axis represent the 1st and 2nd principal component that contributes the most to the characteristic major metabolic impacts of the tested medium components, which resulted in 71.1% variation summarized by PC1 and 8.3% for PC2. The colors represent different group sets while the ovals represent 95% confidential level. Figure 2b demonstrated the metabolic profile of all sample groups involved in this study. Each column represents one biological replicate of gut microbial samples with corresponding nutrition supplementation, while each row represents individual metabolite. The color indicates the expression level of each metabolite, as dark red means the highest abundance and dark blue indicates the lowest abundance of a metabolite in the sample. The heat map analysis reveals a significantly different metabolic profile of gut microbiome when treated with different concentration of inorganic salts. As seen in Figure 2a, two major clusters of samples, determined by metabolic profiles generated by LCIS and HCIS groups were clearly separated. The effects of the other factors involved in this study, for instance, mucin, bile salts, and short chain fatty acids were less dominant in this PCA because of the tremendous influence by inorganic salts. This overviewed metabolic profile indicated a greater impact of medium inorganic salts on the gut microbiota in terms of metabolites abundance than other factors tested in this study. To analyze the detailed metabolite features of inorganic salts assignments, we conducted a comparison between L-4 and H-4 groups, which were only assigned differently in the concentrations of inorganic salts. As seen in Figure S1, the LCIS groups are significantly different from HCIS groups, and a detailed list of metabolites that have significant differences (p-value <0.01 and fold change (FC) >2) in comparison with LCIS and HCIS are shown in Table S2. Although the widely held notion indicated that most bacteria need inorganic salts for good growth,17, 19–20 low-concentration inorganic salts results in more metabolites detected than high-concentration in this study. As our results turned out, medium with low inorganic salts concentration can support gut bacteria growth which in turn resulted in a significantly larger number (23% increase) of metabolites that can be detected above detection threshold. On the other hand, previous study pointed out that inorganic salts content may induce an environment of oxidative stress because low concentration of such substrate in medium causes an inadequate redox potential in the medium.5 For example, metabolites such as 5-hydroxymethyluracil and indole-3-acetate detected in our study can barely be detected with a higher inorganic salt concentration medium (Figure S1b and S1c). 5-Hydroxymethyluracil is a significant product of radiation damage or the chemical oxidants generated by activated polymorphonuclear neutrophils,21 while indole-3-acetate has been reported as a substrate that can induce the lipid peroxidation.22 These results make it difficult to come with a conclusion whether inorganic salts in medium is good for gut microbiota. Study on the gut bacteria strains specific requirements of inorganic salts may be needed for better understanding the roles of inorganic salts play in different gut bacteria growth environment.
Figure 2.
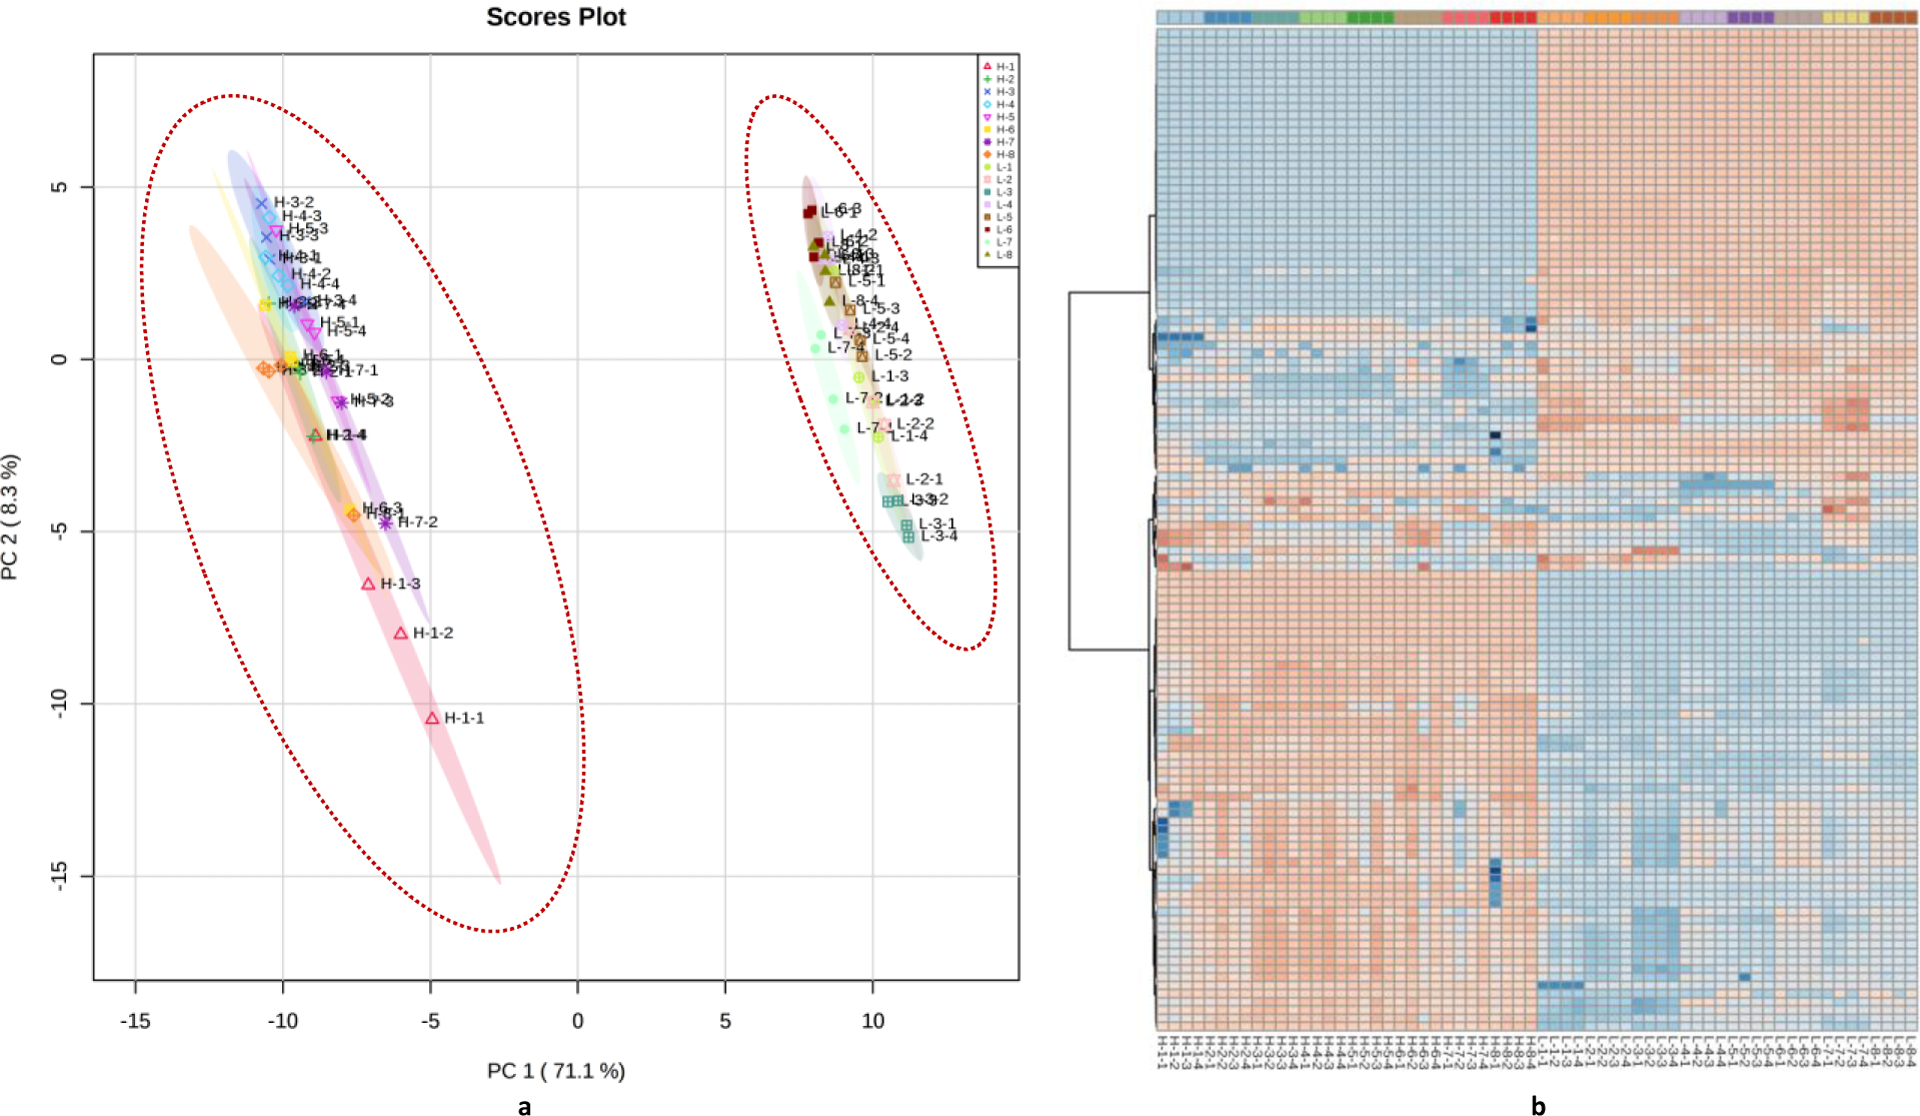
The overview of metabolic profiles of all studied samples with the various nutritional enrichments. (a) Principle component analysis (PCA) with all samples in this study, as highlighted by the two major ovals, the low vs. high inorganic salts contents executed as a major differential factor in separating the LCIS vs. HCIS samples. The shadow indicated 95% confidence region for the classification. (b) Heatmap of combined metabolic profiling. Each column represents one biological sample; each row represents one targeted metabolite. The detailed list of metabolites can be seen in Table S1 (supporting information). Color represents relative metabolite concentration in comparison of the same metabolite from different samples after data normalization
Targeted metabolic profiling differentiates the gut microbial metabolic profiles with other nutrients in a defined inorganic salts level
In order to investigate the metabolic impact of nutrient factors other than inorganic salts on the gut microbiome, we conducted a statistical analysis in constant inorganic salts content (either low or high concentration inorganic salts). As seen in Figure 3a and Figure 3b, the PCA analyses were applied separately for the two defined inorganic salts concentrations, and two major clusters were separated in each set. Sample group L-1, L-2, L-3, and L-7, which assigned with mucin in the medium were grouped together based on their metabolic profiles, while L-4, L-5, L-6 and L-8, the samples without mucin in the medium were grouped. The same pattern in terms of metabolic profile can be found in HCIS set. The metabolic profile heatmap of these two sets of the experiment can be seen in Figure S2. The results indicated a greater impact of mucin in medium than bile salts and short chain fatty acids. To analyze the detailed metabolite features of mucin assignments, we conducted a comparison between L-3 and L-4 groups, which were only different in the mucin content with a low inorganic concentration to minimize the inorganic salts effect towards metabolic profile (Figure S3a). A detailed list of metabolites that have significant differences (p-value <0.01 and fold change (FC) >2) in comparison of groups with and without mucin in the medium is shown in Table S3. As seen in Figure S3a, mucin enriched group L-3 is significantly different from no mucin group L-4, and shown in Figure S3b and S3c, 5-hydroxymethyluracil, and indole-3-acetaldehyde, which is the precursor of indole-3-acetate and can be oxidized into indole-3-acetate via tryptophan metabolism, are significantly lower in their abundance in the mucin assigned groups, which indicates a less oxidative stress environment for gut microbiome with the supplementation of mucin in the medium. Mucins contain abundant carbohydrate side chains,23 and three of the common carbohydrate residues, galactose, mannose, and N-acetylglucosamine are metabolizable by the gut microbiome.24–26 Lack of mucin in the medium may lead to carbon-starvation of gut microbiome when cultured in vitro. Our results suggested the mucin enriched environment is preferred for gut microbiome culturing.
Figure 3.

Detailed PCA score plots of metabolomics data from low vs. high concentration inorganic salts supplemented gut microbial cultures. Shadow indicates 95% confidence region for the classification. (a) Samples from low concentration inorganic salts groups. (b) Samples from high concentration inorganic salts groups.
Samples in low concentration inorganic salts medium and without mucin were analyzed separately to investigate the other two nutritional factors (i.e., bile salts and SCFAs), which included group L-4, L-5, L-6 and L-8, and the metabolic profile heatmap can be seen in Figure S4 (top 50 metabolites). All four groups were clustered in their own patterns. Meanwhile, 6/50 metabolites were significantly increased in SCFAs groups while 31/50 metabolites were decreased significantly compared to group L-4. On the other hand, bile salts caused 13/50 metabolites increased and 11/50 decreased when compared to group L-4, which contained neither bile salts nor SCFAs, and rest of the metabolites remained unchanged. It has been reported by Tramontano and her colleagues in 2018 that medium without SCFAs can be benefit for a large number of gut bacterial strains. They reported such nutrient inhibitory effects may be caused by intracellular accumulation of toxic intermediates or pH imbalance.12 In our study, the results indicated the bile salts and SCFAs component in the medium have minor impact towards the metabolome of gut microbiome when culturing in vitro compare to the major metabolic impacts generated by inorganic salts and mucin. Our results stand with Tramontano’s conclusion but interpreted in a metabolomics way. However, further investigation and detailed comparison will be needed to make a clear conclusion of how bile salts and SCFAs in medium impact the growth environment of gut microbiota.
Metabolic pathway impact analyses
Furthermore, we conducted metabolic pathway impact analyses to put individual metabolites into the context of connected metabolic pathway networks. All detected metabolites were included in the metabolic pathway analysis, so the broader coverage of extensive metabolic networks can be achieved. The pathway analyses of 112 metabolites detected in ICIS groups and 84 metabolites detected in HCIS groups were shown in Figure 4a and 4b. The major metabolic pathways of the different concentrations dependent inorganic salts impacted gut microbiome metabolic profile, where the x-axis is the metabolic pathway impact value (from pathway topology analysis, which is calculated as the sum of the importance measures of the matched metabolites normalized by the sum of the importance measures of all metabolites in each pathway), and the y-axis is the statistical significance (represented by p-value) of the impacted pathways between culture in the high or low abundant of inorganic salts. The dot size corresponds to the x-axis value and the dot color corresponds to the y-axis value. Sévin and colleagues reported that metabolites groups such as amino acid and various CoA thioesters were significantly affected by inorganic salts in culture medium.27 Our findings are in consist with Sévin’s study. Metabolic pathways such as alanine, aspartate, and glutamate metabolism, arginine and proline metabolism, biotin metabolism, citrate cycle (TCA cycle) and tryptophan metabolism, among others, were identified as significantly impacted metabolic pathways. It can be observed that in Figure 4 the biotin metabolism and tryptophan metabolism pathways from the two groups tend to have similar pathway impact factor and p-values, while the other three labeled pathways showed different responses to LCIS verse HCIS treatments. Important metabolites among these significantly impacted metabolic pathways were compared between groups. As seen in Figure 4c, aspartic acid, oxaloacetic acid, pyruvate, proline, and glutamic acid were found significantly altered when treated with LCIS compared to HCIS.
Figure 4.
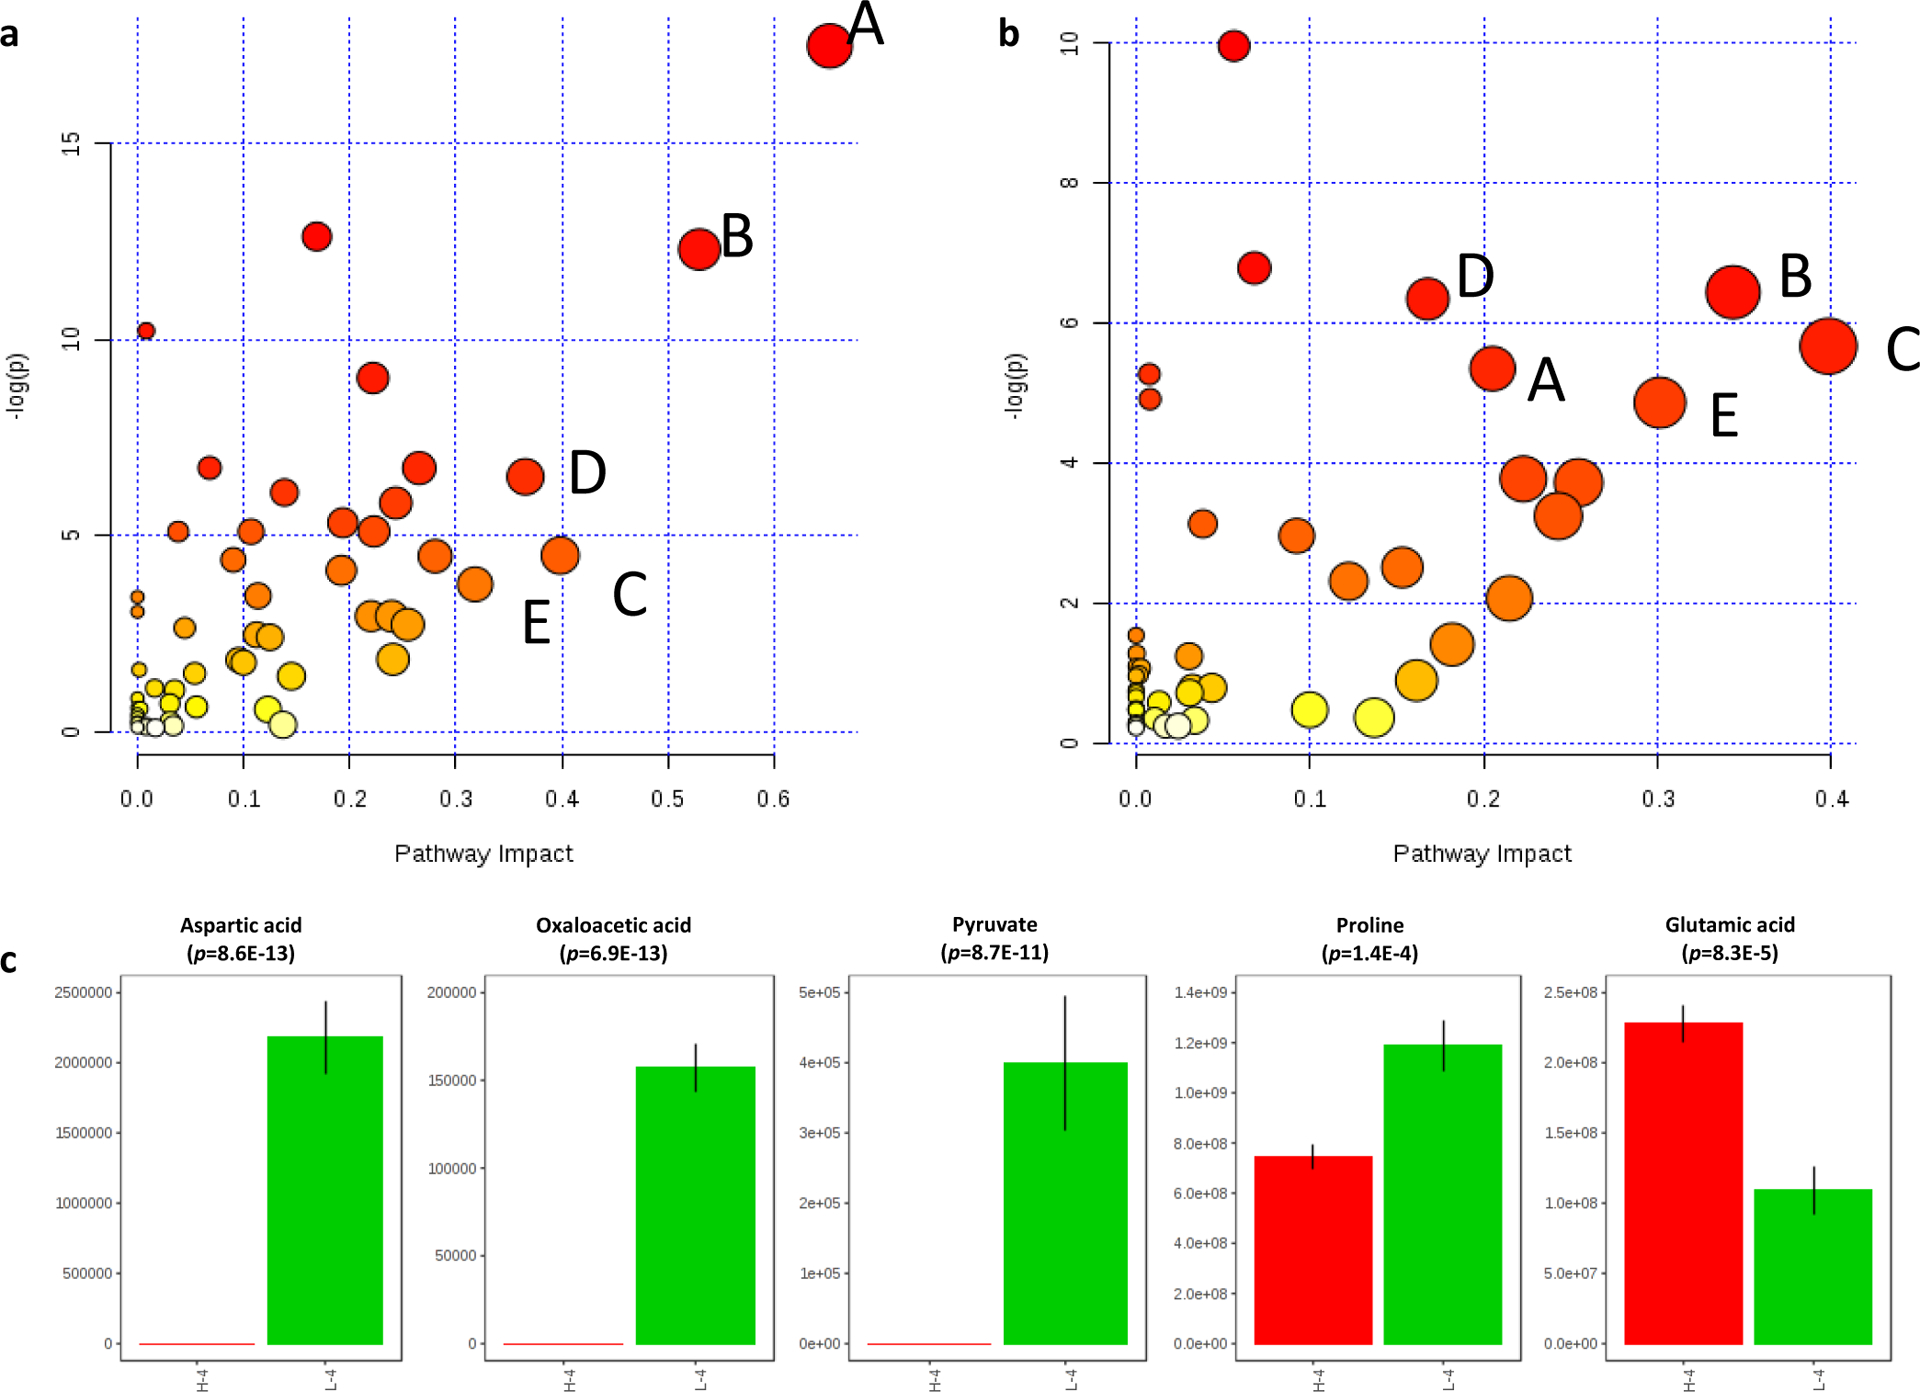
Major metabolic pathways of the two studied nutrient factors that impacted on metabolic pathways during this study (a) Low concentration inorganic salts groups. (b) High concentration inorganic salts groups. The x-axis is the metabolic pathway impact value, and the y-axis is the statistical significance (represented by p-value) of the impacted pathways between culture in the high or low abundant of inorganic salts. The dot size corresponds to the x-axis value and the dot color corresponds to the y-axis value. Metabolic pathways were labeled alphabet and detailed information as A. Alanine, aspartate, and glutamate metabolism; B. Arginine and proline metabolism; C. Biotin metabolism; D. Citrate cycle (TCA cycle) and E. Tryptophan metabolism. (c) The metabolites were selected based on pathway analysis data using the comparison between L-4 and H-4 groups.
We also conducted metabolic pathway impact analyses to investigate the pathway impact induced by mucin content in a medium because it appears as the second factor that impacts the gut microbiome significantly. All sample groups from the LCIS medium-fed bacteria were used for comparisons and pathway analysis in order to minimize the effects inorganic salts had on the metabolic profiles (L3 vs L4). The x-axis is the metabolic pathway impact value (from pathway topology analysis, which is calculated as the sum of the importance measures of the matched metabolites normalized by the sum of the importance measures of all metabolites in each pathway), and the y-axis is the statistical significance (represented by p-value) of the impacted pathways between culture with or without the mucin. The dot size corresponds to the x-axis value and the dot color corresponds to the y-axis value. As seen in Figure 5, alanine, aspartate and glutamate metabolism, arginine and proline metabolism, TCA cycle and tryptophan metabolism are still the most impacted metabolic pathways. Aspartic acid, glutamic acid, and proline are the three important metabolites among these highly impacted pathways and all of them decreased significantly in the treatment of mucin. Such phenomena may be due to biosynthesis regulation by gut bacteria, in which resources are redirected towards stress responses or use these amino acids as precursors for other processes that involve in osmoprotection.27
Figure 5.

Pathway analysis of mucin group (L-3). The x-axis is the metabolic pathway impact value (from pathway topology analysis, which is calculated as the sum of the importance measures of the matched metabolites normalized by the sum of the importance measures of all metabolites in each pathway), and the y-axis is the statistical significance (represented by p-value) of the impacted pathways between culture with or without the mucin. The dot size corresponds to the x-axis value and the dot color corresponds to the y-axis value. Metabolic pathways were labeled alphabet and detailed information as A. Alanine, aspartate, and glutamate metabolism; B. Arginine and proline metabolism; C. Biotin metabolism; D. Citrate cycle (TCA cycle) and E. Tryptophan metabolism. The metabolites on the right were selected based on pathway analysis data using the comparison between L-3 and L-4 groups.
Conclusion
In this study, we systematically investigated the effect of multiple medium components to the metabolome of human gut microbiome using a targeted metabolic profiling approach. We identified the specific shifts in metabolic profiles in response to inorganic salts, mucin, bile salts, and short chain fatty acids supplementation to GAM medium growth of human derived gut microbial population. While this is only a proof-of-concept study, we have demonstrated that inorganic salts and mucin are indeed major nutritional factors to be considered more significant than bile salts and SCFAs for future metabolic studies of the gut microbiome, and a mucin-rich environment is optimal for reducing environmental oxidative stress to in vitro gut microbiome cultures.
Supplementary Material
Figure S1. The comparison between high and low concentration of inorganic salts. (1) PCA score plot for the group comparisons between L-4 and H-4. (b) and (c) representative metabolites as biomarkers of oxidative stress.
Figure S2. Heatmap of the relative metabolite concentrations in (a) the low concentration inorganic salt groups and (b) the high concentration inorganic salt groups.
Figure S3. (a) PCA score plot demonstrates the comparison of metabolic profiles of gut microbial culture with or without the addition of mucin. (b). 5-hydroxymethyluracil, and (c) indole-3-acetaldehyde relative concentration comparison in gut microbial culture with or without mucin.
Figure S4. Heatmap demonstrates the effects of bile salts and SCFAs to the gut microbial metabolic profiles (without mucin) in low concentration inorganic salts medium.
Table S3. A detailed list of metabolites that have significant differences (p-value <0.01 and fold change (FC) >2) in comparison of culture groups with or without mucin in the medium.
Table S2. A list of metabolites that have significant differences (p-value <0.01 and fold change (FC) >2) in comparison of groups that supplemented with either LCIS or HCIS.
Table S1. A list of detected metabolites and their mass spec detection parameters.
Acknowledgments
This study was partially supported by the National Institute of General Medical Sciences of the National Institutes of Health under Award Number R35GM133510.
Footnotes
Supporting Information
The following supporting information is available free of charge at ACS website: http://pubs.acs.org
Conflict of interest
The authors claim no conflict of interest.
Reference:
- 1.Hooper LV; Littman DR; Macpherson AJ, Interactions between the microbiota and the immune system. Science 2012, 336 (6086), 1268–1273. [DOI] [PMC free article] [PubMed] [Google Scholar]
- 2.Sharon G; Sampson TR; Geschwind DH; Mazmanian SK, The central nervous system and the gut microbiome. Cell 2016, 167 (4), 915–932. [DOI] [PMC free article] [PubMed] [Google Scholar]
- 3.Zeevi D; Korem T; Zmora N; Israeli D; Rothschild D; Weinberger A; Ben-Yacov O; Lador D; Avnit-Sagi T; Lotan-Pompan M, Personalized nutrition by prediction of glycemic responses. Cell 2015, 163 (5), 1079–1094. [DOI] [PubMed] [Google Scholar]
- 4.Jia W; Li H; Zhao L; Nicholson JK, Gut microbiota: a potential new territory for drug targeting. Nature reviews Drug discovery 2008, 7 (2), 123. [DOI] [PubMed] [Google Scholar]
- 5.Li L; Zhang X; Ning Z; Mayne J; Moore JI; Butcher J; Chiang C-K; Mack D; Stintzi A; Figeys D. J. J. o. p. r., Evaluating in Vitro Culture Medium of Gut Microbiome with Orthogonal Experimental Design and a Metaproteomics Approach. 2017, 17 (1), 154–163. [DOI] [PubMed] [Google Scholar]
- 6.Bäumler AJ; Sperandio V, Interactions between the microbiota and pathogenic bacteria in the gut. Nature 2016, 535 (7610), 85. [DOI] [PMC free article] [PubMed] [Google Scholar]
- 7.Zhang X; Zhao Y; Xu J; Xue Z; Zhang M; Pang X; Zhang X; Zhao L, Modulation of gut microbiota by berberine and metformin during the treatment of high-fat diet-induced obesity in rats. Scientific reports 2015, 5, 14405. [DOI] [PMC free article] [PubMed] [Google Scholar]
- 8.Kang D-W; DiBaise JK; Ilhan ZE; Crowell MD; Rideout JR; Caporaso JG; Rittmann BE; Krajmalnik-Brown R, Gut microbial and short-chain fatty acid profiles in adults with chronic constipation before and after treatment with lubiprostone. Anaerobe 2015, 33, 33–41. [DOI] [PubMed] [Google Scholar]
- 9.Zhang X; Ning Z; Mayne J; Deeke SA; Li J; Starr AE; Chen R; Singleton R; Butcher J; Mack D. R. J. A. c., In vitro metabolic labeling of intestinal microbiota for quantitative metaproteomics. 2016, 88 (12), 6120–6125. [DOI] [PubMed] [Google Scholar]
- 10.Haiser HJ; Gootenberg DB; Chatman K; Sirasani G; Balskus EP; Turnbaugh PJ, Predicting and manipulating cardiac drug inactivation by the human gut bacterium Eggerthella lenta. Science 2013, 341 (6143), 295–298. [DOI] [PMC free article] [PubMed] [Google Scholar]
- 11.O’Mahony SM; Clarke G; Borre Y; Dinan T; Cryan J, Serotonin, tryptophan metabolism and the brain-gut-microbiome axis. Behavioural brain research 2015, 277, 32–48. [DOI] [PubMed] [Google Scholar]
- 12.Tramontano M; Andrejev S; Pruteanu M; Klünemann M; Kuhn M; Galardini M; Jouhten P; Zelezniak A; Zeller G; Bork P. J. N. m., Nutritional preferences of human gut bacteria reveal their metabolic idiosyncrasies. 2018, 3 (4), 514. [DOI] [PubMed] [Google Scholar]
- 13.Ponomarova O; Patil KR, Metabolic interactions in microbial communities: untangling the Gordian knot. Current opinion in microbiology 2015, 27, 37–44. [DOI] [PubMed] [Google Scholar]
- 14.McDonald JA; Fuentes S; Schroeter K; Heikamp-deJong I; Khursigara CM; de Vos WM; Allen-Vercoe E, Simulating distal gut mucosal and luminal communities using packed-column biofilm reactors and an in vitro chemostat model. Journal of microbiological methods 2015, 108, 36–44. [DOI] [PubMed] [Google Scholar]
- 15.McDonald JA; Schroeter K; Fuentes S; Heikamp-deJong I; Khursigara CM; de Vos WM; Allen-Vercoe E, Evaluation of microbial community reproducibility, stability and composition in a human distal gut chemostat model. Journal of microbiological methods 2013, 95 (2), 167–174. [DOI] [PubMed] [Google Scholar]
- 16.Goodman AL; Kallstrom G; Faith JJ; Reyes A; Moore A; Dantas G; Gordon J. I. J. P. o. t. N. A. o. S., Extensive personal human gut microbiota culture collections characterized and manipulated in gnotobiotic mice. 2011, 201102938. [DOI] [PMC free article] [PubMed] [Google Scholar]
- 17.Duncan SH; Hold GL; Harmsen HJ; Stewart CS; Flint HJ, Growth requirements and fermentation products of Fusobacterium prausnitzii, and a proposal to reclassify it as Faecalibacterium prausnitzii gen. nov., comb. nov. International journal of systematic and evolutionary microbiology 2002, 52 (6), 2141–2146. [DOI] [PubMed] [Google Scholar]
- 18.Yang KD, M L Zhu J, Metabolomics Study Reveals Enhanced Inhibition and Metabolic Dysregulation in Escherichia coli Induced by Lactobacillus acidophilus-Fermented Black Tea Extract. J Agric Food Chem 2018, 66 (6), 1386–1393. [DOI] [PubMed] [Google Scholar]
- 19.Rodriguez-Valera F; Ruiz-Berraquero F; Ramos-Cormenzana A, Short communication isolation of extremely halophilic bacteria able to grow in defined inorganic media with single carbon sources. Microbiology 1980, 119 (2), 535–538. [Google Scholar]
- 20.Cook AM; Daughton CG; Alexander M, Phosphonate utilization by bacteria. Journal of bacteriology 1978, 133 (1), 85–90. [DOI] [PMC free article] [PubMed] [Google Scholar]
- 21.Demple B; Harrison L. J. A. r. o. b., Repair of oxidative damage to DNA: enzymology and biology. 1994, 63 (1), 915–948. [DOI] [PubMed] [Google Scholar]
- 22.Candeias LP; Folkes LK; Porssa M; Parrick J; Wardman P. J. F. r. r., Enhancement of lipid peroxidation by indole-3-acetic acid and derivatives: substituent effects. 1995, 23 (5), 403–418. [DOI] [PubMed] [Google Scholar]
- 23.Derrien M; Vaughan EE; Plugge CM; de Vos W. M. J. I. j. o. s.; microbiology, e., Akkermansia muciniphila gen. nov., sp. nov., a human intestinal mucin-degrading bacterium. 2004, 54 (5), 1469–1476. [DOI] [PubMed] [Google Scholar]
- 24.Rampelli S; Candela M; Turroni S; Biagi E; Collino S; Franceschi C; O’Toole PW; Brigidi P, Functional metagenomic profiling of intestinal microbiome in extreme ageing. Aging (Albany NY) 2013, 5 (12), 902. [DOI] [PMC free article] [PubMed] [Google Scholar]
- 25.Ibrahim M; Anishetty S, A meta-metabolome network of carbohydrate metabolism: Interactions between gut microbiota and host. Biochemical and biophysical research communications 2012, 428 (2), 278–284. [DOI] [PubMed] [Google Scholar]
- 26.Rodríguez-Díaz J; Rubio-del-Campo A; Yebra MJ, Lactobacillus casei ferments the N-acetylglucosamine moiety of fucosyl-α−1, 3-N-acetylglucosamine and excretes l-fucose. Appl. Environ. Microbiol 2012, 78 (13), 4613–4619. [DOI] [PMC free article] [PubMed] [Google Scholar]
- 27.Sevin DC; Stählin JN; Pollak GR; Kuehne A; Sauer U, Global metabolic responses to salt stress in fifteen species. PLoS One 2016, 11 (2), e0148888. [DOI] [PMC free article] [PubMed] [Google Scholar]
Associated Data
This section collects any data citations, data availability statements, or supplementary materials included in this article.
Supplementary Materials
Figure S1. The comparison between high and low concentration of inorganic salts. (1) PCA score plot for the group comparisons between L-4 and H-4. (b) and (c) representative metabolites as biomarkers of oxidative stress.
Figure S2. Heatmap of the relative metabolite concentrations in (a) the low concentration inorganic salt groups and (b) the high concentration inorganic salt groups.
Figure S3. (a) PCA score plot demonstrates the comparison of metabolic profiles of gut microbial culture with or without the addition of mucin. (b). 5-hydroxymethyluracil, and (c) indole-3-acetaldehyde relative concentration comparison in gut microbial culture with or without mucin.
Figure S4. Heatmap demonstrates the effects of bile salts and SCFAs to the gut microbial metabolic profiles (without mucin) in low concentration inorganic salts medium.
Table S3. A detailed list of metabolites that have significant differences (p-value <0.01 and fold change (FC) >2) in comparison of culture groups with or without mucin in the medium.
Table S2. A list of metabolites that have significant differences (p-value <0.01 and fold change (FC) >2) in comparison of groups that supplemented with either LCIS or HCIS.
Table S1. A list of detected metabolites and their mass spec detection parameters.