

Abstract
After a reperfused myocardial infarction (MI), dynamic tissue changes occur (edema, inflammation, microvascular obstruction, hemorrhage, cardiomyocyte necrosis, and ultimately replacement by fibrosis). The extension and magnitude of these changes contribute to long-term prognosis after MI. Cardiac magnetic resonance (CMR) is the gold-standard technique for noninvasive myocardial tissue characterization. CMR is also the preferred methodology for the identification of potential benefits associated with new cardioprotective strategies both in experimental and clinical trials. However, there is a wide heterogeneity in CMR methodologies used in experimental and clinical trials, including time of post-MI scan, acquisition protocols, and, more importantly, selection of endpoints. There is a need for standardization of these methodologies to improve the translation into a real clinical benefit. The main objective of this scientific expert panel consensus document is to provide recommendations for CMR endpoint selection in experimental and clinical trials based on pathophysiology and its association with hard outcomes.
Keywords: area at risk, clinical trial, edema, endpoint, infarct size, magnetic resonance imaging, myocardial infarction, STEMI
Improvements in therapy for ST-segment elevation myocardial infarction (STEMI) have resulted in a significant decline in mortality rates. The extent of myocardial loss after STEMI (infarct size) is a main determinant of post-myocardial infarction (MI) mortality and morbidity, including heart failure (HF) (1). For this reason, experimental and clinical research is focused on potential therapies able to reduce MI size in conjunction with reperfusion.
In the past 2 decades, cardiac magnetic resonance (CMR) has evolved into a unique tool for noninvasive evaluation after MI. Multiple abnormalities in myocardial structure and function secondary to ischemia/reperfusion (I/R) injury can be characterized using CMR. Several established CMR-derived parameters, such as left ventricular ejection fraction (LVEF) or infarct size using late gadolinium enhancement (LGE), are commonly measured in clinical practice and aid not only in the diagnosis of MI but also in risk stratification for future cardiovascular events. Furthermore, CMR-based indexes are increasingly used as surrogate endpoints in translational and clinical trials testing cardioprotective therapies.
Although conventional CMR measurements are highly accurate and reproducible, there is an unmet need for standardization of image protocols and, more importantly, preferred endpoints. Alternative CMR techniques that allow for more objective and operator-independent tissue characterization are also rapidly evolving, and are likely to play an increasing role in clinical and research settings. These newer approaches, together with recent observations challenging accepted pathophysiological paradigms, are providing novel insights into the biological processes associated with acute myocardial I/R injury.
Against this background, a panel of individuals with vast expertise in post-MI pathophysiology and CMR characterization gathered together in a closed meeting titled Post-Myocardial Infarction Tissue Characterization by Cardiac Magnetic Resonance held at the Centro Nacional de Investigaciones Cardiovasculares (CNIC) in Madrid, Spain. The main objectives of this 2-day summit were to appraise prior and new lines of evidence of CMR-based depiction of myocardial I/R injury, to review available data on the diagnostic and prognostic value of CMR in the post-MI setting, and to provide recommendations for standardization of imaging protocols for use in clinical trials and experimental scenarios. This Expert Panel consensus document summarizes the final conclusions and recommendations agreed in this meeting. Philips sponsored the meeting (travel of experts and meals, no economic compensation to any person involved in this meeting) but did not play any role in the appointment of experts, topics or conclusions. The process of appointing the expert panel and the methodology followed for the identification of topics and for deciding statements/recommendations is presented in the Online Appendix. Although there are other relevant recent consensus documents from scientific societies dealing with methodologies and recommendations on CMR outcome measures (2–5), the present consensus is only focused on MI (I/R). The document addresses 2 main areas: 1) pathophysiology of myocardial I/R injury as revealed by CMR; and 2) proposed endpoints for use in clinical and research studies in the post-MI setting. It is important to highlight that although some pathophysiology and imaging principles apply to both STEMI and non-STEMI, this paper focuses on STEMI.
THE INFARCTED MYOCARDIUMIS NOT STATIC: EVOLVING CHANGES AFTER I/R
A section dedicated to the relevance of animal models to human pathophysiology and how these contribute to our knowledge about I/R can be found in the Online Appendix.
PROGRESSION OF NECROSIS AND ITS BORDERS.
In the late 1970s, Reimer and Jennings (6) experimentally demonstrated in dogs that necrosis ensues as a “wave front” from the subendocardium to the epicardium, following a transmural gradient of collateral flow within the hypoperfused (ischemic) area. Although some investigators initially suggested the existence of a wide lateral “border zone” of intermediate-level perfusion, later studies showed this was mostly a partial volume artifact due to the limited resolution of the techniques used, and indeed, with progressively higher levels of spatial resolution, investigators have concluded that there is no zone of intermediate perfusion (or injury) at the lateral border of the area at risk (AAR) in dogs (7,8). Despite the prevailing concept based on pathology studies that there is no lateral progression of necrosis, there are some studies suggesting the opposite in some cases (9–11). Given that most of these studies used CMR and not pathology, these data should be interpreted with caution.
At the infarct border, histological sections can show apparent isolated islands of surviving myocardium within areas of necrotic tissue, as well as isolated islands of necrosis within areas of viable tissue (12). In the absence of collaterals, the infarct borders are sharp at a cellular level but may appear to have fuzzy borders when assessed by methods with low resolution relative to cardiomyocyte size due to partial volume errors (13).
DYNAMIC CHANGES OF INFARCT SIZE AFTER I/R.
When assessing the post-I/R myocardium by CMR, the imaging features of the “infarcted myocardium” can experience important longitudinal changes. Immediately after reperfusion, the area that will become irreversibly injured increases in size due to reperfusion-related edema. This “swelling” is rapidly reduced, resulting in a decrease in the size of the irreversibly injured myocardium. In the following days, dead cardiomyocytes and debris are progressively removed from the post-I/R region, while there is an intense transit of inflammatory cells and a progressive deposition of collagen. These changes result in a further “shrinkage” of the infarcted region (Figure 1). Depending on the extent of irreversible injury and its spatial distribution (e.g., subendocardial, transmural, or patchy), these changes can be of different magnitudes. This concept is important, because the imaging biomarker “infarct size” (as % of LV) can vary greatly at different time points after MI (14–16). Studies aiming to quantify MI size should be consistent in the choice of the imaging time point to reduce variability and bias in outcome measure.
FIGURE 1. Dynamic Tissue Composition Changes Occurring After Ischemia/Reperfusion.
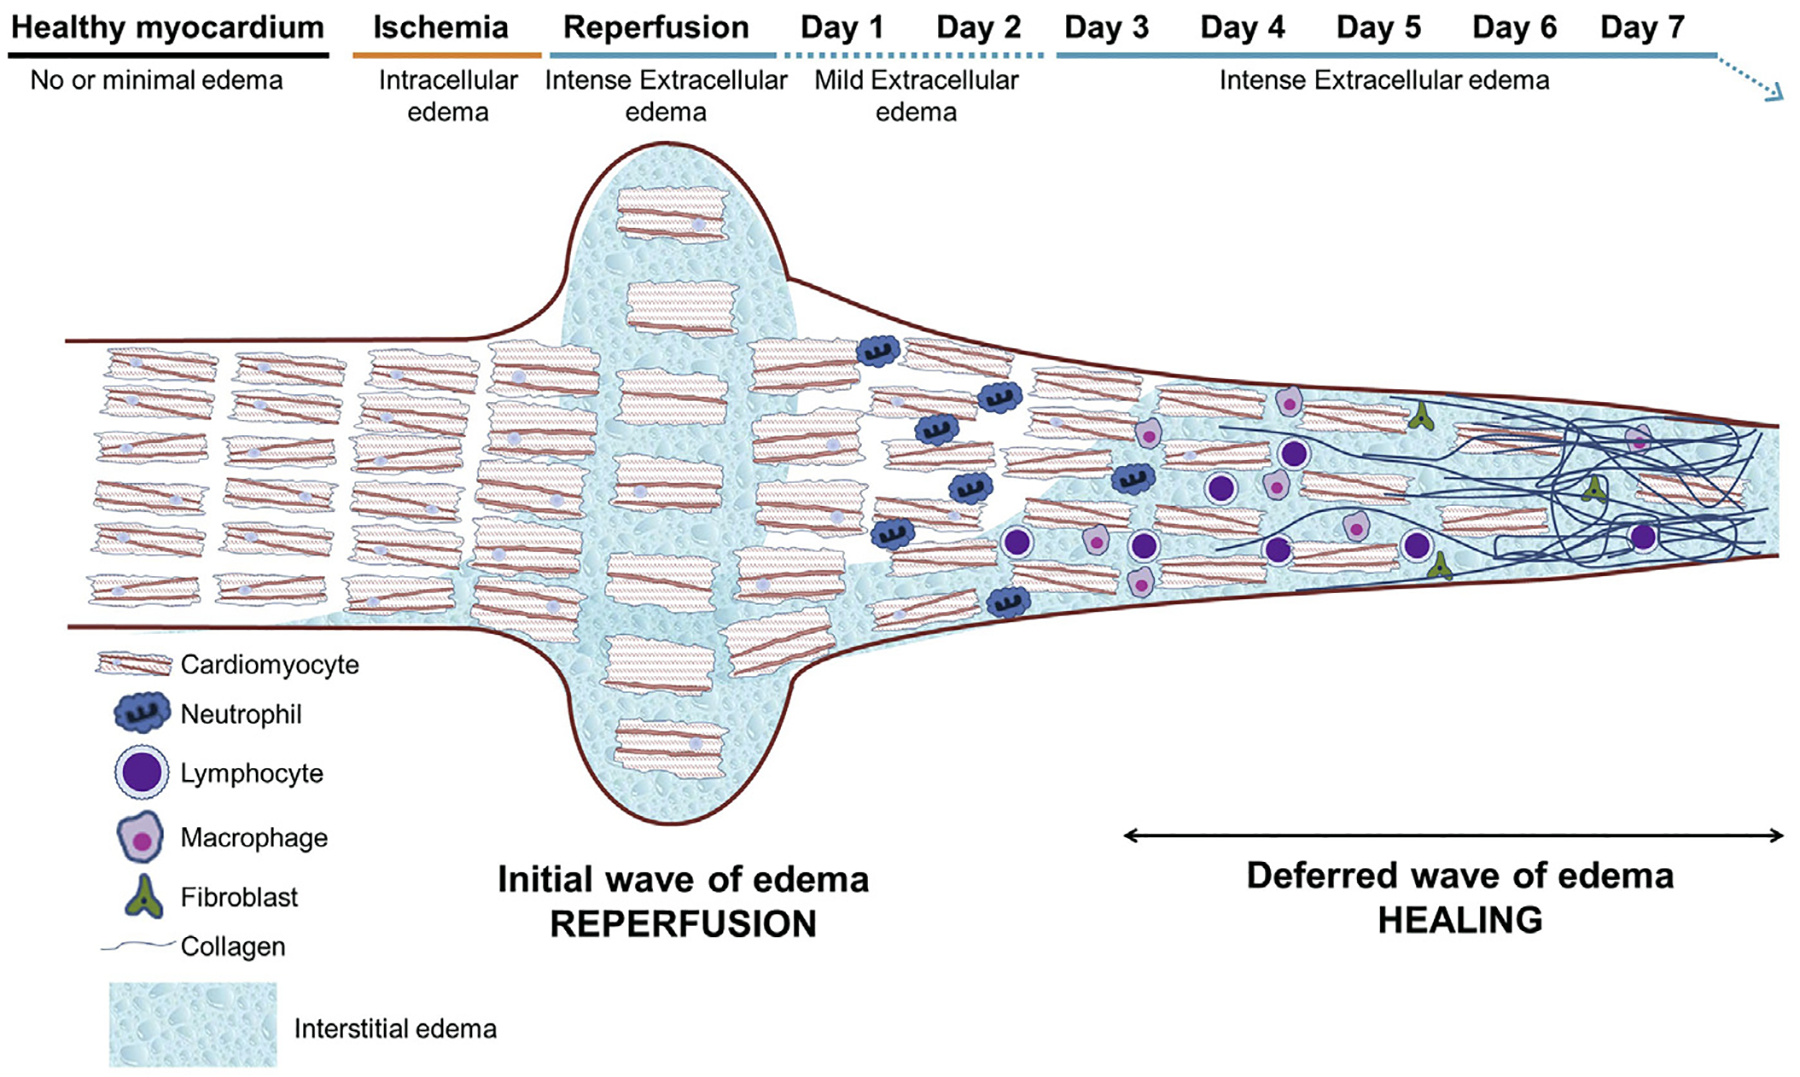
During ischemia, some degree of intracellular edema initiates. Reperfusion after prolonged ischemia results in a very rapid and intense extracellular edema formation. Cardiac fibers are separated by the extracellular edema and as a result there is a myocardial swelling (increase in myocardial thickness). The reperfusion-related edema is significantly attenuated within 24 h. Neutrophils, macrophages, and other inflammatory cells infiltrate the post-ischemic region, and a progressive replacement of cardiomyocyte debris by collagen and extracellular matrix takes place during the days following reperfusion. The replacement of cardiomyocytes by extracellular matrix results in a significant shrinkage of the myocardial thickness. The healing process results in the so called “deferred wave of edema,” which can last for days or weeks depending on remodeling processes.
PATHOPHYSIOLOGY AND SPATIAL DISTRIBUTION OF POST-I/R EDEMA.
In the healthy heart, myocardial water content is mostly intracellular, with a very small interstitial component (17). Upon MI, myocardial edema occurs initially as cardiomyocyte swelling during the early stages of ischemia (18). Edema is then abruptly exacerbated on restoration of blood flow to the ischemic region. This reperfusion-associated increase in edema is caused by increased interstitial (extracellular) edema secondary to rupture of myocytes, reactive hyperemia, and leakage from damaged capillaries (19–21). Myocardial edema observed days or weeks after reperfusion is mostly extracellular, given that energetic recovery is relatively rapid in surviving cardiomyocytes, and related to tissue healing (17).
In relation to the spatial extent of post-MI edema, classic pathology studies have demonstrated larger amounts of edema in the actual infarcted myocardium than in the “reversible” injured tissue (i.e., salvaged myocardium) (18,22). These classical studies showed that infarcted myocardium has an increase in water content of ≤90%, while salvaged myocardium only has an increase of water content of ≤9% for <24 h. As discussed in more detail in subsequent sections, the dynamics of post-MI edema is highly complex.
PATHOPHYSIOLOGY OF MICROVASCULAR INJURY: MICROVASCULAR OBSTRUCTION AND INTRAMYOCARDIAL HEMORRHAGE.
As the ischemia progresses capillary permeability increases, and upon reperfusion, the increased interstitial pressure overwhelms the intravascular pressure and can lead to microvascular obstruction (MVO) by external compression (1). When reperfusion is delayed, the endothelial walls are compromised at reperfusion by the sudden appearance of a positive pressure in the microvasculature resulting in microvascular destruction causing intramyocardial hemorrhage (IMH). Accordingly, MVO appears to precede IMH in reperfused infarctions, which implies that hemorrhagic infarctions will always show evidence of MVO. MVO has been shown to evolve over time and stabilize by 48 to 72 h (23).
Given that microvascular damage is associated with late reperfusion, it is not surprising that ischemic time is associated with larger MVO and IMH areas. In this regard, a chronic marker of microvascular injury is persistent iron deposits, which have been shown to occur in large animal models and in humans (24–26). These chronic iron deposits have been associated with significant prolonged proinflammatory burden, poor LV remodeling, and major adverse cardiovascular events. Thus, markers of severe forms of tissue injury, particularly MVO and IMH, appear to be key targets for post-infarction therapy (27). See Table 1 for consensus related to I/R concepts and animal models.
TABLE 1.
Consensus Related to Myocardial I/R Concepts and Animal Models
| Small animal models (mice, rats) are useful for specific mechanistic evaluations but do not resemble human pathophysiology. It is not recommended to translate results from these models into humans without first testing in large animals (126). |
| Pig and dog I/R models have similarities and differences with humans but are the closest to human pathophysiology and may be considered complimentary* (primates are not considered for ethical reasons) (126). |
| The post-I/R region (infarcted and salvaged) is not static and exhibits important temporal changes in size and composition (14). |
| There is greater edema formation in infarcted tissue than in salvaged myocardium (22,70). |
| After acute MI, the infarct border can be highly irregular with islands and peninsulas of necrosis but with a sharp boundary and no “intermediate zone” at a cellular level (12). “Fuzzy borders” at the edge an acute infarct can arise from partial volume effect due to limited spatial resolution of imaging (13). |
| In experimental models, edema after I/R is bimodal (70,80,127). There is an initial reperfusion-related wave of edema that significantly attenuates hours after reperfusion. A second healing-related wave of edema initiates days after reperfusion and lasts longer (15,50). |
| In humans, the dynamics of post-I/R edema is less well established. At least in some patients it might exhibit a 2-wave pattern (45,81–83). Edema appears to be more stable in the time window between days 3 and 7 post-MI (15,45,82,83,90). |
| MVO precedes IMH in reperfused infarctions (15,128) |
Controversial topic (majority but not all panelists in agreement).
IMH = intramyocardial hemorrhage; I/R = ischemia/reperfusion; MI = myocardial infarction; MVO = microvascular obstruction.
POST-MYOCARDIAL INFARCTION TISSUE CHARACTERIZATION BY CMR
The aim of this section is to provide an overview of CMR methods for imaging the processes occurring in the post-I/R myocardium. For a technical description of the methods, the reader is referred to contemporary Society for Cardiovascular Magnetic Resonance consensus documents (2–5).
CMR IMAGING OF INFARCT SIZE.
Late gadolinium enhancement.
T1-weighted (T1W) late gadolinium enhancement (LGE) has clearly been established as the best in vivo surrogate for infarct size. Gadolinium-chelates are extracellular contrast agents. Following intravenous administration of gadolinium, the contrast agent perfuses locally through myocardial capillaries and diffuses within the interstitial compartment, reaching a dynamic equilibrium allowing quantification of the extracellular volume (ECV) (28). In the early post-infarcted tissue, the rupture of cardiac cells increases the interstitial volume, which reduces the washout rate, and results in an increase in contrast concentration compared with healthy tissue; gadolinium persists within the infarct zone for a longer time than in unaffected tissue, leading to a regional hyperintense (bright) area on T1W imaging (Figure 2). At later post-MI stages, dead cardiomyocytes are replaced by extracellular matrix resulting in chronic increased ECV, also resulting in increased volume of distribution of gadolinium with similar imaging effects. Contrast-enhanced LGE typically involves breath-hold inversion-recovery imaging 10 to 20 min after intravenous administration of a gadolinium-based contrast agent. 3-Dimensional (3D) navigator-gated LGE acquisitions are now feasible expanding volumetric coverage of myocardial tissue (29). 3D single breath-hold acquisitions have the advantage of a better delineation of complex lesions, with greater signal intensity and contrast-to-noise ratio compared with 2-dimensional approaches (30). Expanded information about LGE imaging principles can be found in the Online Appendix.
FIGURE 2. Dynamics of LGE in Dense Versus Patchy Infarctions.
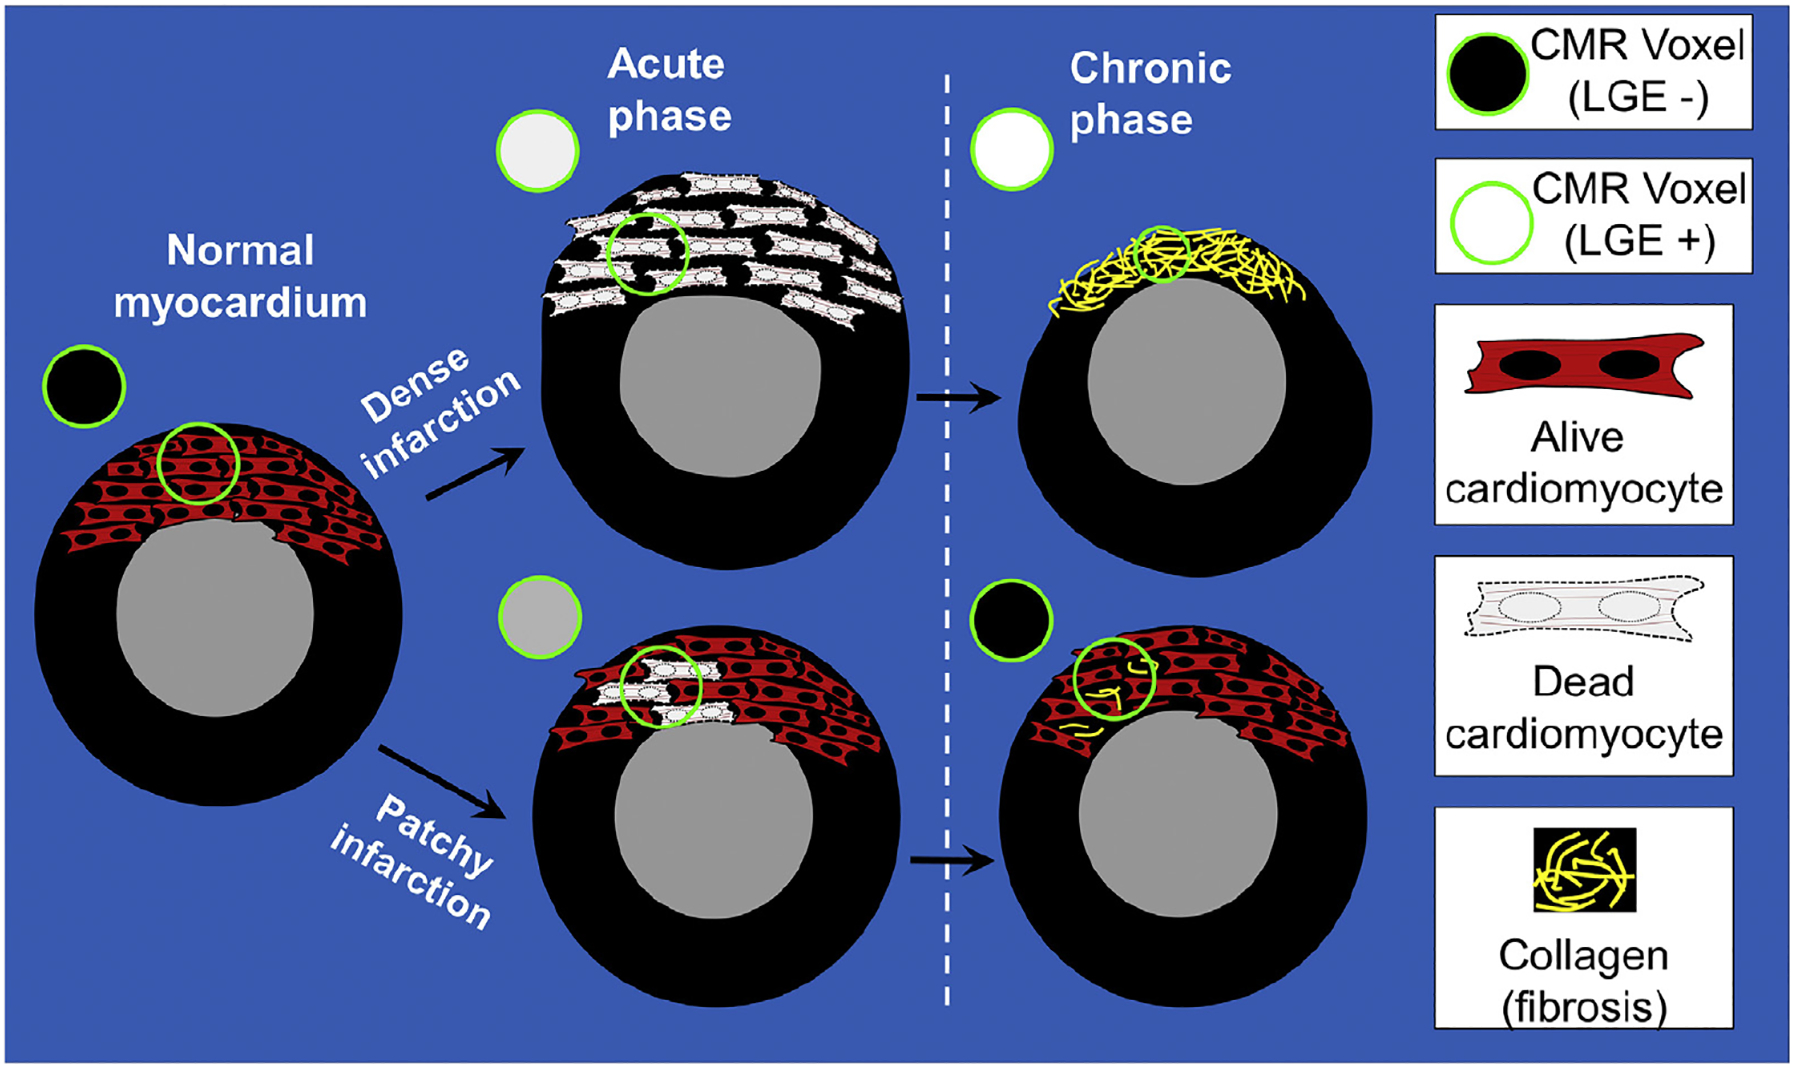
In the normal (noninfarcted) myocardium, gadolinium washes out rapidly and there is no hyperenhancement on late gadolinium enhancement (LGE) images (voxel [circle] is black). Severe I/R injury leads to the death of all myocardial cells in the region. Regardless of myocardial swelling in the acute phase or shrinkage in the chronic phase, small regions of tissue in the infarct zone lack any viable cardiomyocytes and representative voxels on LGE (circles) are “bright” both in the acute and chronic phases. Conversely, patchy necrosis (bottom) can lead to LGE in the acute phase. The hyperenhancement in the acute phase is partially due to the edema-related increase in the size of the infarcted portion, occupying a large part of the voxel. In the chronic phase, LGE can disappear. This is partially due to the shrinkage of the patchy dead myocardium, with neighbor alive cardiomyocytes occupying a large part of the voxel. CMR = cardiac magnetic resonance.
Effect of infarct size dynamics and partial volume effects on LGE interpretation.
The size of apparently “dead” myocardium may evolve over time, and this is an important consideration when interpreting LGE images (14–16). The shrinkage in LGE size between a scan performed in the early days after MI and a repeat scan performed days to weeks later may be misconstrued as evidence that LGE represents both viable and nonviable myocardium acutely, whereas LGE represents only nonviable myocardium chronically. Given the rapidly dynamic tissue changes happening acutely, the validity of a direct comparison between LGE size and histological infarct size is arguable if quantification with each method is not performed at the same time/day.
Infarct involution during healing can also interact with partial volume effects to accentuate changes that might occur in LGE size from the acute to chronic setting. Voxels containing islands or peninsulas of necrosis at the infarct border are often partially “bright” (or “grey”) on LGE imaging and may be above the arbitrary threshold used to define abnormal myocardium. But, at a later time point, shrinkage of these peninsulas or islands leads to a changed partial volume effect, and voxels at the infarct border may no longer be considered hyperenhanced since they are now below the cutoff threshold (31) (Figure 3).
FIGURE 3. Partial Volume Effect on LGE Images in the Acute and Chronic Phase.
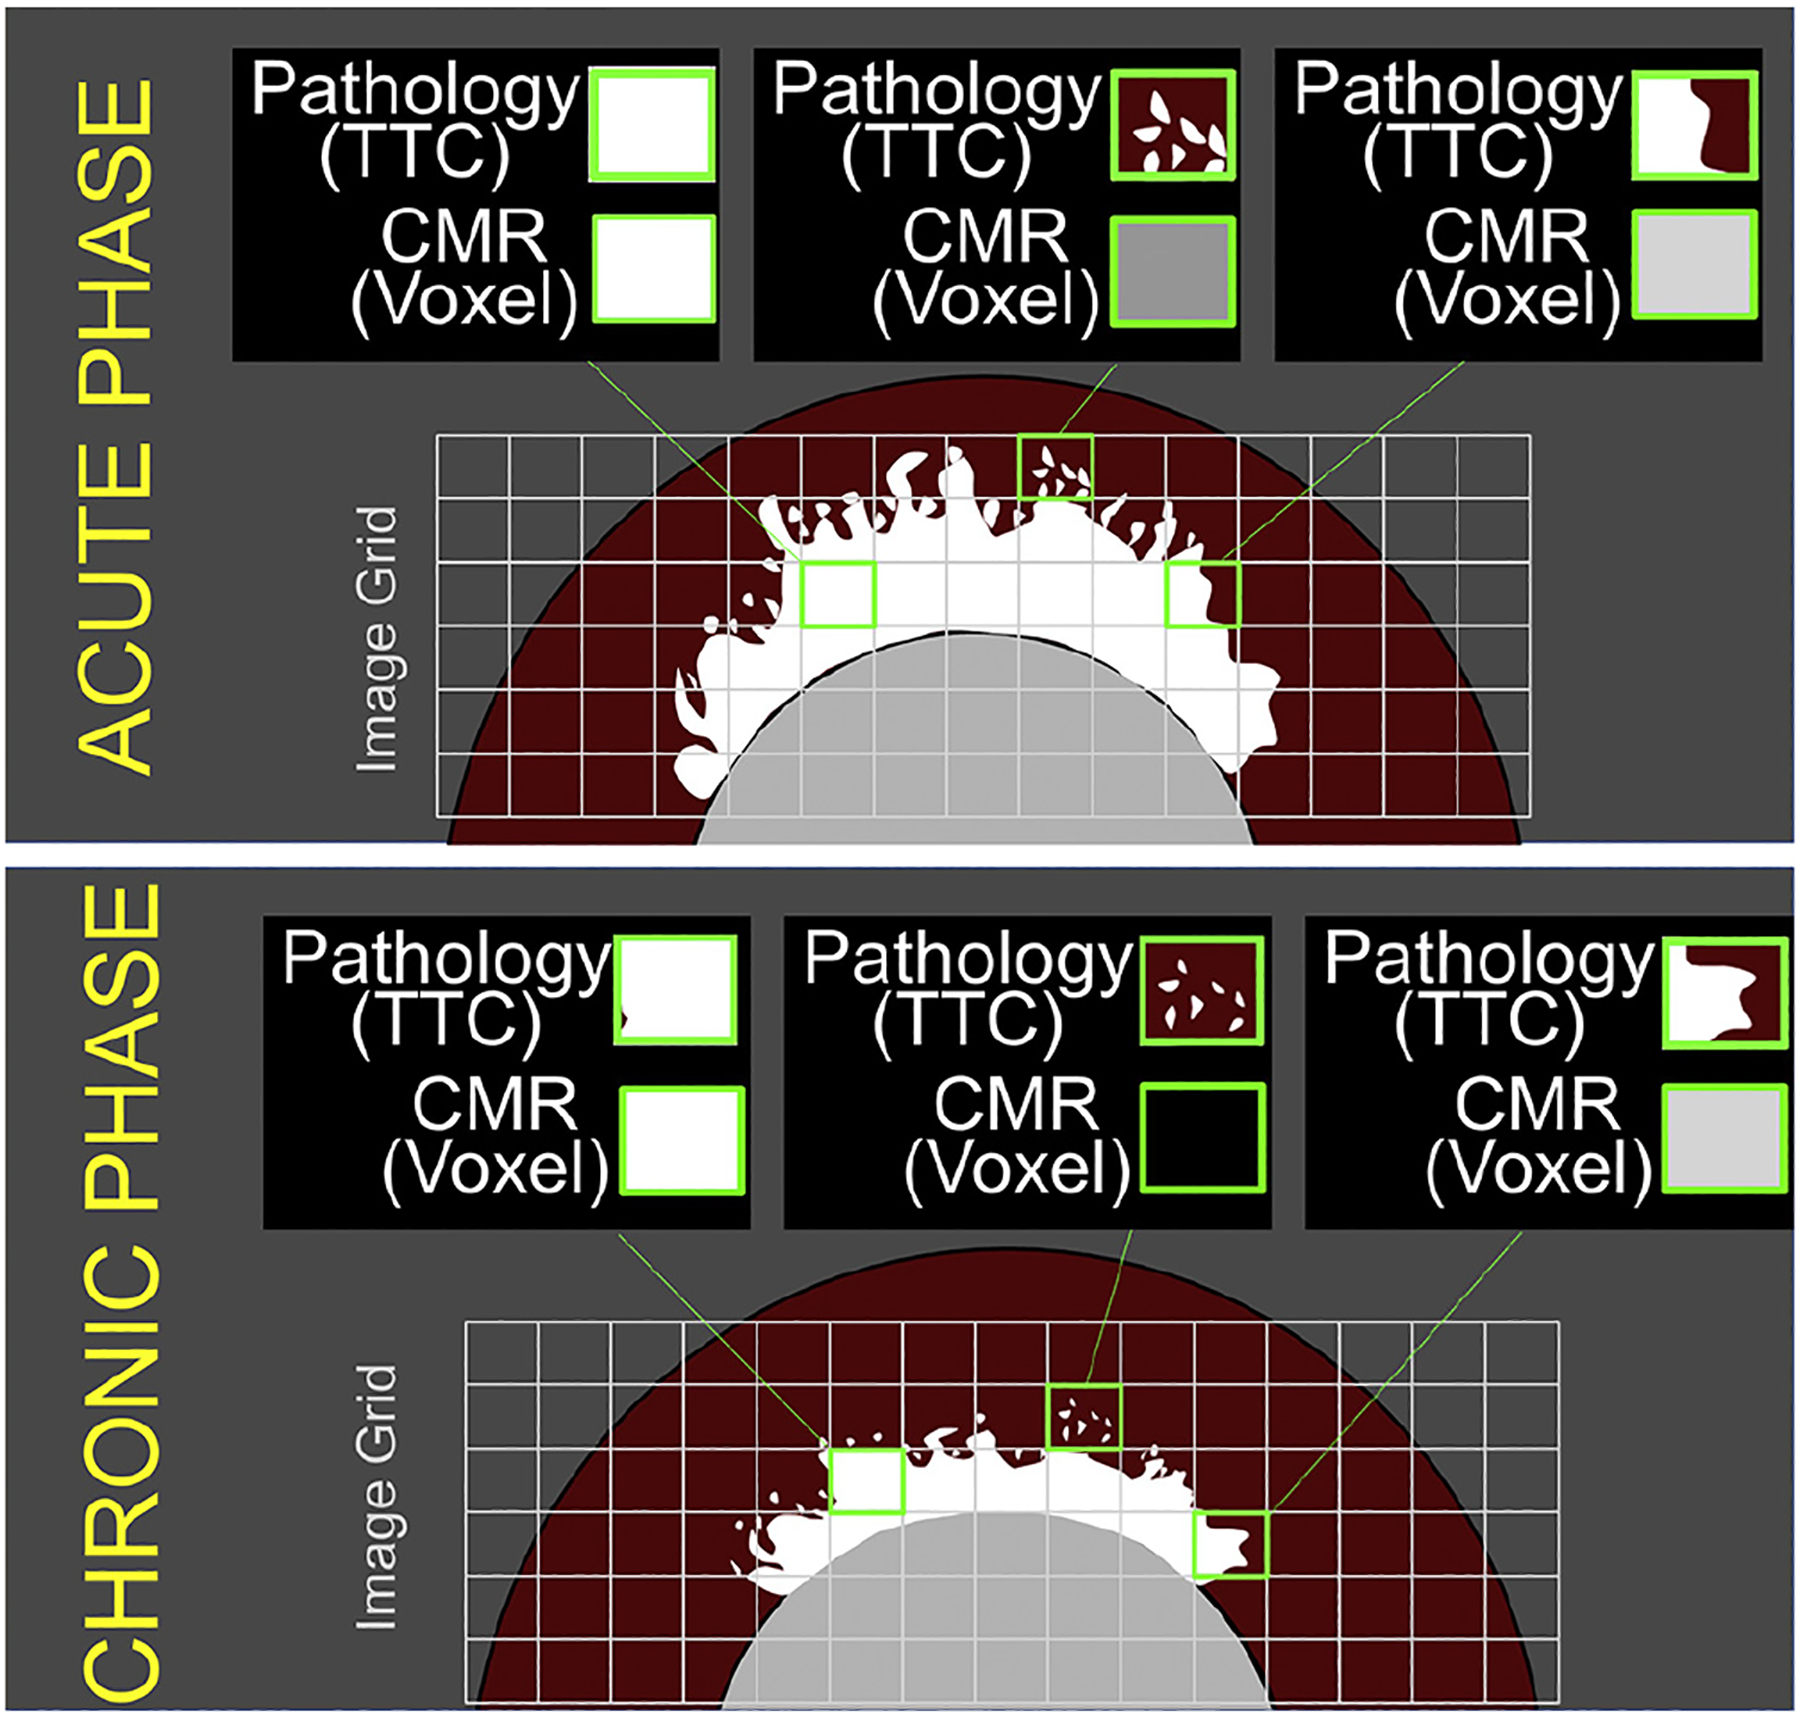
The border of the infarcted region can be highly irregular, with apparent islands and peninsulas of necrosis. This can lead to small regions of tissue that are only partially infarcted, but on the scale of a voxel on LGE imaging, are of sufficient extent to render the voxel as “bright.” In the chronic phase, infarct shrinkage will occur both in the infarct core and periphery. Islands of infarction at the border may no longer be of sufficient size to render a voxel of tissue as bright on LGE imaging. TTC = tetrazolium chloride; other abbreviations as in Figure 2.
For certain types of injuries, the combination of infarct shrinkage and partial volume effect can lead to LGE findings that are particularly prone to misinterpretation. If there is patchy necrosis, hyperenhancement in the acute setting may resolve and be absent in the chronic setting (Figure 2).
Given the dynamics of acutely infarcted myocardium, there are several implications to the design and interpretation of CMR studies evaluating infarct size. Differences in size of injured myocardium as assessed by the same or different imaging techniques on separate days should not be considered to reflect different underlying pathophysiological components without accounting for the dynamic changes in size. Similarly, size-based findings on CMR should not be compared to a pathology reference standard unless both were performed on the same day.
Pre- and post-contrast T1 mapping for assessment of acute infarct size.
ECV mapping is determined by obtaining repeated T1 maps before (native T1 map) and again after contrast media administration (3). ECV agrees well with final infarct size revealed by LGE (32). Despite the fact that native T1 and ECV mapping might overcome some of the limitations of LGE imaging, it is subjected to the same considerations regarding infarct size dynamics. In addition, the spatial resolution of ECV mapping is inherently less than that of LGE imaging.
A section dedicated to post-processing of LGE and edema images is presented in the Online Appendix.
CMR IMAGING OF EDEMA.
The identification of the myocardial edematous regions has become part of clinical and research CMR studies for different cardiac conditions (mainly myocarditis and post-MI). For several years, the extent of post-MI edema (as identified by different CMR methodologies) has been used as a surrogate for AAR and thus utilized in a multitude of experimental and clinical studies aiming at quantification of myocardial salvage. The concept of post-MI edema extension as equivalent to AAR has recently been challenged, and there are many uncertainties about its accuracy. Conversely, the degree (and extent) of post-MI edema is increasingly acknowledged as a marker of injury itself.
CMR as a tool to detect myocardial edema.
CMR offers the possibility of identifying areas of increased myocardial free water content or edema (3). The differentiation between intracellular and extracellular edema is technically challenging; however, CMR better reflects an increase in the extracellular compartment (33). As the extracellular compartment is the one showing the largest change in water content after MI, CMR closely correlates with changes in total myocardial water content (34,35). Nevertheless, there might be other factors affecting the edema-related post-MI CMR signal, such as changes in water fractions (protein-bound vs. free) (36) or the paramagnetic effect of hemoglobin denaturation in the presence of tissue hemorrhage (37). Here, a brief description of different CMR sequences for edema imaging is presented. More extensive information can be found in the Online Appendix.
T2-weighted pulse sequences.
The transverse relaxation time (T2) directly reflects tissue composition and hydration. Hyperintense zones on T2-weighted (T2W) CMR images are indicative of myocardial edema. The post-MI edema formation, as assessed both ex vivo and in vivo (34,38), has been shown to correlate with acute myocardial injury (39–45). By allowing the detection of edema post-acute ischemic injury (46), T2W-CMR might help its discrimination from chronic MI (41,47).
Dark-blood T2W-CMR methods are widely used for clinical and research purposes (42–45,48–52). More recently, bright blood T2W-CMR techniques have emerged as potential alternatives to dark blood T2W-CMR (53–55).
T2 mapping.
Parametric T2-mapping techniques provide voxel-based tissue characterization on a continuous quantitative scale. By displaying T2 values in milliseconds on a fixed scale, subjective signal intensity-based ascertainment is avoided. T2 mapping has been validated against pathology for myocardial water content quantification in experimental MI models (35,56). A comparative study using repeatedly 4 different edema sequences showed higher intraobserver and interobserver agreement and greater test-retest reproducibility in the quantification of edema using T2 mapping (57).
T1 mapping.
When the proton is contained in a large molecule, such as fat, energy transfer is very efficient, resulting in short T1. On the contrary, for small molecules, such as water, this effect is less efficient, resulting in longer T1. Myocardial injury due to MI or inflammation increases water content, lengthening local T1 relaxation times (3). The extent of edema delineated by T1 maps agrees well with other measures (58–60).
Retrospective AAR size estimation by CMR: an evolving controversy.
The “AAR” concept.
The acutely ischemic myocardium downstream of an occluded coronary artery defines the myocardium at risk of death, the so-called AAR. The portion of the AAR that survives, if any, represents myocardium that has been salvaged (eventually by a given intervention).
Although infarct size provides an approximate (inverse) estimate of myocardial salvage, the extent of the AAR is highly variable and dependent on the infarct-related artery, coronary distribution, and location of the culprit lesion. Thus, a better measure of therapeutic efficacy would be the proportion of the AAR that is infarcted rather than absolute infarct size. The rationale is that for 2 equally sized infarcts, the one representing a larger proportion of the AAR corresponds to a greater amount of salvaged tissue (61) (Figure 4). Thus, the quantification of infarct size relative to AAR theoretically overcomes the limitation of interindividual AAR extent variability and, thus, might allow an accurate estimation of the effectiveness of protective therapies while reducing the necessary sample size. This methodology, despite being conceptually correct, is dependent on the accuracy of the technique(s) used for AAR and infarct size quantifications.
FIGURE 4. Absolute Infarct Size (% LV) Versus Relative IS (% AAR).
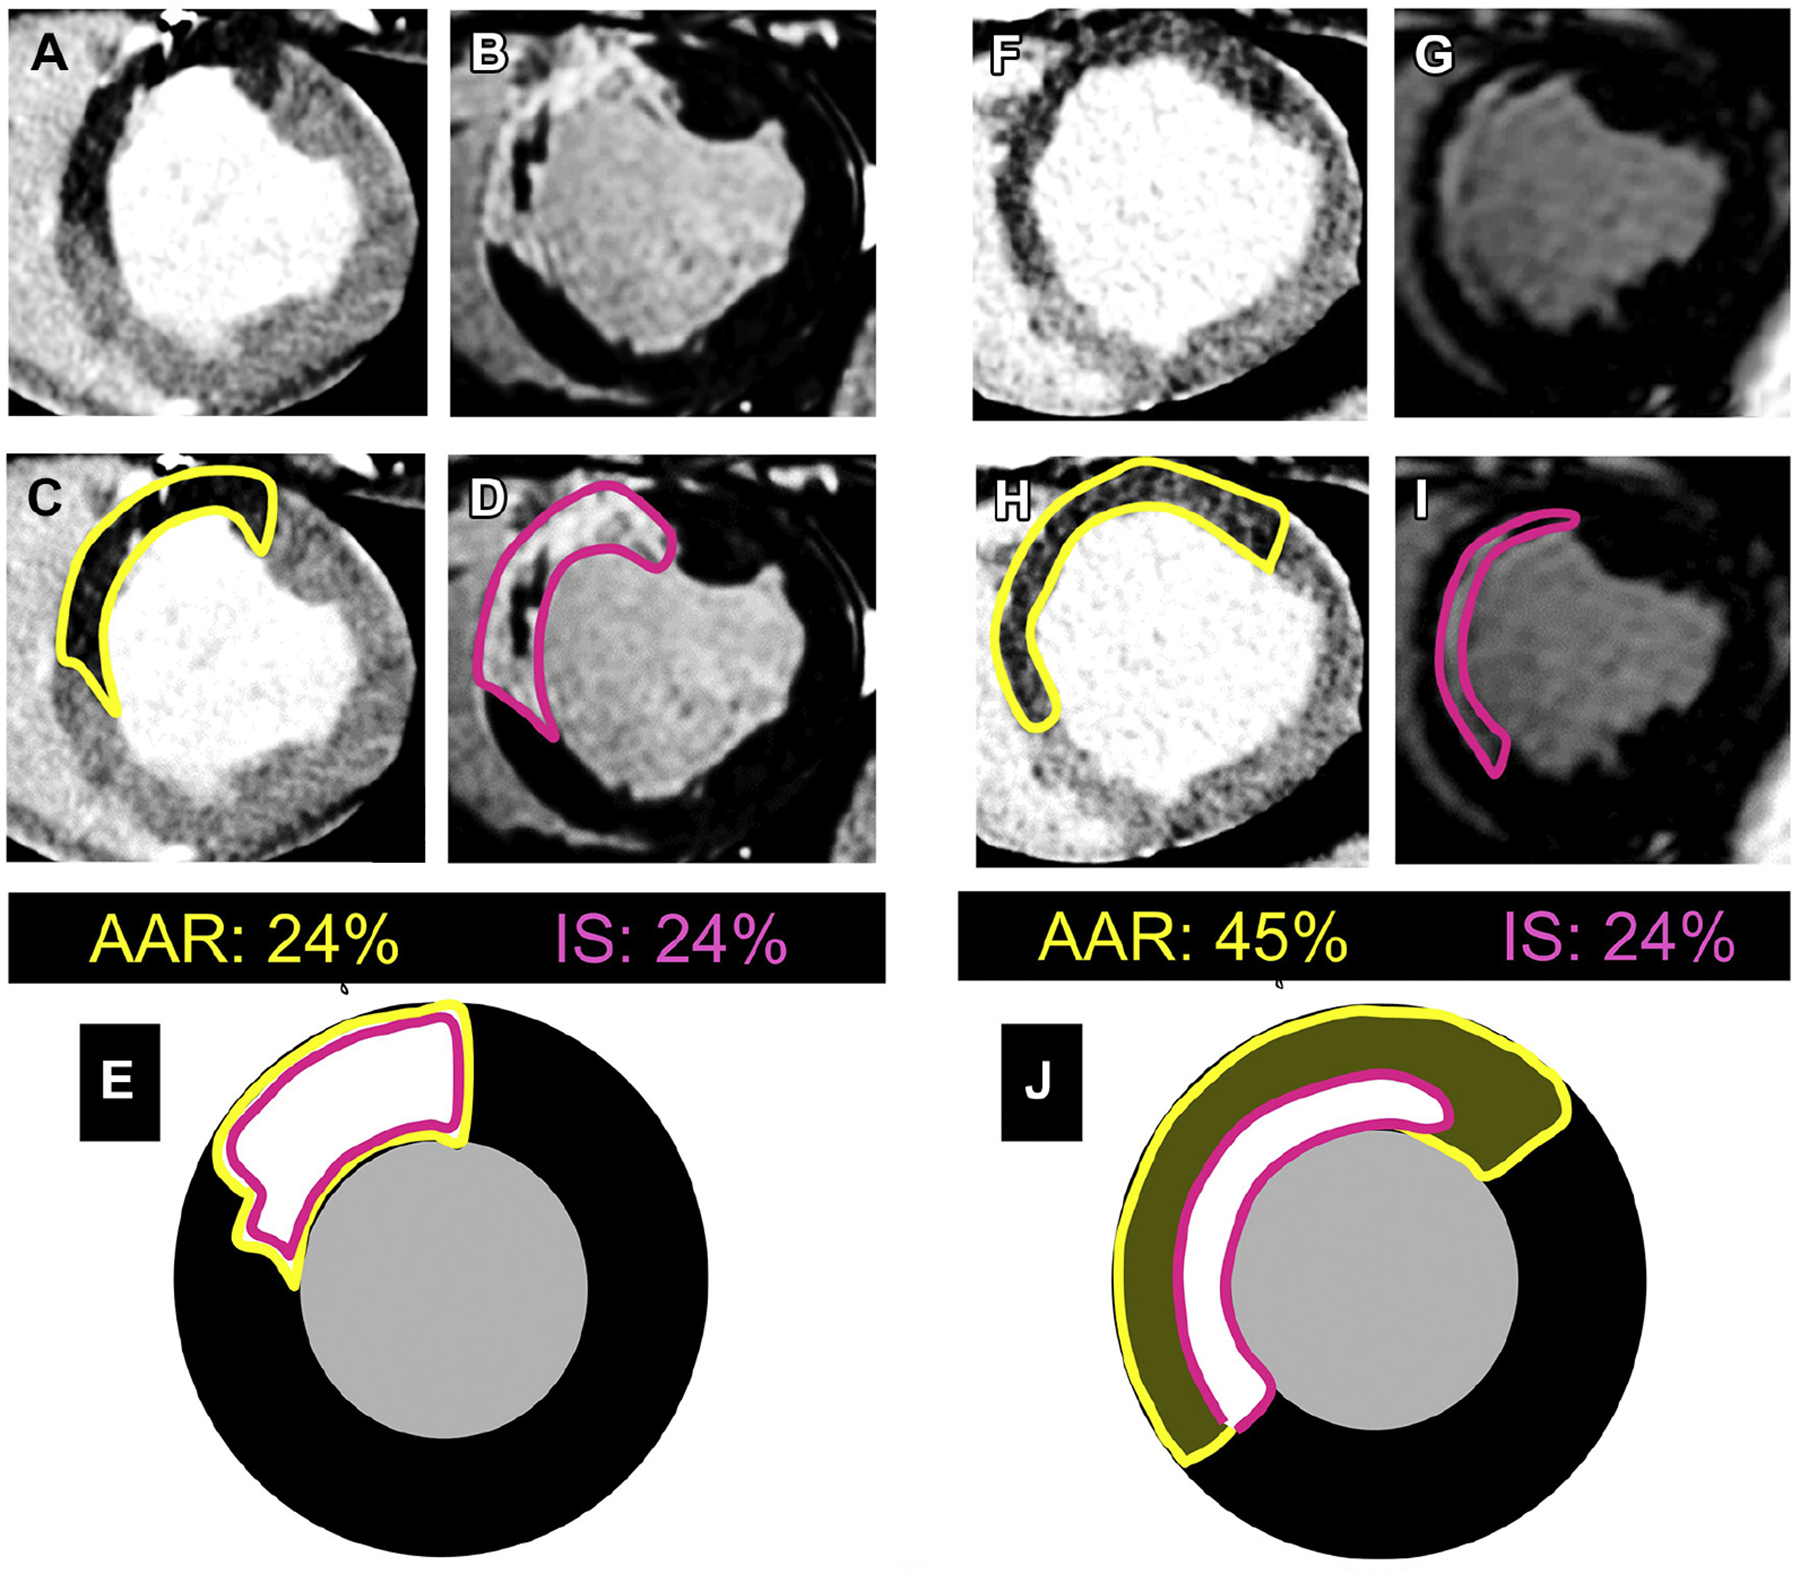
Two subjects with the same absolute infarct size may have different amounts of salvage. The illustrated cases correspond to experimental ischemia/reperfusion (I/R) (pig model). (A and F) Arterial enhanced multidetector computed tomography (MDCT) perfusion scans during index coronary occlusion to delineate true area at risk (AAR) (dark areas not perfused). (C and H) The same as A and F, but with the AAR traced. (B and G) LGE CMR 1 week after I/R (in D and I, the infarct size [IS] has been traced). (E and J) Representation of AAR and IS overlaid (yellow corresponds to AAR and pink to IS). In the left case, the entire AAR is transmurally infarcted with no salvage at all. In the case to the right, AAR is much larger, but infarction occupies only the subendocardial area, suggesting large amount of salvaged myocardium. The case to the right corresponds to a subject undergoing a given cardioprotective strategy (IPC in this case). Abbreviations as in Figure 2.
Dynamic changes in the AAR of the Acutely Infarcted Myocardium.
The post-I/R region (the AAR) is usually composed of separate myocardial compartments that are biologically diverse. For instance, in the setting of a subendocardial infarction, the necrotic tissue in the subendocardial zone of the AAR has a different biological milieu than the viable tissue in the subepicardial zone. Besides a large difference in electrolytes, metabolites, inflammatory cells, and many other biochemical and biophysical properties, the underlying structure by light and electron microscopy are wholly dissimilar (18,19,22,62,63). This raises reservations regarding the use of such characteristics to provide an accurate depiction of the AAR (61).
Another important concept to take into consideration in this regard is that the tissue composition of the post-IR region (the AAR) is dynamic in composition. Within the infarcted component, there is a clear time course of histopathological changes as necrotic myocardium heals into collagenous scar (50). Many features, such as acute inflammation, may not be stable even within the first week. This has consequences for imaging the AAR if the imaging method is dependent on a highly dynamic attribute of MI.
Edema-based CMR methodologies for retrospective AAR size estimate.
Landmark experimental studies suggested the possibility of ex vivo (64) and in vivo (38) retrospective (i.e., after I/R) AAR quantification by noncontrast T2W-CMR (edema). The first clinical study on this topic showed that after MI, areas of increased T2 signal extended beyond that of areas of LGE (39), showing that T2W-CMR of myocardial edema could detect reversibly injured myocardium in STEMI patients. After these pioneer works, several experimental and clinical studies have studied the relationship between the extent of edema-CMR abnormalities (T2W, T2 mapping, T1 mapping) and different AAR standards showing positive associations (59,60,65–72). There were also initial experimental studies concluding against the validity of edema CMR imaging for retrospective AAR quantification (20,44).
One limitation to most of these studies is that CMR imaging was performed at a single time point after reperfusion under the assumption that edema was stable for several days. The second assumption of these studies was that edema was not affected by cardioprotective strategies and/or experimental conditions (e.g., duration of ischemia). Recent experimental and clinical evidences have challenged both assumptions, and thus, there is uncertainty regarding the concept that edema equates AAR across different experimental/clinical scenarios.
Contrast-based CMR methodologies have also been proposed for retrospective AAR quantification: early gadolinium enhancement (73), ECV imaging (70), and contrast-enhanced steady-state free precession (10,74–76) (Online Appendix). The mechanistic explanation for the possible retrospective AAR estimation by these contrast-based methods is not clear. The advantage of contrast enhanced steady-state free precession is that it does not require any additional sequence.
CMR methods for retrospective AAR quantification not relying on edema have been proposed: the endocardial extent of infarction on LGE images (termed infarct-endocardial surface length) is based on the wave front progression of necrosis. The relationship between this method and different standards have been tested with positive results (77,78). However, other studies are questioning its accuracy in STEMI patients with minimal or no LGE (11,67,68).
Dynamics of post-MI edema: the classic concept of “stable” myocardial edematous reaction revisited.
Post-MI edema was initially believed to be stable during the days following an acute MI (14,66). Recent studies have provided new insights. In the experimental setting, it has been demonstrated that the edematous reaction during the first week after MI is not stable, and follows a bimodal pattern (79,80). The 2 waves of edema are secondary to different pathophysiological phenomena (Figure 1), and are amenable to being modified by interventions (15,21,50).
In a longitudinal clinical study of 16 STEMI patients, including CMR within the hyperacute post-reperfusion period (i.e., 2 h after reperfusion), the post-MI bimodal edema pattern was observed in a significant proportion of patients (45). Infarcted (either with or without IMH) and, to a lesser extent, “reversibly” injured myocardium displayed a similar 2-wave time course (45), as shown in the experimental setting (15,70). In another longitudinal study of 30 STEMI patients, edema was shown to be stable across different time points ≤10 days in all patients except those with IMH (81). Given the dynamic changes in the post-MI myocardium early after reperfusion, the discrepancies between these studies might be explained by the different post-reperfusion timings of the CMR scans between studies. More recently, a third clinical study showed that intensity of post-STEMI edema according to T1 mapping relaxation times was bimodal, while the extent of T1 abnormalities was not (82). Dynamic tissue water changes (T2 values) were also suggested in a recent longitudinal clinical study (83), but not in other retrospective studies (76,84,85).
In summary, there is robust evidence for the bimodal edema pattern at the experimental level. In patients, some (not all) studies have also demonstrated a bimodal edema reaction within the first week of MI.
Effect of protective therapies on edema: implications for edema-based AAR quantification.
Thuny et al. (86) were the first group to study the effect of a cardioprotective strategy (post-conditioning) on the extension of edema, evaluated by T2W abnormalities. A total of 50 STEMI patients were randomized to the cardioprotective maneuver post-conditioning or control. The extent of edema (T2W) was significantly smaller in the post-conditioning group. In other studies where post-conditioning was not associated with protection, the effect of this maneuver on edema was not observed (15,87). In a subsequent clinical study, White et al. (88) evaluated the effect of remote ischemic conditioning (RIC) on infarct size (LGE extension) and edema development (T2 mapping) in 83 STEMI patients. The extent of edema on T2 mapping was significantly smaller in the group undergoing RIC. In addition, mean T2 relaxation times in the ischemic area were significantly shorter in the group of patients undergoing RIC compared with control.
In the pig model of I/R, Fernandez-Jimenez et al.(15) evaluated the effect of the cardioprotective maneuver local ischemic preconditioning (IPC) on edema formation. The extension of edema was significantly smaller in pigs undergoing IPC than in controls. T2 relaxation times at the ischemic area were significantly shorter in IPC pigs (15). Some degree of edema is still present days after MI in the absence of LGE (15), suggesting that edema might be a marker of injury. In a different study undertaken in a mouse model, Dongworth et al. (65) investigated the effect of IPC on edema development assessed by T2 mapping and found that IPC reduced the extent of edema (T2 mapping).
In agreement with these experimental data, very recently Bulluck et al. (89) reported a meta-analysis of randomized clinical trials testing the infarct-limiting effect of different interventions using CMR within the first week after STEMI. A total of 5 trials reported that the active intervention resulted in smaller infarctions, and in these, the extension of edema (T2W abnormalities) was also significantly reduced. Conversely, in trials where the active intervention was not associated with smaller infarctions than controls, the extension of edema was not different either (89).
Overall, there is compelling experimental and clinical data showing that cardioprotective therapies potent enough to reduce irreversible injury (i.e., infarct size), also limit the size and degree of edema. Duration of ischemia also affects edema formation following acute MI. Edema development, therefore, should be seen as a manifestation of myocardial I/R injury and not a simple marker of AAR.
The assumption that the extent of edema after myocardial infarction accurately represents AAR in all experimental/clinical scenarios is under intense debate, and thus, edema-based methodologies for AAR assessment in testing novel cardioprotective therapies cannot be recommended. The panel wants to make clear that this conclusion and recommendation does not mean that seminal studies showing correlations between CMR-based edema extension and standard-based AAR were not correct. These studies were performed with only 1 experimental condition (fixed ischemia duration without testing cardioprotective strategies), and at 1 single time point after I/R. This recommendation should not be interpreted as the last nail in the coffin of the field of using edema as surrogate for AAR. Further ad hoc research must be undertaken to better understand the interplay between injury and edema formation/dynamics.
Salvage index concept and its quantification.
The most commonly used and robust CMR measurement for assessing the efficacy of novel cardioprotective therapies in STEMI patients is an absolute reduction in infarct size. However, given the variability in the size of the AAR, the number of individuals required in clinical cardioprotection studies to demonstrate a reduction in absolute MI size can be quite high (approximately 200 to 300 STEMI patients in total depending on the patient population and effect size)(90). Normalization of infarct size by the AAR theoretically reduces variability of outcome measure and thus considerably reduces sample size. Thus, myocardial salvage index (MSI) is defined as the proportion of the AAR that remains viable after MI.
In the experimental setting, the gold-standard method for delineating the AAR in animal models of I/R is to quantify the perfusion defect following injection of either fluorescent microspheres or dyes (such as Evans blue). Alternatively, an arterial enhanced multidetector computed tomography (MDCT) performed during the index coronary occlusion is a valid technique to delineate the theoretical AAR in vivo (15,20,72). In the clinical setting, the gold-standard method for quantifying the perfusion defect in STEMI patients is by cardiac single-photon emission computed tomography imaging of the perfusion defect within hours after reperfusion following the peripheral injection of a radioisotope (e.g., technetium) prior to opening of the infarct-related artery (66).
In the experimental setting, MSI can be quantified pathologically (tetrazolium chloride and microspheres/blue dyes for infarct and AAR quantifications, respectively), but this is not possible in the clinical setting. To overcome these limitations, CMR has been used to quantify both infarct size (LGE) and AAR in a single imaging session. Based on the assumption that T2-based CMR sequences were identifying the AAR and that LGE is a valid surrogate for infarct size, CMR-based MSI has become a popular outcome measure in experimental and clinical trials. The use of CMR-based MSI as the primary endpoint in trials has been proposed as a methodology to allow a reduction in sample size by one-half (91). Studies have proposed that CMR-MSI calculated by a single CMR in the first week following STEMI can predict long-term clinical outcomes (90), suggesting that it is a viable surrogate endpoint for assessing cardioprotection. Based on the recent evidences highlighting that edema is not stable after MI, and that cardioprotective interventions may affect the development of edema, edema-based MSI should not be used as an endpoint in experimental or clinical trials. Similarly, endocardial surface length LGE methodologies for AAR assessment in testing novel cardioprotective therapies should be used with caution, since they are not reliable in cases of very limited LGE, and are not recommended as a primary or secondary outcome measure.
CMR IMAGING OF MICROVASCULAR INJURY: MVO AND INTRAMYOCARDIAL HEMORRHAGE.
Microvascular obstruction.
In experimental studies, the intra-coronary administration of dye (Thioflavin-S) may result in an excellent delineation of MVO in the excised heart (92), but this is not feasible in the clinical setting. On CMR, MVO is revealed as a hypointense core within the hyperintense infarct zone within the area of LGE (93–95). The imaging feature is explained by failure of the contrast agent to penetrate within the infarct core.
Native T1 mapping may allow the detection of areas with short T1 values surrounded by prolonged T1 values in the infarcted regions. Although initially thought to be reflective of MVO, recent evidence has led to a definition of a new biomarker of “infarct core” (96). The mechanisms underpinning the shortening of T1 values are not fully understood.
Intramyocardial hemorrhage.
Deoxyhemoglobin has paramagnetic effects that enable myocardial iron accumulation to be detected using T2W and T2*W CMR (97,98). IMH is visually defined as a hypointense area in the center of a hyperintense zone in edema sequences. Nevertheless, T2*-based imaging is the most sensitive method for imaging hemorrhage as it specifically images IMH based on reduced T2* relaxation times. Despite this, given that spatial resolution is relatively low; it is also sensitive to off-resonance artifacts, particularly in the lateral wall; and it is influenced by motion and blood flow, T2* CMR image quality can be suboptimal. Two different cut-offs are used to identify zones of hemorrhage (mean-2SD and T2* <20 ms). Whether both of the cut-offs yield the same or different hemorrhage volume and whether this depends on the imaging field strength remains to be investigated. An alternative to T2* imaging that has been extensively investigated is T2 imaging, as T2 images can be sensitized to hemorrhage. Although T2 images often provide far better image quality than T2* images, their sensitivity in the acute phase to hemorrhage is compromised by the presence of edema in the acute phase. Because T1 is sensitive to the degradation products of hemorrhage, some studies have also investigated the capacity to image hemorrhage with T1 CMR. These studies have shown that the opposite effects hemorrhage and edema impose of T1, the sensitivity for detecting hemorrhage based on T1 after MI is often compromised (99). See Table 2 for consensus related to CMR methodologies for tissue characterization.
TABLE 2.
Consensus Related to CMR Methodologies for Myocardial Tissue Characterization
| Conceptually, the AAR is the myocardium downstream to an occluded coronary artery that becomes ischemic (1). |
| Infarct size and AAR should be ideally measured at the same time point. If measured at different time points, salvage quantification might show implausible results (e.g., negative values) (14–16,90). |
| LGE grey zones should not be interpreted as dead, since they likely represent a mixture of bright (dead) and dark (alive) myocardium. Grey myocardium can be due to partial volume effect (15,31). |
| Edema development should be interpreted as a manifestation of myocardial I/R injury and should not be considered as a reliable marker of AAR* (15,44,89). |
| T1W is the recommended methodology for LGE imaging after MI (2,4). |
| T2-mapping is the recommended methodology for edema imaging after MI (3,35). |
| T1W LGE is the recommended methodology for MVO imaging (hypointense areas within the LGE area) (95). |
| T2* mapping is the recommended methodology for IMH imaging after MI (3). |
Controversial topic (majority but not all panelists in agreement).
AAR = area at risk; LGE = late gadolinium enhancement; other abbreviations as in Table 1.
CMR ENDPOINTS IN CLINICAL TRIALS AND EXPERIMENTAL STUDIES
Large animal experimentation is necessary before embarking in clinical trials testing new cardioprotective strategies. Given that all imaging methodologies used in patients can be used in large animal studies, to improve transferability of experimental results, CMR endpoints in the latter should be the same as in clinics. For this reason, all statements and conclusions in this section apply both to clinical trials and large animal experimental studies. Additional information about experimental study recommendations is provided in the Online Appendix.
Besides the tissue characterization abilities, the high reproducibility of CMR makes it the best imaging modality for MI clinical trials. Interscan reproducibility for the quantification of LV volumes, LV mass, and LVEF are superior to that of echocardiography, enabling 55% to 93% reductions in sample size to detect changes in these variables with comparable power (100). Similarly, LGE is highly reproducible in both the acute and chronic MI setting (mean bias <1% of LV mass) (101), which allows reductions of approximately 42% of sample size in comparison with single-photon emission computed tomography (102).
To incorporate new interventions into clinical practice, it must be demonstrated that these improve clinical outcomes, particularly “hard” events, such as death or relevant morbidity (HF, use of resources, and so on). However, such trials typically require very large sample sizes and/or follow-up, particularly in the current era of continuously improving post-MI prognosis, and frequently result in prohibitive costs and/or logistic hurdles. Therefore, surrogate endpoints with proven links to hard outcomes are often used as an alternative in early (pilot) clinical trials. A number of CMR-based endpoints derived from dynamic (“functional”) or stationary (“morphologic”) imaging have been proposed as valid surrogates. Although most studies have examined the prognostic value of individual CMR measures, some have combined several into scores (103,104).
In 2014, El Aidi et al. (105) performed a systematic review of 27 studies evaluating the ability of CMR to predict outcomes when performed within 2 weeks of reperfused MI. According to an arbitrary definition, no single CMR measure demonstrated independent prognostic value for the prediction of hard endpoints (death, MI, or transplantation) with the exception of LVEF, which was the only endpoint independently associated with major adverse events. Consistent prognostic value, although insufficient to qualify as “independent,” was additionally noted for LGE size and MVO.
Reduction of MI size is the ultimate goal of cardioprotection in the acute phase. A subsequent pooled analysis of 10 randomized clinical trials evaluated the prognostic significance of imaging-based MI size measured at a median of 4 days post-reperfusion (106). This study demonstrated clear progressive rises in death or HF hospitalization with increasing MI size, even after adjusting for relevant factors. Additional analyses indicated an association between therapy-related reductions in MI size with decline in HF hospitalizations, but not mortality (107).
A more recent analysis of the same randomized trials identified MVO (measured at a median of 3 days post-reperfusion and present in 57% of patients) as an additional independent predictor of mortality after accounting for clinical characteristics and LGE size (108).
In their systematic review, El Aidi et al. (105) found insufficient evidence for any incremental value of other CMR-derived parameters such as segmental wall motion or perfusion abnormalities (at rest and/or stress), edema, or IMH. Although newer reports are available since 2014, particularly regarding IMH, edema, or MSI (103,109), overall evidence for an independent prognostic value for these indexes is far less robust and consistent than for LGE, LVEF, and MVO. Of note, CMR-based MSI on CMR performed 1 to 4 days after STEMI was proposed to entail long-term prognostic value in a cohort of 202 patients (110). However, as discussed in this consensus document, the use of post-MI edema extent as a surrogate for AAR is troublesome (15). Similarly, few small studies suggested potential prognostic implications of alternative measures such as LV volumes (111,112), right ventricular EF (113), right ventricular LGE (114), and more recently, the evaluation of LV strain by feature tracking CMR (115–117).
The extent of edema after reperfusion (as evaluated by different T2 sequences [15]), as well as the signal intensity (T2W) (86) and T2 relaxation times (15,65,88), can be affected by strong cardioprotective interventions. Therefore, edema development might be used as a secondary endpoint as a marker of injury (not as a surrogate for AAR).
Newer parametric (mapping) techniques evaluating changes in T1, T2, and/or ECV in both infarcted and remote myocardium hold substantial promise for more objective, operator-independent tissue characterization. Although these variables have generally been linked to adverse LV remodeling, there is presently a paucity of data regarding their associations with clinical events, except for some early evidence for native T1 values of remote myocardium (118,119).
In terms of the best post-MI timing for CMR performance in clinical trials, some key parameters holding robust association with hard endpoints (LGE, MVO) change over time (45,90). To be able to quantify different CMR parameters included as endpoints in the same imaging session, and based on available data, the ideal post-MI timing for the evaluation of CMR endpoints appears to be between days 3 and 7 (45,90). LGE and MVO show relative stability and proven prognostic value in this time window.
The Central Illustration shows the hierarchy of recommended CMR outcomes in clinical trials and experimental studies.
CENTRAL ILLUSTRATION. Hierarchy of Recommended Cardiac Magnetic Resonance Endpoints in Experimental Studies and Clinical Trials.
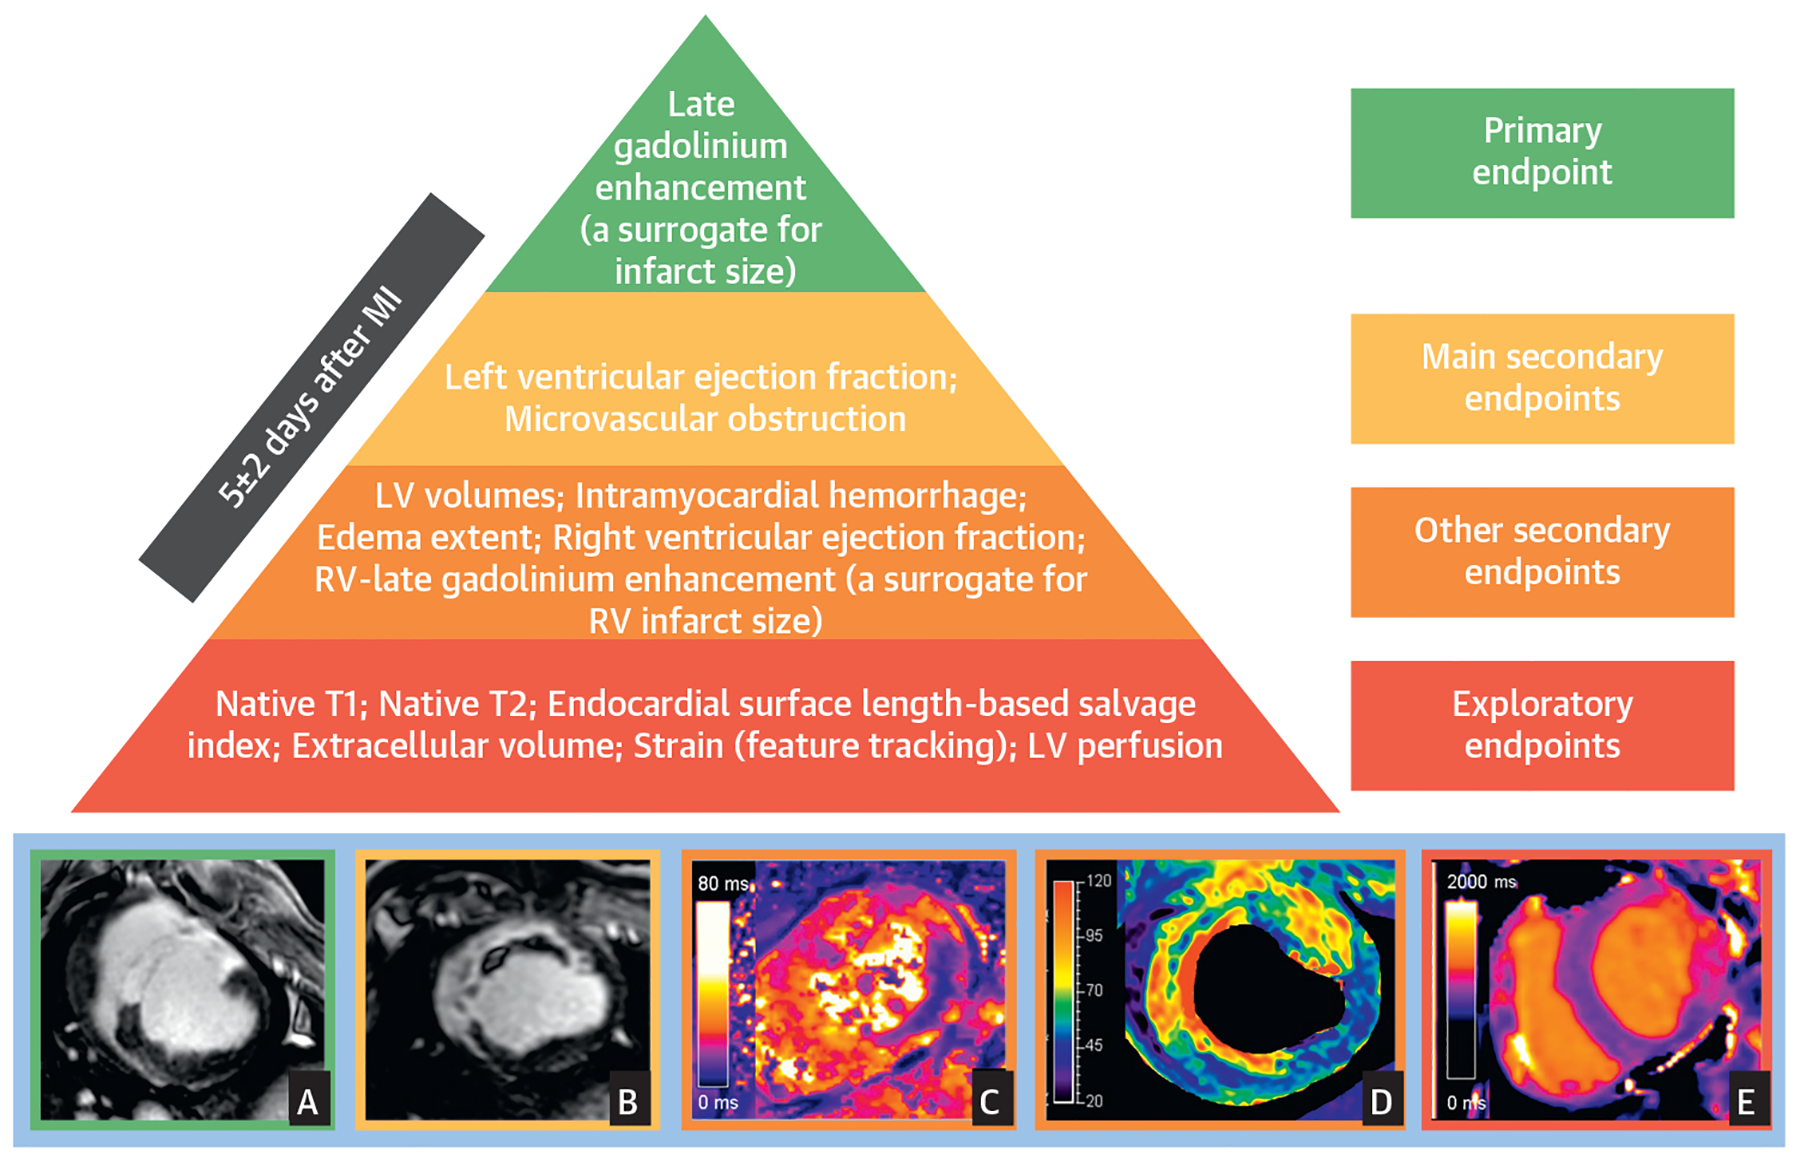
Recommended CMR endpoints and illustrative images. LGE predicts 1-year death and incident heart failure. The best time point for quantification is 3 to 7 days post-MI. The main criteria for selection of endpoints were associations with MACE, and consistent evidence in multiple studies. Secondary endpoints proposed are those with consistent links to MACE. Other secondary endpoints are those with associations with MACE that are inconsistent among studies and/or do not persist after adjustment for other CMR variables. Exploratory endpoints are those with no or anecdotal evidence of an association with MACE. Representative images for some surrogates are presented at the bottom of the figure (A: infarct size on LGE, B: extensive MVO within LGE area, C: IMH in the lateral wall on T2* mapping, D: intense edema in anteroseptal wall on T2 mapping; E: T1 mapping abnormalities in lateral wall). A, B, and D correspond to pig I/R experiments (images courtesy of Borja Ibanez and Rodrigo Fernández-Jiménez, CNIC), whereas C and E correspond to human post-STEMI cases (clinical images courtesy of Colin Berry and Peter McCartney, University of Glasgow). LV = left ventricle; RV = right ventricle.
See Table 3 for consensus related to CMR endpoints in myocardial infarction experimental and clinical studies.
TABLE 3.
Consensus Related to CMR Endpoints in Myocardial Infarction Experimental and Clinical Studies
| It is recommended that the index CMR scan be performed 5 ± 2 days after reperfusion. At this time point, several key parameters have been shown to be relatively stable |
| LGE extent, expressed both in absolute (grams) and relative (percentage of LV mass) terms, is the recommended CMR primary endpoint (106,107). |
| In experimental studies, if LGE extent is expressed as a ratio to AAR, the latter should not rely on edema and ideally both AAR and LGE have to be obtained at the same day post-MI (e.g., perfusion imaging during coronary occlusion by MDCT) and LGE by CMR) (15,89,90). |
| LVEF (%) and MVO (areas of hypoenhancement within LGE, in grams or as % of LV) are recommended as main secondary endpoints (105,108). |
| Edema extent (T2 mapping) may be used as secondary endpoint to assess the effect of cardioprotective therapies (89). |
| LV volumes (ml; ml/m2), RVEF (%), RV LGE (presence), and IMH (% of LV) can be included as secondary endpoints (111–114). |
| Myocardial mapping indexes (T1 [ms]; T2 [ms]; ECV [percentage of LV mass]), and strain (feature tracking) may be considered as exploratory endpoints (15,65,88,117–119). |
| The use of edema-sensitive CMR sequences as a surrogate for AAR (as well as edema-based MSI) is not recommended because edema is not stable in the days following MI, and is potentially affected by duration of ischemia, and by cardioprotective strategies* (15,45,89). |
| Due to its easy implementation, ESL-based salvage index may be used as an exploratory outcome but not in cases with small amounts of LGE or aborted infarction, i.e., when a high degree of cardioprotection is expected* (11,67,68,77,78). |
For LGE post-processing, automated techniques using signal-intensity thresholding, manual delineation, and visual scoring (the 2 latter at intermediate signal-intensities) have similar good accuracy and reproducibility (129). For delineation of edema, T2 mapping (automated >2SD thresholding with manual correction) showed greater intraobserver and interobserver agreement (57). For MVO quantification, the most widely used is the manual delineation of dark areas within LGE region. Extended information is provided in the Online Appendix.
Controversial topic (majority but not all panelists in agreement).
AAR = area at risk; ECV = extracellular volume; ESL = endocardial surface length; LVEF = left ventricular ejection fraction; MSI = myocardial salvage index; RV = right ventricle/ventricular; other abbreviations as in Table 1.
FUTURE DIRECTIONS
In the Online Appendix, there is a section presenting several evolving CMR methodologies that may offer insights into tissue characterization and LV function following STEMI that are either already being investigated or have the potential to be applied to STEMI patients.
CMR has become an indispensable technique for post-MI tissue characterization. However, further work is required to make CMR simpler, faster and more standardized to realize the ultimate goal of individualized patient management post-MI, tailored according to risk. Advances in free-breathing and motion-corrected T2 and T2* mapping as well as LGE imaging (120–122), without the need for breath-holding, have been already been developed to address the clinical need to further accelerate CMR data acquisition. Free-breathing, ungated, 3D contrast-enhanced CMR, which is acquired at high-resolution, is well positioned for see rapid uptake in the clinical arena for myocardial tissue characterization in the post-MI setting. Other developments in real-time cine imaging for LVEF and future re-finements in CMR fingerprinting techniques (123) (for robust and fast acquisition of simultaneous T1 and T2 mapping data per slice within 1 breath-hold) will further reduce scan time and will pave the way to make CMR more accessible to a wider number of post-infarction patients. These efforts could reduce the duration of the scan to 20 min or even less, which could reduce scan costs and improve the participation of more centers in MI-related CMR research.
The possibility of performing complete CMR studies without an exogenous gadolinium-based contrast agent has been proposed. However, the prognostic role of noncontrast CMR in comparison to standard contrast-enhanced techniques warrants further investigation. Some gadolinium contrast agents (lineal contrasts, not the ones used at present) can accumulate in some tissues (124), but the clinical significance is unknown.
Edema imaging needs to be optimized for comprehensive characterization of reversible and irreversible myocardial injury after reperfusion. One of the important challenges in the field is the development of methods to differentiate intracellular from extracellular water. The role of edema as potential therapeutic target in I/R could serve as a basis for the study of myocardial water distribution using CMR (15,33).
Imaging of remote myocardium after STEMI may provide new insights into the pathophysiology of post-MI remodeling and provide incremental risk stratification value. Given the superior diagnostic performance of quantitative mapping techniques, potential novel imaging biomarkers have emerged. Specifically, recent evidence shows an abnormal tissue composition in the remote myocardium of STEMI patients (118,119,125).
In summary, CMR holds great promise to become accessible to more patients and to be used as a tool to risk-stratify patients, guide treatment, evaluate cardioprotective therapies, and improve clinical outcomes in STEMI patients. Addressing the previously mentioned questions and directions will further extend the already established role of CMR in the assessment of myocardial infarction.
Supplementary Material
HIGHLIGHTS.
CMR is increasingly used for improved long-term risk stratification of post-MI patients and to initially evaluate cardioprotective interventions.
There is a need to standardize CMR endpoints, which should rely on pathophysiology and association with hard endpoints.
This document presents a consensus of recommendations of CMR endpoints selection in experimental and clinical trials.
Universal standardization of CMR protocols/endpoints will accelerate the process of bringing cardioprotective interventions into clinical practice.
Future studies should serve to introduce CMR as an indispensable tool affecting decision-making in daily practice.
Acknowledgments
The CNIC is supported by the ISCiii, MICINN, and the Pro CNIC Foundation, and is a Severo Ochoa Center of Excellence (award SEV-2015-0505). This research was supported (in part) by the Intramural Research Program of the National Institutes of Health, National Heart, Lung, and Blood Institute. Agencies supporting the research of coauthors are acknowledged in the Online Appendix. The authors appreciate the scientific commitment of the sponsor unrelated to industrial interests. Dr. Arai has a U.S. Government Cooperative Research and Development Agreement with Siements; has a U.S. Government Cooperative Research and Development Agreement (Clinical Trial Agreement) with Bayer; and has a U.S. Government official duty (unpaid consultant) with Circle CVI (licensed software developed at the National Institutes of Health). Dr. Arheden is a shareholder in Imacor AB. Dr. Bax has received speaker fees from Abbott Vascular and Boehringer Ingelheim; and his institution has received unrestricted research grants from Medtronic, Boston Scientific, Biotronik, Edwards Lifesciences, and GE Healthcare. Dr. Berry has institutional agreements between the University of Glasgow (employer) and Abbott Vascular, AstraZeneca, Coroventis, DalCor, GlaxoSmithKline, HeartFlow, Novartis, Philips, and Siemens Healthcare. Dr. Bucciarelli-Ducci has served as a consultant for Circle Cardiovascular Imaging. Dr. Dharmakumar has a research agreement with Siemens Healthcare. Dr. Friedrich has served as a board member and advisor for Circle Cardiovascular Imaging. Dr. Kim has received an educational grant from Siemens Healthineers; and is cofounder of HeartIT LLC. Dr. Salerno has received research support from Siemens Healthineers. Dr Croisille’s institution holds a research agreement with Siemens Healthcare, Circle Cardiovascular Imaging, and Olea Medical. Dr. Sánchez-González is an employee of Philips. All other authors have reported that they have no relationships relevant to the contents of this paper to disclose.
ABBREVIATIONS AND ACRONYMS
- AAR
area at risk
- CMR
cardiac magnetic resonance
- ECV
extracellular volume
- I/R
ischemia/reperfusion
- IMH
intramyocardial hemorrhage
- IPC
ischemic preconditioning
- LVEF
left ventricular ejection fraction
- MSI
myocardial salvage index
- MVO
microvascular obstruction
- RIC
remote ischemic conditioning
- SSFP
steady-state free precession
- STEMI
ST-segment elevation myocardial infarction
Footnotes
APPENDIX For supplemental material, please see the online version of this paper.
Accreditation and Designation Statement
The American College of Cardiology Foundation (ACCF) is accredited by the Accreditation Council for Continuing Medical Education to provide continuing medical education for physicians.
The ACCF designates this Journal-based CME activity for a maximum of 1 AMA PRA Category 1 Credit(s)™. Physicians should claim only the credit commensurate with the extent of their participation in the activity.
Successful completion of this CME activity, which includes participation in the evaluation component, enables the participant to earn up to 1 Medical Knowledge MOC point in the American Board of Internal Medicine’s (ABIM) Maintenance of Certification (MOC) program. Participants will earn MOC points equivalent to the amount of CME credits claimed for the activity. It is the CME activity provider’s responsibility to submit participant completion information to ACCME for the purpose of granting ABIM MOC credit.
Cardiac MRI Endpoints in Myocardial Infarction Experimental and Clinical Trials: JACC Scientific Expert Panel will be accredited by the European Board for Accreditation in Cardiology (EBAC) for 1 hour of External CME credits. Each participant should claim only those hours of credit that have actually been spent in the educational activity. The Accreditation Council for Continuing Medical Education (ACCME) and the European Board for Accreditation in Cardiology (EBAC) have recognized each other’s accreditation systems as substantially equivalent. Apply for credit through the post-course evaluation. While offering the credits noted above, this program is not intended to provide extensive training or certification in the field.
Method of Participation and Receipt of CME/MOC/ECME Certificate
- Be an ACC member or JACC subscriber.
- Carefully read the CME/MOC/ECME-designated article available online and in this issue of the Journal.
- Answer the post-test questions. A passing score of at least 70% must be achieved to obtain credit.
- Complete a brief evaluation.
- Claim your CME/MOC/ECME credit and receive your certificate electronically by following the instructions given at the conclusion of the activity.
CME/MOC/ECME Objective for This Article: Upon completion of this activity, the learner should be able to select the appropriate cardiac magnetic resonance endpoint to be used in clinical trials and experimental studies involving subjects with acute myocardial infarction.
CME/MOC/ECME Editor Disclosure: JACC CME/MOC/ECME Editor Ragavendra R. Baliga, MD, FACC, has reported that he has no financial relationships or interests to disclose.
Author Disclosures: The CNIC is supported by the ISCiii, MICINN, and the Pro CNIC Foundation, and is a Severo Ochoa Center of Excellence (award SEV-2015–0505). This research was supported (in part) by the Intramural Research Program of the National Institutes of Health, National Heart, Lung, and Blood Institute. Agencies supporting the research of coauthors are acknowledged in the Online Appendix. The authors appreciate the scientific commitment of the sponsor unrelated to industrial interests. Dr. Arai has a U.S. Government Cooperative Research and Development Agreement with Siements; has a U.S. Government Cooperative Research and Development Agreement (Clinical Trial Agreement) with Bayer; and has a U.S. Government official duty (unpaid consultant) with Circle CVI (licensed software developed at the National Institutes of Health). Dr. Arheden is a shareholder in Imacor AB. Dr. Bax has received speaker fees from Abbott Vascular and Boehringer Ingelheim; and his institution has received unrestricted research grants from Medtronic, Boston Scientific, Biotronik, Edwards Lifesciences, and GE Healthcare. Dr. Berry has institutional agreements between the University of Glasgow (employer) and Abbott Vascular, AstraZeneca, Coroventis, DalCor, GlaxoSmithKline, HeartFlow, Novartis, Philips, and Siemens Healthcare. Dr. Bucciarelli-Ducci has served as a consultant for Circle Cardiovascular Imaging.
Dr. Dharmakumar has a research agreement with Siemens Healthcare. Dr. Friedrich has served as a board member and advisor for Circle Cardiovascular Imaging. Dr. Kim has received an educational grant from Siemens Healthineers; and is cofounder of HeartIT LLC. Dr. Salerno has received research support from Siemens Healthineers. Dr Croisille’s institution holds a research agreement with Siemens Healthcare, Circle Cardiovascular Imaging, and Olea Medical. Dr. Sánchez-González is an employee of Philips. All other authors have reported that they have no relationships relevant to the contents of this paper to disclose.
REFERENCES
- 1.Ibanez B, Heusch G, Ovize M, Van de Werf F. Evolving therapies for myocardial ischemia/reperfusion injury. J Am Coll Cardiol 2015;65: 1454–71. [DOI] [PubMed] [Google Scholar]
- 2.Puntmann VO, Valbuena S, Hinojar R, et al. Society for Cardiovascular Magnetic Resonance (SCMR) expert consensus for CMR imaging endpoints in clinical research: part I—analytical validation and clinical qualification. J Cardiovasc Magn Reson 2018;20:67. [DOI] [PMC free article] [PubMed] [Google Scholar]
- 3.Messroghli DR, Moon JC, Ferreira VM, et al. Clinical recommendations for cardiovascular magnetic resonance mapping of T1, T2, T2* and extracellular volume: a consensus statement by the Society for Cardiovascular Magnetic Resonance (SCMR) endorsed by the European Association for Cardiovascular Imaging (EACVI). J Cardiovasc Magn Reson 2017;19:75. [DOI] [PMC free article] [PubMed] [Google Scholar]
- 4.Kramer CM, Barkhausen J, Flamm SD, Kim RJ, Nagel E. Standardized cardiovascular magnetic resonance (CMR) protocols 2013 update. J Cardiovasc Magn Reson 2013;15:91. [DOI] [PMC free article] [PubMed] [Google Scholar]
- 5.Schulz-Menger J, Bluemke DA, Bremerich J, et al. Standardized image interpretation and post processing in cardiovascular magnetic resonance: Society for Cardiovascular Magnetic Resonance (SCMR) Board of Trustees Task Force on Standardized Post Processing. J Cardiovasc Magn Reson 2013;15:35. [DOI] [PMC free article] [PubMed] [Google Scholar]
- 6.Reimer KA, Jennings RB. The “wavefront phenomenon” of myocardial ischemic cell death. II. Transmural progression of necrosis within the framework of ischemic bed size (myocardium at risk) and collateral flow. Lab Invest 1979;40: 633–44. [PubMed] [Google Scholar]
- 7.Yellon DM, Hearse DJ, Crome R, Wyse RK. Temporal and spatial characteristics of evolving cell injury during regional myocardial ischemia in the dog: the “border zone” controversy. J Am Coll Cardiol 1983;2:661–70. [DOI] [PubMed] [Google Scholar]
- 8.Axford-Gatley RA, Wilson GJ. The “border zone” in myocardial infarction. An ultrastructural study in the dog using an electron-dense blood flow marker. Am J Pathol 1988;131:452–64. [PMC free article] [PubMed] [Google Scholar]
- 9.Leshnower BG, Sakamoto H, Hamamoto H, Zeeshan A, Gorman JH 3rd., Gorman RC. Progression of myocardial injury during coronary occlusion in the collateral-deficient heart: a non-wavefront phenomenon. Am J Physiol Heart Circ Physiol 2007;293:H1799–804. [DOI] [PubMed] [Google Scholar]
- 10.Ubachs JF, Sorensson P, Engblom H, et al. Myocardium at risk by magnetic resonance imaging: head-to-head comparison of T2-weighted imaging and contrast-enhanced steady-state free precession. Eur Heart J Cardiovasc Imaging 2012; 13:1008–15. [DOI] [PMC free article] [PubMed] [Google Scholar]
- 11.Fuernau G, Eitel I, Franke V, et al. Myocardium at risk in ST-segment elevation myocardial infarction comparison of T2-weighted edema imaging with the MR-assessed endocardial surface area and validation against angiographic scoring. J Am Coll Cardiol Img 2011;4:967–76. [DOI] [PubMed] [Google Scholar]
- 12.Factor SM, Sonnenblick EH, Kirk ES. The histologic border zone of acute myocardial infarction—islands or peninsulas? Am J Pathol 1978;92:111–24. [PMC free article] [PubMed] [Google Scholar]
- 13.Arai AE. Fuzzy or sharp borders of acute myocardial ischemia and infarction? J Am Coll Cardiol Img 2015;8:1390–2. [DOI] [PubMed] [Google Scholar]
- 14.Dall’Armellina E, Karia N, Lindsay AC, et al. Dynamic changes of edema and late gadolinium enhancement after acute myocardial infarction and their relationship to functional recovery and salvage index. Circ Cardiovasc Imaging 2011;4: 228–36. [DOI] [PMC free article] [PubMed] [Google Scholar]
- 15.Fernandez-Jimenez R, Galan-Arriola C, Sanchez-Gonzalez J, et al. Effect of ischemia duration and protective interventions on the temporal dynamics of tissue composition after myocardial infarction. Circ Res 2017;121:439–50. [DOI] [PMC free article] [PubMed] [Google Scholar]
- 16.Engblom H, Hedstrom E, Heiberg E, Wagner GS, Pahlm O, Arheden H. Rapid initial reduction of hyperenhanced myocardium after reperfused first myocardial infarction suggests recovery of the peri-infarction zone: one-year follow-up by MRI. Circ Cardiovasc Imag 2009;2: 47–55. [DOI] [PubMed] [Google Scholar]
- 17.Garcia-Dorado D, Andres-Villarreal M, Ruiz-Meana M, Inserte J, Barba I. Myocardial edema: a translational view. J Mol Cell Cardiol 2012;52: 931–9. [DOI] [PubMed] [Google Scholar]
- 18.Whalen DA Jr., Hamilton DG, Ganote CE, Jennings RB. Effect of a transient period of ischemia on myocardial cells. I. Effects on cell volume regulation. Am J Pathol 1974;74:381–97. [PMC free article] [PubMed] [Google Scholar]
- 19.Kloner RA, Ganote CE, Whalen DA Jr., Jennings RB. Effect of a transient period of ischemia on myocardial cells. II. Fine structure during the first few minutes of reflow. Am J Pathol 1974;74:399–422. [PMC free article] [PubMed] [Google Scholar]
- 20.Mewton N, Rapacchi S, Augeul L, et al. Determination of the myocardial area at risk with pre- versus post-reperfusion imaging techniques in the pig model. Basic Res Cardiol 2011;106: 1247–57. [DOI] [PubMed] [Google Scholar]
- 21.Turschner O, D’Hooge J, Dommke C, et al. The sequential changes in myocardial thickness and thickening which occur during acute transmural infarction, infarct reperfusion and the resultant expression of reperfusion injury. Eur Heart J 2004; 25:794–803. [DOI] [PubMed] [Google Scholar]
- 22.Jennings RB. Historical perspective on the pathology of myocardial ischemia/reperfusion injury. Circ Res 2013;113:428–38. [DOI] [PubMed] [Google Scholar]
- 23.Rochitte CE, Lima JA, Bluemke DA, et al. Magnitude and time course of microvascular obstruction and tissue injury after acute myocardial infarction. Circulation 1998;98:1006–14. [DOI] [PubMed] [Google Scholar]
- 24.Kali A, Kumar A, Cokic I, et al. Chronic manifestation of postreperfusion intramyocardial hemorrhage as regional iron deposition: a cardiovascular magnetic resonance study with ex vivo validation. Circ Cardiovasc Imaging 2013;6: 218–28. [DOI] [PubMed] [Google Scholar]
- 25.Kali A, Cokic I, Tang R, et al. Persistent microvascular obstruction after myocardial infarction culminates in the confluence of ferric iron oxide crystals, proinflammatory burden, and adverse remodeling. Circ Cardiovasc Imaging 2016;9:e004996. [DOI] [PMC free article] [PubMed] [Google Scholar]
- 26.Carberry J, Carrick D, Haig C, et al. Persistent iron within the infarct core after ST-segment elevation myocardial infarction: implications for left ventricular remodeling and health outcomes. J Am Coll Cardiol Img 2018;11:1248–56. [DOI] [PMC free article] [PubMed] [Google Scholar]
- 27.Hamirani YS, Wong A, Kramer CM, Salerno M. Effect of microvascular obstruction and intramyocardial hemorrhage by CMR on LV remodeling and outcomes after myocardial infarction: a systematic review and meta-analysis. J Am Coll Cardiol Img 2014;7:940–52. [DOI] [PMC free article] [PubMed] [Google Scholar]
- 28.Arheden H, Saeed M, Higgins CB, et al. Measurement of the distribution volume of gadopentetate dimeglumine at echo-planar MR imaging to quantify myocardial infarction: comparison with 99mTc-DTPA autoradiography in rats. Radiology 1999;211:698–708. [DOI] [PubMed] [Google Scholar]
- 29.Hu C, Huber S, Latif SR, et al. REPAIRit: improving myocardial nulling and ghosting artifacts of 3D navigator-gated late gadolinium enhancement imaging during arrhythmia. J Magn Reson Imaging 2019;49:688–99. [DOI] [PubMed] [Google Scholar]
- 30.Viallon M, Jacquier A, Rotaru C, et al. Head-to-head comparison of eight late gadolinium-enhanced cardiac MR (LGE CMR) sequences at1.5 tesla: from bench to bedside. J Magn Reson Imaging 2011;34:1374–87. [DOI] [PubMed] [Google Scholar]
- 31.Jablonowski R, Engblom H, Kanski M, et al. Contrast-enhanced CMR overestimates early myocardial infarct size: mechanistic insights using ECV measurements on day 1 and day 7. J Am Coll Cardiol Img 2015;8:1379–89. [DOI] [PubMed] [Google Scholar]
- 32.Garg P, Broadbent DA, Swoboda PP, et al. Extra-cellular expansion in the normal, noninfarcted myocardium is associated with worsening of regional myocardial function after acute myocardial infarction. J Cardiovasc Magn Reson 2017;19:73. [DOI] [PMC free article] [PubMed] [Google Scholar]
- 33.Andres-Villarreal M, Barba I, Poncelas M, et al. Measuring water distribution in the heart: preventing edema reduces ischemia-reperfusion injury. J Am Heart Assoc 2016;5:e003843. [DOI] [PMC free article] [PubMed] [Google Scholar]
- 34.Garcia-Dorado D, Oliveras J, Gili J, et al. Analysis of myocardial oedema by magnetic resonance imaging early after coronary artery occlusion with or without reperfusion. Cardiovasc Res 1993;27:1462–9. [DOI] [PubMed] [Google Scholar]
- 35.Fernandez-Jimenez R, Sanchez-Gonzalez J, Aguero J, et al. Fast T2 gradient-spin-echo (T2-GraSE) mapping for myocardial edema quantification: first in vivo validation in a porcine model of ischemia/reperfusion. J Cardiovasc Magn Reson 2015;17:92. [DOI] [PMC free article] [PubMed] [Google Scholar]
- 36.Friedrich MG. Myocardial edema—a new clinical entity? Nat Rev 2010;7:292–6. [DOI] [PubMed] [Google Scholar]
- 37.Lotan CS, Miller SK, Cranney GB, Pohost GM, Elgavish GA. The effect of postinfarction intramyocardial hemorrhage on transverse relaxation time. Magn Reson Med 1992;23:346–55. [DOI] [PubMed] [Google Scholar]
- 38.Aletras AH, Tilak GS, Natanzon A, et al. Retrospective determination of the area at risk for reperfused acute myocardial infarction with T2-weighted cardiac magnetic resonance imaging: histopathological and displacement encoding with stimulated echoes (DENSE) functional validations. Circulation 2006;113:1865–70. [DOI] [PubMed] [Google Scholar]
- 39.Friedrich MG, Abdel-Aty H, Taylor A, Schulz-Menger J, Messroghli D, Dietz R. The salvaged area at risk in reperfused acute myocardial infarction as visualized by cardiovascular magnetic resonance. J Am Coll Cardiol 2008;51:1581–7. [DOI] [PubMed] [Google Scholar]
- 40.Berry C, Kellman P, Mancini C, et al. Magnetic resonance imaging delineates the ischemic area at risk and myocardial salvage in patients with acute myocardial infarction. Circ Cardiovasc Imaging 2010;3:527–35. [DOI] [PMC free article] [PubMed] [Google Scholar]
- 41.Abdel-Aty H, Zagrosek A, Schulz-Menger J, et al. Delayed enhancement and T2-weighted cardiovascular magnetic resonance imaging differentiate acute from chronic myocardial infarction. Circulation 2004;109:2411–6. [DOI] [PubMed] [Google Scholar]
- 42.Francone M, Bucciarelli-Ducci C, Carbone I, et al. Impact of primary coronary angioplasty delay on myocardial salvage, infarct size, and microvascular damage in patients with ST-segment elevation myocardial infarction: insight from cardiovascular magnetic resonance. J Am Coll Cardiol 2009;54:2145–53. [DOI] [PubMed] [Google Scholar]
- 43.Eitel I, Desch S, Fuernau G, et al. Prognostic significance and determinants of myocardial salvage assessed by cardiovascular magnetic resonance in acute reperfused myocardial infarction. J Am Coll Cardiol 2010;55:2470–9. [DOI] [PubMed] [Google Scholar]
- 44.Kim HW, Van Assche L, Jennings RB, et al. Relationship of T2-Weighted MRI Myocardial Hyperintensity and the Ischemic Area-At-Risk. Circ Res 2015;117:254–65. [DOI] [PMC free article] [PubMed] [Google Scholar]
- 45.Fernandez-Jimenez R, Barreiro-Perez M, Martin-Garcia A, et al. Dynamic Edematous Response of the Human Heart to Myocardial Infarction: Implications for Assessing Myocardial Area at Risk and Salvage. Circulation 2017;136:1288–300. [DOI] [PMC free article] [PubMed] [Google Scholar]
- 46.Cury RC, Shash K, Nagurney JT, et al. Cardiac magnetic resonance with T2-weighted imaging improves detection of patients with acute coronary syndrome in the emergency department. Circulation 2008;118:837–44. [DOI] [PubMed] [Google Scholar]
- 47.Smulders MW, Bekkers SC, Kim HW, Van Assche LM, Parker MA, Kim RJ. Performance of CMR Methods for Differentiating Acute From Chronic MI. J Am Coll Cardiol Img 2015;8:669–79. [DOI] [PMC free article] [PubMed] [Google Scholar]
- 48.Zhou X, Rundell V, Liu Y, et al. T(2) -weighted STIR imaging of myocardial edema associated with ischemia-reperfusion injury: the influence of proton density effect on image contrast. J Magn Reson Imaging 2011;33:962–7. [DOI] [PubMed] [Google Scholar]
- 49.Raman SV, Simonetti OP, Winner MW 3rd., et al. Cardiac magnetic resonance with edema imaging identifies myocardium at risk and predicts worse outcome in patients with non-ST-segment elevation acute coronary syndrome. J Am Coll Cardiol 2010;55:2480–8. [DOI] [PMC free article] [PubMed] [Google Scholar]
- 50.Fernandez-Jimenez R, Garcia-Prieto J, Sanchez-Gonzalez J, et al. Pathophysiology underlying the bimodal edema phenomenon after myocardial ischemia/reperfusion. J Am Coll Cardiol 2015;66:816–28. [DOI] [PubMed] [Google Scholar]
- 51.Fernandez-Jimenez R, Sanchez-Gonzalez J, Aguero J, et al. Myocardial edema after ischemia/ reperfusion is not stable and follows a bimodal pattern: imaging and histological tissue characterization. J Am Coll Cardiol 2015;65:315–23. [DOI] [PubMed] [Google Scholar]
- 52.Galan-Arriola C, Lobo M, Vilchez-Tschischke JP, et al. Serial magnetic resonance imaging to identify early stages of anthracycline-induced cardiotoxicity. J Am Coll Cardiol 2019; 73:779–91. [DOI] [PubMed] [Google Scholar]
- 53.Kellman P, Aletras AH, Mancini C, McVeigh ER, Arai AE. T2-prepared SSFP improves diagnostic confidence in edema imaging in acute myocardial infarction compared to turbo spin echo. Magn Reson Med 2007;57:891–7. [DOI] [PMC free article] [PubMed] [Google Scholar]
- 54.Aletras AH, Kellman P, Derbyshire JA, Arai AE. ACUT2E TSE-SSFP: a hybrid method for T2-weighted imaging of edema in the heart. Magn Reson Med 2008;59:229–35. [DOI] [PubMed] [Google Scholar]
- 55.Viallon M, Mewton N, Thuny F, et al. T2-weighted cardiac MR assessment of the myocardial area-at-risk and salvage area in acute reperfused myocardial infarction: comparison of state-of-the-art dark blood and bright blood T2-weighted sequences. J Magn Reson Imaging 2012;35:328–39. [DOI] [PubMed] [Google Scholar]
- 56.Giri S, Chung YC, Merchant A, et al. T2 quantification for improved detection of myocardial edema. J Cardiovasc Magn Reson 2009;11:56. [DOI] [PMC free article] [PubMed] [Google Scholar]
- 57.McAlindon EJ, Pufulete M, Harris JM, et al. Measurement of myocardium at risk with cardiovascular MR: comparison of techniques for edema imaging. Radiology 2015;275:61–70. [DOI] [PubMed] [Google Scholar]
- 58.Ferreira VM, Piechnik SK, Dall’Armellina E, et al. Non-contrast T1-mapping detects acute myocardial edema with high diagnostic accuracy: a comparison to T2-weighted cardiovascular magnetic resonance. J Cardiovasc Magn Reson 2012; 14:42. [DOI] [PMC free article] [PubMed] [Google Scholar]
- 59.Ugander M, Bagi PS, Oki AJ, et al. Myocardial edema as detected by pre-contrast T1 and T2 CMR delineates area at risk associated with acute myocardial infarction. J Am Coll Cardiol Img 2012; 5:596–603. [DOI] [PMC free article] [PubMed] [Google Scholar]
- 60.Bulluck H, White SK, Rosmini S, et al. T1 mapping and T2 mapping at 3T for quantifying the area-at-risk in reperfused STEMI patients. J Cardiovasc Magn Reson 2015;17:73. [DOI] [PMC free article] [PubMed] [Google Scholar]
- 61.Croisille P, Kim HW, Kim RJ. Controversies in cardiovascular MR imaging: T2-weighted imaging should not be used to delineate the area at risk in ischemic myocardial injury. Radiology 2012;265: 12–22. [DOI] [PubMed] [Google Scholar]
- 62.Jennings RB, Sommers HM, Kaltenbach JP, West JJ. Electrolyte alterations in acute myocardial ischemic injury. Circ Res 1964;14:260–9. [DOI] [PubMed] [Google Scholar]
- 63.Rehwald WG, Fieno DS, Chen EL, Kim RJ, Judd RM. Myocardial magnetic resonance imaging contrast agent concentrations after reversible and irreversible ischemic injury. Circulation 2002;105: 224–9. [DOI] [PubMed] [Google Scholar]
- 64.Garcia-Dorado D, Oliveras J. Myocardial oedema: a preventable cause of reperfusion injury? Cardiovasc Res 1993;27:1555–63. [DOI] [PubMed] [Google Scholar]
- 65.Dongworth RK, Campbell-Washburn AE, Cabrera-Fuentes HA, et al. Quantifying the area-at-risk of myocardial infarction in-vivo using arterial spin labeling cardiac magnetic resonance. Sci Rep 2017;7:2271. [DOI] [PMC free article] [PubMed] [Google Scholar]
- 66.Carlsson M, Ubachs JF, Hedstrom E, Heiberg E, Jovinge S, Arheden H. Myocardium at risk after acute infarction in humans on cardiac magnetic resonance: quantitative assessment during follow-up and validation with single-photon emission computed tomography. J Am Coll Cardiol Img 2009;2:569–76. [DOI] [PubMed] [Google Scholar]
- 67.Wright J, Adriaenssens T, Dymarkowski S, Desmet W, Bogaert J. Quantification of myocardial area at risk with T2-weighted CMR: comparison with contrast-enhanced CMR and coronary angiography. J Am Coll Cardiol Img 2009;2:825–31. [DOI] [PubMed] [Google Scholar]
- 68.Ubachs JF, Engblom H, Erlinge D, et al. Cardiovascular magnetic resonance of the myocardium at risk in acute reperfused myocardial infarction: comparison of T2-weighted imaging versus the circumferential endocardial extent of late gadolinium enhancement with transmural projection. J Cardiovasc Magn Reson 2010;12:18. [DOI] [PMC free article] [PubMed] [Google Scholar]
- 69.Kumar A, Beohar N, Arumana JM, et al. CMR imaging of edema in myocardial infarction using cine balanced steady-state free precession. J Am Coll Cardiol Img 2011;4:1265–73. [DOI] [PMC free article] [PubMed] [Google Scholar]
- 70.Hammer-Hansen S, Ugander M, Hsu LY, et al. Distinction of salvaged and infarcted myocardium within the ischaemic area-at-risk with T2 mapping. Eur Heart J Cardiovasc Imaging 2014;15:1048–53. [DOI] [PMC free article] [PubMed] [Google Scholar]
- 71.Dall’Armellina E, Piechnik SK, Ferreira VM, et al. Cardiovascular magnetic resonance by non contrast T1-mapping allows assessment of severity of injury in acute myocardial infarction. J Cardiovasc Magn Reson 2012;14:15. [DOI] [PMC free article] [PubMed] [Google Scholar]
- 72.van der Pals J, Hammer-Hansen S, Nielles-Vallespin S, et al. Temporal and spatial characteristics of the area at risk investigated using computed tomography and T1-weighted magnetic resonance imaging. Eur Heart J Cardiovasc Imaging 2015;16:1232–40. [DOI] [PMC free article] [PubMed] [Google Scholar]
- 73.Hammer-Hansen S, Leung SW, Hsu LY, et al. Early gadolinium enhancement for determination of area at risk: a preclinical validation study. J Am Coll Cardiol Img 2017;10:130–9. [DOI] [PMC free article] [PubMed] [Google Scholar]
- 74.Nordlund D, Kanski M, Jablonowski R, et al. Experimental validation of contrast-enhanced SSFP cine CMR for quantification of myocardium at risk in acute myocardial infarction. J Cardiovasc Magn Reson 2017;19:12. [DOI] [PMC free article] [PubMed] [Google Scholar]
- 75.Sorensson P, Heiberg E, Saleh N, et al. Assessment of myocardium at risk with contrast enhanced steady-state free precession cine cardiovascular magnetic resonance compared to single-photon emission computed tomography. J Cardiovasc Magn Reson 2010;12:25. [DOI] [PMC free article] [PubMed] [Google Scholar]
- 76.Nordlund D, Klug G, Heiberg E, et al. Multi-vendor, multicentre comparison of contrast-enhanced SSFP and T2-STIR CMR for determining myocardium at risk in ST-elevation myocardial infarction. Eur Heart J Cardiovasc Imaging 2016; 17:744–53. [DOI] [PMC free article] [PubMed] [Google Scholar]
- 77.Ortiz-Perez JT, Meyers SN, Lee DC, et al. Angiographic estimates of myocardium at risk during acute myocardial infarction: validation study using cardiac magnetic resonance imaging. Eur Heart J 2007;28:1750–8. [DOI] [PubMed] [Google Scholar]
- 78.Versteylen MO, Bekkers SC, Smulders MW, et al. Performance of angiographic, electrocardiographic and MRI methods to assess the area at risk in acute myocardial infarction. Heart 2012;98: 109–15. [DOI] [PubMed] [Google Scholar]
- 79.Foltz WD, Yang Y, Graham JJ, Detsky JS, Dick AJ, Wright GA. T2 fluctuations in ischemic and post-ischemic viable porcine myocardium in vivo. J Cardiovasc Magn Reson 2006;8:469–74. [DOI] [PubMed] [Google Scholar]
- 80.Fernandez-Jimenez R, Sanchez-Gonzalez J, Aaueero J, et al. Myocardial edema after ischemia/reperfusion is not stable and follows a bimodal pattern imaging and histological tissue characterization. J Am Coll Cardiol 2015;65:315–23. [DOI] [PubMed] [Google Scholar]
- 81.Carrick D, Haig C, Ahmed N, et al. Temporal evolution of myocardial hemorrhage and edema in patients after acute ST-segment elevation myocardial infarction: pathophysiological insights and clinical implications. J Am Heart Assoc 2016;5: e002834. [DOI] [PMC free article] [PubMed] [Google Scholar]
- 82.Alkhalil M, Borlotti A, De Maria GL, et al. Dynamic changes in injured myocardium, very early after acute myocardial infarction, quantified using T1 mapping cardiovascular magnetic resonance. J Cardiovasc Magn Reson 2018;20:82. [DOI] [PMC free article] [PubMed] [Google Scholar]
- 83.An DA, Chen BH, Rui W, et al. Diagnostic performance of intravoxel incoherent motion diffusion-weighted imaging in the assessment of the dynamic status of myocardial perfusion. J Magn Reson Imaging 2018;48:1602–9. [DOI] [PubMed] [Google Scholar]
- 84.Stiermaier T, Thiele H, Eitel I. Early myocardial edema after acute myocardial infarction is stable and not bimodal in humans—evidence from a large CMR multicenter study. Int J Cardiol 2017;246: 87–9. [DOI] [PubMed] [Google Scholar]
- 85.Symons R, Claus P, Marchi A, Dresselaers T, Bogaert J. Quantitative and qualitative assessment of acute myocardial injury by CMR at multiple time points after acute myocardial infarction. Int J Cardiol 2018;259:43–6. [DOI] [PubMed] [Google Scholar]
- 86.Thuny F, Lairez O, Roubille F, et al. Post-conditioning reduces infarct size and edema in patients with ST-segment elevation myocardial infarction. J Am Coll Cardiol 2012;59:2175–81. [DOI] [PubMed] [Google Scholar]
- 87.Bodi V, Ruiz-Nodar JM, Feliu E, et al. Effect of ischemic postconditioning on microvascular obstruction in reperfused myocardial infarction. Results of a randomized study in patients and of an experimental model in swine. Int J Cardiol 2014;175:138–46. [DOI] [PubMed] [Google Scholar]
- 88.White SK, Frohlich GM, Sado DM, et al. Remote ischemic conditioning reduces myocardial infarct size and edema in patients with ST-segment elevation myocardial infarction. J Am Coll Cardiol Intv 2015;8:178–88. [DOI] [PubMed] [Google Scholar]
- 89.Bulluck H, Chan MHH, Paradies V, et al. Impact of cardioprotective therapies on the edema-based area-at-risk by CMR in reperfused STEMI. J Am Coll Cardiol 2018;71:2856–8. [DOI] [PubMed] [Google Scholar]
- 90.Bulluck H, Hammond-Haley M, Weinmann S, Martinez-Macias R, Hausenloy DJ. Myocardial infarct size by CMR in clinical cardioprotection studies: insights from randomized controlled trials. J Am Coll Cardiol Img 2017;10:230–40. [DOI] [PMC free article] [PubMed] [Google Scholar]
- 91.Engblom H, Heiberg E, Erlinge D, et al. Sample size in clinical cardioprotection trials using myocardial salvage index, infarct size, or biochemical markers as endpoint. J Am Heart Assoc 2016;5:e002708. [DOI] [PMC free article] [PubMed] [Google Scholar]
- 92.Hervas A, de Dios E, Forteza MJ, et al. Intra-coronary infusion of thioflavin-S to study microvascular obstruction in a model of myocardial infarction. Rev Esp Cardiol (Engl Ed) 2015;68: 928–34. [DOI] [PubMed] [Google Scholar]
- 93.Nijveldt R, Hofman MB, Hirsch A, et al. Assessment of microvascular obstruction and prediction of short-term remodeling after acute myocardial infarction: cardiac MR imaging study. Radiology 2009;250:363–70. [DOI] [PubMed] [Google Scholar]
- 94.Garcia-Prieto J, Villena-Gutierrez R, Gomez M, et al. Neutrophil stunning by metoprolol reduces infarct size. Nat Commun 2017;8:14780. [DOI] [PMC free article] [PubMed] [Google Scholar]
- 95.Wu KC. CMR of microvascular obstruction and hemorrhage in myocardial infarction. J Cardiovasc Magn Reson 2012;14:68. [DOI] [PMC free article] [PubMed] [Google Scholar]
- 96.Carrick D, Haig C, Rauhalammi S, et al. Prognostic significance of infarct core pathology revealed by quantitative non-contrast in comparison with contrast cardiac magnetic resonance imaging in reperfused ST-elevation myocardial infarction survivors. Eur Heart J 2016;37:1044–59. [DOI] [PMC free article] [PubMed] [Google Scholar]
- 97.Anderson LJ, Holden S, Davis B, et al. Cardiovascular T2-star (T2*) magnetic resonance for the early diagnosis of myocardial iron overload. Eur Heart J 2001;22:2171–9. [DOI] [PubMed] [Google Scholar]
- 98.Payne AR, Berry C, Kellman P, et al. Bright-blood T(2)-weighted MRI has high diagnostic accuracy for myocardial hemorrhage in myocardial infarction: a preclinical validation study in swine. Circ Cardiovasc Imaging 2011;4:738–45. [DOI] [PMC free article] [PubMed] [Google Scholar]
- 99.Wang G, Yang HJ, Kali A, et al. Influence of myocardial hemorrhage on staging of reperfused myocardial infarctions with T2 cardiac magnetic resonance imaging: insights into the dependence on infarction type with ex vivo validation. J Am Coll Cardiol Img 2019;12:693–703. [DOI] [PMC free article] [PubMed] [Google Scholar]
- 100.Grothues F, Smith GC, Moon JC, et al. Comparison of interstudy reproducibility of cardiovascular magnetic resonance with two-dimensional echocardiography in normal subjects and in patients with heart failure or left ventricular hyper-trophy. Am J Cardiol 2002;90:29–34. [DOI] [PubMed] [Google Scholar]
- 101.Thiele H, Kappl MJ, Conradi S, Niebauer J, Hambrecht R, Schuler G. Reproducibility of chronic and acute infarct size measurement by delayed enhancement-magnetic resonance imaging. J Am Coll Cardiol 2006;47:1641–5. [DOI] [PubMed] [Google Scholar]
- 102.Mahrholdt H, Wagner A, Holly TA, et al. Reproducibility of chronic infarct size measurement by contrast-enhanced magnetic resonance imaging. Circulation 2002;106:2322–7. [DOI] [PubMed] [Google Scholar]
- 103.Pontone G, Guaricci AI, Andreini D, et al. Prognostic stratification of patients with ST-segment-elevation myocardial infarction (PROSPECT): a cardiac magnetic resonance study. Circ Cardiovasc Imaging 2017;10:e006428. [DOI] [PubMed] [Google Scholar]
- 104.Stiermaier T, Jobs A, de Waha S, et al. Optimized prognosis assessment in ST-segment-elevation myocardial infarction using a cardiac magnetic resonance imaging risk score. Circ Cardiovasc Imaging 2017;10:e006774. [DOI] [PubMed] [Google Scholar]
- 105.El Aidi H, Adams A, Moons KG, et al. Cardiac magnetic resonance imaging findings and the risk of cardiovascular events in patients with recent myocardial infarction or suspected or known coronary artery disease: a systematic review of prognostic studies. J Am Coll Cardiol 2014;63: 1031–45. [DOI] [PubMed] [Google Scholar]
- 106.Stone GW, Selker HP, Thiele H, et al. Relationship between infarct size and outcomes following primary PCI: patient-level analysis from 10 randomized trials. J Am Coll Cardiol 2016;67: 1674–83. [DOI] [PubMed] [Google Scholar]
- 107.Selker HP, Udelson JE, Ruthazer R, et al. Relationship between therapeutic effects on infarct size in acute myocardial infarction and therapeutic effects on 1-year outcomes: a patient-level analysis of randomized clinical trials. Am Heart J 2017;188:18–25. [DOI] [PubMed] [Google Scholar]
- 108.de Waha S, Patel MR, Granger CB, et al. Relationship between microvascular obstruction and adverse events following primary percutaneous coronary intervention for ST-segment elevation myocardial infarction: an individual patient data pooled analysis from seven randomized trials. Eur Heart J 2017;38:3502–10. [DOI] [PubMed] [Google Scholar]
- 109.Bonanad C, Monmeneu JV, Lopez-Lereu MP, et al. Prediction of long-term major events soon after a first ST-segment elevation myocardial infarction by cardiovascular magnetic resonance. Eur J Radiol 2016;85:585–92. [DOI] [PubMed] [Google Scholar]
- 110.Eitel I, Desch S, de Waha S, et al. Long-term prognostic value of myocardial salvage assessed by cardiovascular magnetic resonance in acute reperfused myocardial infarction. Heart 2011;97: 2038–45. [DOI] [PubMed] [Google Scholar]
- 111.Wu E, Ortiz JT, Tejedor P, et al. Infarct size by contrast enhanced cardiac magnetic resonance is a stronger predictor of outcomes than left ventricular ejection fraction or end-systolic volume index: prospective cohort study. Heart 2008;94:730–6. [DOI] [PubMed] [Google Scholar]
- 112.Bodi V, Sanchis J, Nunez J, et al. Prognostic value of a comprehensive cardiac magnetic resonance assessment soon after a first ST-segment elevation myocardial infarction. J Am Coll Cardiol Img 2009;2:835–42. [DOI] [PubMed] [Google Scholar]
- 113.Miszalski-Jamka T, Klimeczek P, Tomala M, et al. Extent of RV dysfunction and myocardial infarction assessed by CMR are independent outcome predictors early after STEMI treated with primary angioplasty. J Am Coll Cardiol Img 2010;3: 1237–46. [DOI] [PubMed] [Google Scholar]
- 114.Grothoff M, Elpert C, Hoffmann J, et al. Right ventricular injury in ST-elevation myocardial infarction: risk stratification by visualization of wall motion, edema, and delayed-enhancement cardiac magnetic resonance. Circ Cardiovasc Imaging 2012;5:60–8. [DOI] [PubMed] [Google Scholar]
- 115.Yoon YE, Kang SH, Choi HM, et al. Prediction of infarct size and adverse cardiac outcomes by tissue tracking-cardiac magnetic resonance imaging in ST-segment elevation myocardial infarction. Eur Radiol 2018;28:3454–63. [DOI] [PubMed] [Google Scholar]
- 116.Eitel I, Stiermaier T, Lange T, et al. Cardiac magnetic resonance myocardial feature tracking for optimized prediction of cardiovascular events following myocardial infarction. J Am Coll Cardiol Img 2018;11:1433–44. [DOI] [PubMed] [Google Scholar]
- 117.Podlesnikar T, Pizarro G, Fernandez-Jimenez R, et al. Effect of early metoprolol during ST-segment elevation myocardial infarction on left ventricular strain: feature-tracking cardiovascular magnetic resonance substudy from the METOCARD-CNIC trial. J Am Coll Cardiol Img 2018. September 6 [E-pub ahead of print]. [DOI] [PubMed] [Google Scholar]
- 118.Carrick D, Haig C, Rauhalammi S, et al. Pathophysiology of LV remodeling in survivors of STEMI: inflammation, remote myocardium, and prognosis. J Am Coll Cardiol Img 2015;8: 779–89. [DOI] [PMC free article] [PubMed] [Google Scholar]
- 119.Reinstadler SJ, Stiermaier T, Liebetrau J, et al. Prognostic significance of remote myocardium alterations assessed by quantitative noncontrast T1 mapping in ST-segment elevation myocardial infarction. J Am Coll Cardiol Img 2018;11:411–9. [DOI] [PubMed] [Google Scholar]
- 120.Yang HJ, Sharif B, Pang J, et al. Free-breathing, motion-corrected, highly efficient whole heart T2 mapping at 3T with hybrid radial-cartesian trajectory. Magn Reson Med 2016;75:126–36. [DOI] [PMC free article] [PubMed] [Google Scholar]
- 121.Kellman P, Xue H, Spottiswoode BS, et al. Free-breathing T2* mapping using respiratory motion corrected averaging. J Cardiovasc Magn Reson 2015;17:3. [DOI] [PMC free article] [PubMed] [Google Scholar]
- 122.Kellman P, Arai AE. Cardiac imaging techniques for physicians: late enhancement. J Magn Reson Imaging 2012;36:529–42. [DOI] [PMC free article] [PubMed] [Google Scholar]
- 123.Hamilton JI, Jiang Y, Chen Y, et al. MR fingerprinting for rapid quantification of myocardial T1, T2, and proton spin density. Magn Reson Med 2017; 77:1446–58. [DOI] [PMC free article] [PubMed] [Google Scholar]
- 124.Kanda T, Fukusato T, Matsuda M, et al. Gadolinium-based contrast agent accumulates in the brain even in subjects without severe renal dysfunction: evaluation of autopsy brain specimens with inductively coupled plasma mass spectroscopy. Radiology 2015;276: 228–32. [DOI] [PubMed] [Google Scholar]
- 125.Carberry J, Carrick D, Haig C, et al. Remote zone extracellular volume and left ventricular remodeling in survivors of ST-elevation myocardial infarction. Hypertension 2016;68: 385–91. [DOI] [PMC free article] [PubMed] [Google Scholar]
- 126.Botker HE, Hausenloy D, Andreadou I, et al. Practical guidelines for rigor and reproducibility in preclinical and clinical studies on cardioprotection. Basic Res Cardiol 2018;113:39. [DOI] [PMC free article] [PubMed] [Google Scholar]
- 127.Foltz WD, Yang Y, Graham JJ, Detsky JS, Wright GA, Dick AJ. MRI relaxation fluctuations in acute reperfused hemorrhagic infarction. Magn Reson Med 2006;56:1311–9. [DOI] [PubMed] [Google Scholar]
- 128.Rochitte CE, Lima JAC, Bluemke DA, et al. Magnitude and time course of microvascular obstruction and tissue injury after acute myocardial infarction. Circulation 1998;98: 1006–14. [DOI] [PubMed] [Google Scholar]
- 129.Klem I, Heiberg E, Van Assche L, et al. Sources of variability in quantification of cardiovascular magnetic resonance infarct size—reproducibility among three core laboratories. J Cardiovasc Magn Reson 2017;19:62. [DOI] [PMC free article] [PubMed] [Google Scholar]
Associated Data
This section collects any data citations, data availability statements, or supplementary materials included in this article.