Abstract
Background & Aims:
The vitronectin receptor integrin alpha v beta 3 (αvβ3) drives fibrogenic activation of hepatic stellate cells (HSC). Molecular imaging targeting the integrin αvβ3 could provide a non-invasive method for evaluating the expression and the function of the integrin αvβ3 on activated HSCs (aHSCs) in the injured liver. In this study, we sought to compare differences in uptake of the [18F]-Alfatide between normal and injured liver to evaluate its utility for assessment of hepatic fibrogenesis.
Methods:
PET with [18F]-Alfatide, non-enhanced computerized tomography (CT), histopathology, immunofluorescence staining, immunoblotting and gene analysis were performed to evaluate and quantify hepatic integrin αvβ3 levels and liver fibrosis progression in carbon-tetrachloride (CCl4) and bile duct ligation (BDL) induced liver fibrosis mice model. The AUC liver 0–30 min to AUC blood 0–30 min contrast was used as an integrin αvβ3–PET index to quantify fibrosis progression. Ex vivo analysis of frozen liver tissue from patients with fibrosis and cirrhosis verified the animal findings.
Results:
Fibrotic mouse livers showed enhanced [18F]-Alfatide uptake and retention compared to control livers. The radiotracer was demonstrated to bind specifically with integrin αvβ3 mainly expressed on aHSCs. Autoradiography and histopathology confirmed the PET imaging results. Further, the mRNA and protein level of integrin αvβ3 and its signaling complex were higher in CCl4 and BDL models compared to controls. Human fibrotic liver section results supported the animal findings.
Conclusions:
Imaging hepatic integrin αvβ3 with PET and [18F]-Alfatide offers a potential noninvasive method for monitoring the progression of liver fibrosis.
Keywords: [18F]-Alfatide, PET imaging, Liver fibrosis, integrin αvβ3
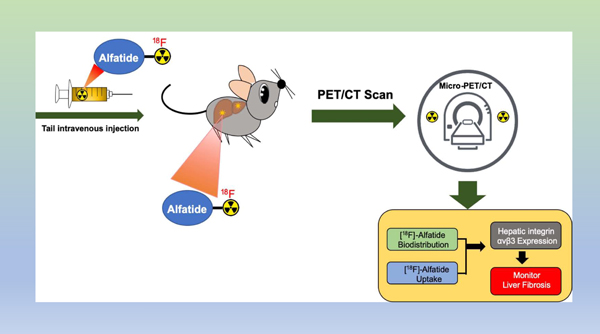
Graphical Abstract
Lay Summary:
Integrin αvβ3 expression on activated hepatic stellate cells (HSC) is associated with HSC proliferation during hepatic fibrogenesis. As a PET tracer based on dimeric RGD peptide, [18F]-Alfatide has high integrin αvβ3-binding affinity and specificity. [18F]-Alfatide specifically visualizes increased αvβ3 expression in preclinical liver fibrosis models and human tissue, which can be used as a surrogate imaging biomarker of hepatic fibrosis.
Introduction
Liver fibrosis is a wound-healing process characterized by the accumulation of extracellular matrix (ECM) proteins in response to chronic injury [1]. The accumulation of ECM proteins (mainly collagen type I and III) distorts the normal hepatic architecture and forms fibrous scars. As collagen deposition increases, nodules of regenerating hepatocytes result in cirrhosis with its high morbidity and mortality [2]. Current methods for evaluating liver fibrosis often provide an incomplete picture of disease. Procedures and biomarkers for determining fibrosis include ultrasonography (US), elastography, age, platelet count, albumin, and serum AST and ALT values [3, 4]. Even when these techniques are incorporated into multifactorial scoring systems, they still suffer from low sensitivity and specificity, and often don’t correlate with the degree of fibrosis [5, 6]. Liver biopsy is the gold standard for assessing fibrosis, but unfortunately this technique samples a limited hepatic volume and can only be performed at a limited frequency due to concerns regarding complication rates [7].
There is reason to believe that hepatic integrin αvβ3 may be a useful surrogate diagnostic biomarker for the extent of fibrosis. Hepatic stellate cells (HSCs) are important collagen-producing cells and αvβ3 expression on activated HSC’s is associated with HSC proliferation during fibrogenesis [8, 9]. In addition, imaging hepatic integrin αvβ3 may provide information about therapeutic strategies designed to reduce collagen-producing aHSCs, either by disrupting αvβ3-ECM interactions or through other approaches [10].
The PET tracer used here to image hepatic integrin αvβ3, [18F]-Alfatide, has several advantages. Developed by Chen and coworkers at NIH [11, 12], [18F]-Alfatide is a dimer of RGD peptides, utilizing multivalent affinity enhancement to increase its interactions with its integrin target [13–15]. Second, [18F]-Alfatide features a radiosynthesis whereby fluoride ion (18F−) tenaciously binds the aluminum of an Al3+: NOTA complex rather than undergoing formation of covalent 18F-C bond [12, 16, 17]. [18F]-Alfatide’s relatively simple radiosynthesis is an advantage when multi-site clinical trials are considered. Finally, [18F]-Alfatide has been used in several clinical studies [18–20].
Thus, a series of factors, the shortcomings of current liver fibrosis diagnostic methods, the importance of αvβ3 expression on aHSCs for collagen synthesis, the simplicity of [18F]-Alfatide radiochemistry and the prior clinical uses of [18F]-Alfatide, all suggest an [18F]-Alfatide/PET combination might be useful for imaging hepatic integrin αvβ3. To further this possibility, we employed [18F]-Alfatide/PET with the CCl4 and bile duct ligation (BDL) mouse models of hepatic disease. With both models, the 18F-Alfatide/PET technique imaged hepatic integrin αvβ3, and integrin αvβ3 expression correlated with disease severity and the degree of fibrosis. These results suggest [18F]-Alfatide/PET may offer a non-invasive imaging modality for quantifying hepatic αvβ3, which serves as a surrogate PET biomarker for liver fibrosis in clinical settings.
Materials and methods
Animal Models of Liver Fibrosis
We studied liver fibrosis in two experimental models. In the first model, 10-week-old CD1 male mice were treated with carbon-tetrachloride (CCl4, Sigma, St. Louis, MO) at a dose of 0.2 mL/kg in a 1:5 CCl4: olive oil mixture, administered by means of intraperitoneal (i.p.) injection twice per week for 12 weeks. Control animals were treated with vehicle (olive oil). In the second, bile duct ligation-induced biliary fibrosis model, mice were transected at the common bile duct after midline laparotomy. Sham treated mice underwent midline laparotomy, but the duct was exposed without scission. Mice were sacrificed after 3 weeks. All mice were housed in a pathogen-free, temperature-controlled animal facility with 12 h light/12 h dark cycle. All animal protocols were approved by the Institutional Animal Care and Use Committee of the Massachusetts General Hospital.
Serum ALT assay
Mouse serum was collected by orbital vein bleeding at the time of euthanasia. Serum alanine aminotransferase (ALT) and aspartate aminotransferase (AST) were analyzed by Infinity AST and ALT reagent (Thermo Fisher Scientific).
Histological analysis
The liver tissues were collected in 4% paraformaldehyde and then embedded in paraffin. Formalin-fixed paraffin-embedded (FFPE) tissues were cut into 5µm sections and stained with hematoxylin and eosin (H&E, Sigma, St. Louis, MO) and analyzed by light microscopy. For hepatic fibrosis analysis, FFPE liver sections were stained with Sirius red F35B (Sigma, St. Louis, MO) to visualize collagen, nuclei were counterstained with hematoxylin.
Immunofluorescent staining of FFPE tissue
FFPE tissue was processed for staining as described previously with the following modifications [21]. Following deparaffinization, IHC antigen retrieval solution (Thermo Fisher Scientific) was performed in the chamber. Unreacted aldehydes were quenched for 10 min with 1% NaBH4. Non-specific antibody binding was blocked with either 1% IgG-free BSA or 5% Normal donkey serum (Jackson Immuno, West Grove, PA) in TBS (Tris-buffered saline), depending on the antibodies used. Primary antibodies were incubated overnight at 4 °C. Sections were washed with TBS and Alexa Fluor-conjugated secondary antibodies (Thermo Fisher Scientific) were applied for 30 min at room temperature. DAPI counterstain and slides mountant used ProLong Diamond Antifade Mountant with DAPI (Invitrogen). Primary antibodies used were: anti-integrin αvβ3 (Santa Cruz biotechnology), anti-α-SMA (Abcam), anti-CD68 (Cell Signaling Technology).
Quantitative PCR (qPCR)
Total RNA from liver tissue was isolated by QIA Shredder and RNeasy kit (Qiagen). Total RNA was reverse transcribed (RT) using a high-capacity cDNA reverse transcription kit with random primers (Applied Biosystems Inc.). To quantify gene expression, quantitative real-time PCR was performed using an ABI QuantStudio 3 system (Applied Biosystems Inc.) and Power Up SYBR green master mix (Thermo Fisher Scientific). The primers used in this study are listed in Supplementary Table 2. Data were expressed as relative mRNA levels using the △△CT method.
Western blot analysis
Liver tissues were lysed by use of RIPA buffer containing a protease inhibitor cocktail (Sigma Life Science). An appropriate amount of protein in total tissue lysates was separated by SDS-PAGE with NuPAGE Novex precast 4 to 12% Bis-Tris gradient gels (Invitrogen) and blotted onto polyvinylidene difluoride membrane (Millipore Sigma). The membranes were blocked with 5% nonfat dry milk and incubated overnight at 4 °C with the different primary antibodies diluted in blocking buffer. Primary antibodies included anti-Integrin αv and anti-β3 (Santa Cruz biotechnology). The secondary antibodies were HRP-conjugated enhanced chemiluminescence (ECL) (Sigma Life Science). Protein bands were detected by a ChemiDoc Molecular Imager (Bio-Rad). Western blot band quantification was performed using Image lab (Bio-Rad) and normalized to β-actin (Sigma Life Science).
Ex vivo Autoradiography
Frozen mouse and human liver tissue sections were sectioned into 20 µm slices by freezing microtome (Thermo Fisher Scientific), and the slices were mounted on the slide glass. These sections were pre-active in ice-cold Tris-HCl buffer (pH7.4) for 20 mins, then incubated with [18F]-Alfatide in 50 mM Tris-HCl buffer (pH7.4) at room temperature for 1 hour, washed with ice-cold Tris-HCl buffer for 2 min twice, warmly blow-dried and contacted to an imaging film (GE healthcare) for 6 hours. The imaging film was scanned with a GE Amersham Typhoon imaging system at a pixel size of 50X50 µm and the data were analyzed by ImageJ software (National Institutes of Health).
PET/CT Imaging Operation and Quantification
PET/CT images of CCl4 and BDL models of liver fibrosis and control mice were made on a microPET Focus 220 PET scanner (Siemens Medical Solutions USA, Inc., Malvern, PA) and the CereTom NL 3000 CT scanner (Neurologica, Danvers, MA). The scanner’s detection system provided a 1.5 mm spatial resolution for 18F. The image acquisition settings were: tube voltage 100 kV, tube current 5 mA, resolution 6 s/projection, axial mode with slice thickness of 1.25 mm. Image pixel size was set to 0.49×0.49×1.25 mm. PET/CT image co-registration was carried out manually using ASIProVM software (Siemens/CTI Concorde Microsystems, Knoxville, TN). Mice were anesthetized with 1.5% (v/v) isoflurane/air mixture at 300 ml/min using a SomnoSuite® small animal anesthesia platform (Kent Scientific). 6 catheterized mice were positioned in two vertical planes of a custom-made restraint system allowing simultaneous imaging of 6 animals. The system was connected to the clinical anesthesia platform supplying a 1.5% isoflurane/oxygen mixture at 2 l/min. A syringe filled with 0.1 cc of 3.5–3.7 MBq of 18F-Alfatide was inserted into each T connector and intravenous injection started simultaneously with 30-min PET image acquisition of the liver area. After the PET image acquisition, a single whole-body CT scan was obtained.
PET Imaging Quantification
PET data were reconstructed into dynamic data set consisting of 17 image frames of the following durations: 15, 15, 15,15, 30, 30, 30, 30, 60, 60, 60, 120, 120, 300, 300, 300, and 300 s. Each image frame was represented by a matrix with the pixel size of 0.95 mm and a fixed slice thickness of 0.8 mm obtained using a 2-dimensional (2-D) ordered-subset expectation maximization (OSEM2D) protocol featuring 4 iterations. The dynamic PET images were analyzed to obtain numerical kinetic data for multiple manually selected regions of interest (ROIs) drawn liver areas. All subsequent image processing and analysis were performed on non-host workstations using ASIProVM software (Siemens/CTI Concorde Microsystems, Knoxville, TN) running under 32-bit Windows XP and Inveon Research Workplace 3.0 (Siemens Medical Solutions, Inc., Malvern, PA). During raw data histogramming and image reconstruction, the corrections for isotope decay, detectors dead-time, random coincidences, and tissue attenuation were applied.
Human Specimen
We studied snap-frozen liver sections from 9 liver fibrosis patients (F1 n=3, F2 n=3 and F3 n=3). Normal liver samples were collected from 3 patients. Human liver samples were obtained from controls and patients with liver fibrosis underthe institutional review board protocols approved by the Massachusetts General Hospital (Table S1).
Statistical Analysis
Statistical analyses were performed using the statistical computer package, GraphPad Prism version 6, (GraphPad Software Inc., San Diego, CA, USA). Results are expressed as means ± SEM. Statistical comparisons were made using one-way analysis of variance (ANOVA) with Tukey’s post hoc test, or Student’s t-test where appropriate. Difference is considered to be significant at P<0.05 indicated with one asterisk (*), P<0.01 (**) or P<0.001 (***). For all figures, values of n = 3–6.
Results
Designation of Mild and Severe Levels of Liver Fibrosis in Animal Models
Following 6 weeks of CCl4 administration, a mild infiltration of inflammatory cells along with aggregated lymphocytes was observed in the portal areas (indicated by arrows, Figure 1A, b) by H&E staining. With Sirius Red, fibrotic lesions stained weakly in the portal area (mild fibrosis, Figure 1A, e), and inflammatory cells and formation of regenerative nodules of liver parenchyma separated by fibrotic septa were observed (severe fibrosis, Figure 1A, c and 1A, f). For the BDL model, at 10-day post operation, mice exhibited a moderate inflammatory cell infiltration and collagen deposition / accumulation in portal areas by histological analysis (mild fibrosis, Figure 1A, h and 1A, k). At 3 weeks, large foci of hepatic necrosis with marked inflammatory cell infiltration and extensive collagen was observed (severe fibrosis, Figure 1A, i and 1A, l).
Figure 1. Hepatic matrix deposition after CCl4 or BDL treatment.
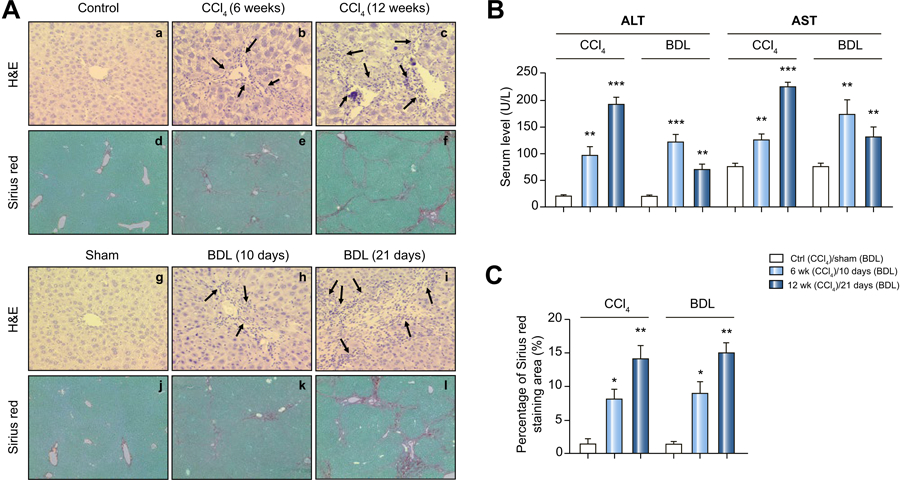
(A) Representative paraffin liver sections from sham, CCl4 mice (6 weeks-mild, 12 weeks-severe) and BDL mice (10 days-mild, 21 days-severe) are shown. Sections were stained with hemaxotoxylin and eosin (H&E) or Sirius red F35B. (Original magnifications: H&E 20X, SR 10X). Arrows indicate neutrophil infiltration.)
(B) Serum ALT and AST levels for CCl4 and BDL mice. Data are expressed as mean ± 1 SEM here and below. Statistical comparisons were made using one-way ANOVA with Tukey’s post hoc test here and below as explained in Materials and Methods.
(C) Quantification of the Sirius red collagen stain in sections. P values are relative to control/sham.
The percentage area for Sirius Red stain (Figure 1C), a measure of the amount of collagen deposition, was determined for the 6 week and 12-week CCl4 model. A similar analysis was made for the 10 day and 21-day BDL model. Based on hepatic collagen deposition, our CCl4 and BDL models produced a hepatic fibrosis that was “mild” (after 6 weeks of CCl 4 or 10 days post BDL) or “severe” (12 weeks of CCl 4 or 21 days post BDL). Below we refer to our models as CCl4-mild, CCl4-severe, BDL-mild and BDL-severe.
Serum ALT and AST enzyme levels, clinical biomarkers of liver disease [22–24], and indicators of hepatocellular injury, were then determined for the CCl4 and BDL models (Figure 1B). With the CCl4 model, mean enzyme levels increased with the duration of hepatic insult, with the levels expressed as severe > mild > sham (ALT: 190.5±15.08>96.22±18.5>20.66±1.383, AST: 223.6±8.07>125.7±9.82>76.24±6.128). On the other hand, with the BDL model mean enzyme levels can be expressed as mild > severe > sham (ALT: 121.3±14.88>68.44±12.51>20.66±1.383, AST:172.1±28.25>129.8±19.52> 76.24±6.128). While ALT and AST levels were elevated, their levels merely paralleled the severity of fibrosis in the CCl4 model, but not in the BDL model (Figure 1B).
Expression of αvβ3 and key genes in CCl4 and BDL livers
To further define the relationship between hepatic αvβ3 and liver fibrosis, western blots for the αv and β3 integrin proteins were conducted in the CCl4 and BDL models (Figure 2A). As was observed with Sirius Red/collagen staining (Figure 1C), both integrin proteins were elevated in each model with levels expressed as severe > mild > sham.
Figure 2. Hepatic expression of integrin αvβ3 and key genes (as mRNA) in CCl4 and BDL models.
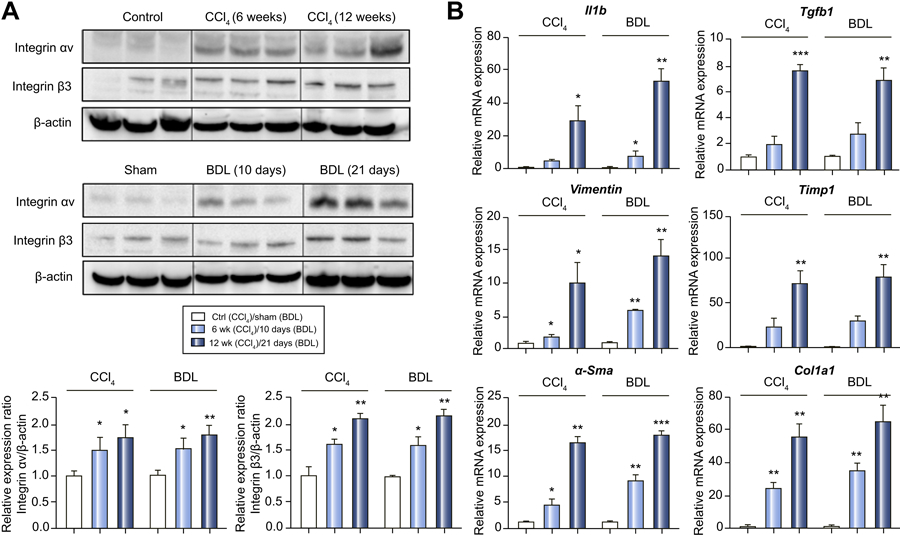
(A) Protein expression of the αv and β3 integrin subunits by western blot assay. P values are relative to control/sham.
(B) Hepatic mRNA expression levels of IL-1β, TGF-β1, Vimentin, TIMP-1, α-SMA and COL1A1 by RT-PCR.
To examine possible mechanisms involved in the liver fibrosis associated with integrin αvβ3, mRNA expression of transforming growth factor (TGF)-β1 and the functional aHSC signaling complex of integrin αvβ3 were quantified by RT-PCR (Figure 2B). The hepatic TGF-β1 mRNA level was increased by 2- and 8-fold after 6 and 12 weeks of CCl4 treatment, as compared to control. TGF-β1 mRNA levels also increased 2.5- and 7.5-fold, at 10 and 21 days post-BDL as compared to sham. Similarly, the proinflammatory cytokine gene IL-1β, fibroblast marker vimentin, the ECM gene TIMP-1, myofibroblast gene α-SMA and collagen type I gene COL1A1 were increased with integrin αvβ3 expression during fibrosis progression in both the CCl4 and BDL models (Figure 2B). More robust increases were observed in models with more severe fibrosis.
Distribution of αvβ3, monocytes/macrophages (CD68) and α-smooth muscle actin (α-SMA) in advanced fibrotic livers
To further assess the relationship between collagen deposition and αvβ3, we compared collagen deposition with CD68 antigen, a marker for cells of the monocyte/macrophages lineage. In the normal liver, CD68 is a marker for Kupffer cells, which stains sparsely compared with the more numerous CD68(−) hepatocytes. In our two models, we used CD68 staining as a measure of the abnormal monocyte/macrophage infiltration induced by the CCl4 and BDL stresses. Figure 3A compares hepatic immunofluorescence for αvβ3 (green) and CD68 (red) in the severe CCl4 and severe BDL models. As expected for the normal/sham liver, virtually no staining for CD68 was seen. However, in both models, CD68 staining increased and was present in a diffuse pattern. A merged image of αvβ3 (green) and CD68 (red) showed little co-localization, which was confirmed by quantitative analysis in Figure 3C.
Figure 3: Distribution of αvβ3, CD68 and α-SMA with severe CCl4 and BDL fibrosis livers.
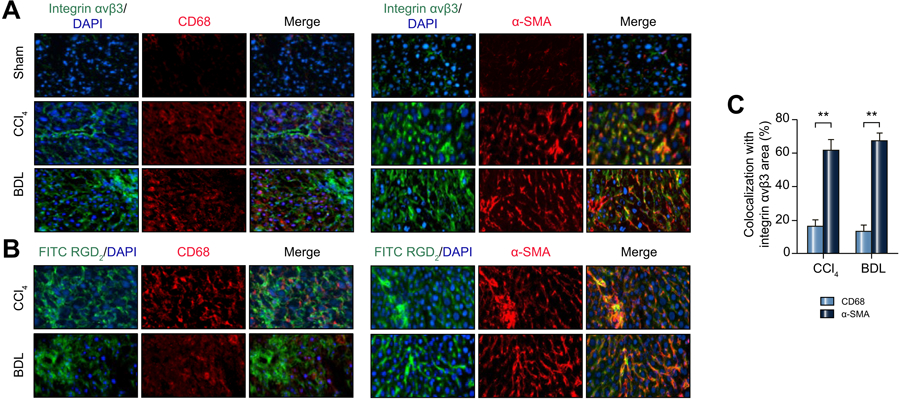
(A) Colocalization of integrin αvβ3 (green), CD68 (red) and α-SMA (red) by immunofluorescence in the CCl4 and BDL models. The merged images were obtained by overlaying the images of αvβ3, CD68 and α-SMA. (Original magnifications: 100X).
(B) Colocalization of FITC-RGD2 (green) with CD68 (red) and α-SMA (red) in the CCl4 and BDL models. (Original magnifications: 100X).
(C) Quantification of colocalization area of integrin αvβ3 with CD68 and α-SMA.
The distribution of αvβ3 (green) and α-SMA (red) in severe CCl4 and severe BDL models is shown in Figure 3A. Merged images indicate high co-localization, which again was confirmed by quantitative analysis in Figure 3C. Integrin αvβ3 (green) co-localized with α-SMA (red) at 62.5 ± 6.6 in severe CCl4 fibrosis and at 67.5 ± 5.2 in severe BDL fibrosis. In contrast, the co-localization of CD68 (red) with integrin αvβ3 (green) was not strong, with values of 18.3 ± 5.82 in severe CCl4 fibrosis and 17.2 ± 4.87 in severe BDL fibrosis.
Binding Characteristics of Alfatide in advanced fibrotic livers Ex vivo
To verify the binding characteristics of Alfatide in fibrotic livers, frozen fibrotic liver sections were stained with FITC-RGD2 (FITC-E(PEG4-RGDfK)2, a fluorescent version of Alfatide, see supplementary figure 4), α-SMA and CD68 to differentiate binding characteristic of integrin αvβ3 between activated HSCs and inflammation. As shown in Figure 3B, FITC-RGD2 shows a high co-localization with α-SMA; however, FITC-RGD2 showed little co-localization with CD68. These results illustrated the similar binding characteristics of FITC-RGD2 with integrin αvβ3 antibody in liver fibrosis sections.
PET/CT imaging and quantitation of [18F]-Alfatide in fibrotic livers
Since our data suggested that integrin αvβ3 levels correlated with the severity of fibrosis in our CCl4 and BDL models, we performed 30 min dynamic integrin αvβ3-PET scans after [18F]-Alfatide injection. Figure 4A shows representative transverse PET and CT images of normal and CCl4-mild and CCl4-severe livers, while Figure 4B shows similar images for BDL-mild and BDL-severe livers. Hepatic uptake was then analyzed as the liver AUC divided by blood AUC over 30 minutes, a procedure which quantifies the hepatic radioactivity from the PET images with results shown in Figure 4C and Figure 4D. Uptake of [18F]-Alfatide was seen with the CCl4 and BDL models, and hepatic radioactivity was increased as fibrosis progressed from mild to severe. In order to eliminate blood flow effects and minimize inter-test variation, time-activity curves (TACs) of blood uptake were also quantified (Supplementary Figure 1). The AUCliver (0–30 min) to AUCblood (0–30 min) contrast was used as an integrin αvβ3–PET index to quantify fibrosis progression. The radioactivity ratio of the liver to blood was significantly increased in mild and severe CCl4 and BDL mice compared to controls, which confirmed the PET image results.
Figure 4. [18F]-Alfatide/PET for imaging hepatic αvβ3 expression with mild and severe CCl4 and BDL mice.
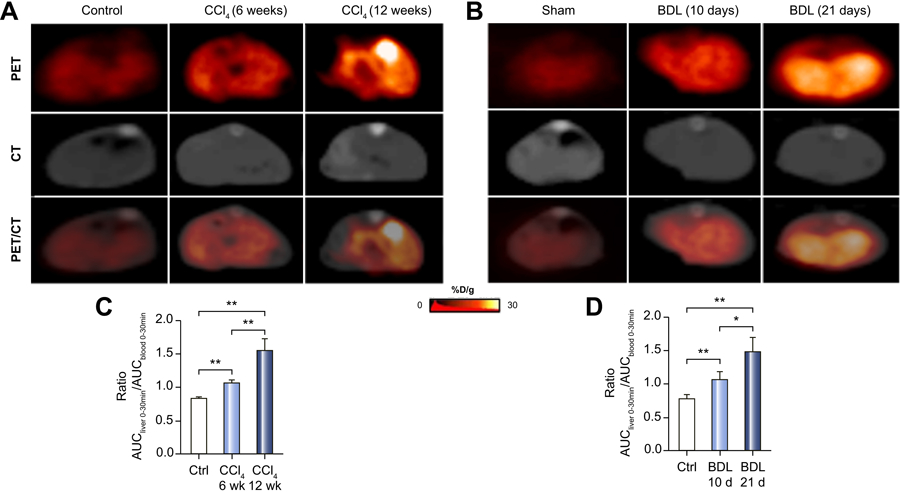
(A) Representative transverse PET images of the livers of 6 and 12-week CCl4 and control mice.
(B) Representative transverse PET images of 10 and 21-day BDL and sham mice.
(C) Hepatic radioactivity for CCl4 mice expressed as liver AUC0–30 min divided by blood AUC0–30 min.
(D) Hepatic radioactivity for BDL expressed as in (C).
[18F]-Alfatide autoradiography and αvβ3 expression in mouse models
To demonstrate that our PET tracer, [18F]-Alfatide, bound hepatic integrin αvβ3 as predicted in our mouse models, we correlated [18F]-Alfatide binding by autoradiography and αvβ3 expression by immunofluorescence. With CCl4 model (Figure 5A) and BDL model (Figure 5B), bound radioactivity increased with disease severity and paralleled immunofluorescence for integrin αvβ3 levels. Radioactivity from 5A and 5B was further quantified as shown in Figure 5C.
Figure 5. Ex vivo [18F]-Alfatide autoradiography and αvβ3 immunofluorescence in liver sections CCl4 and BDL mice.
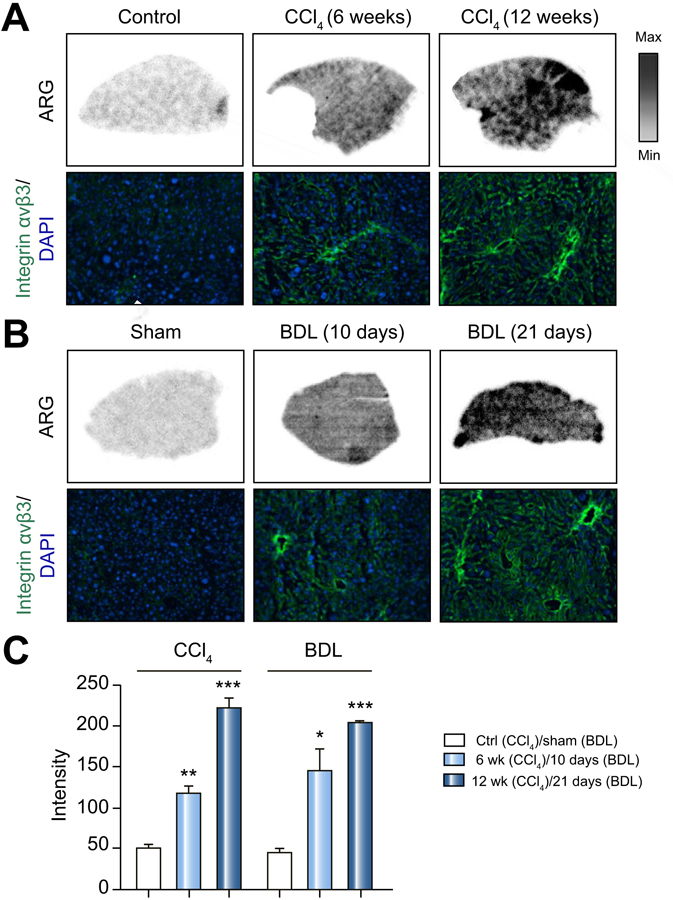
(A) Representative autoradiographic images of liver sections incubated with [18F]-Alfatide for control mice, mild and severe CCl4 mice. Selected area was stained with DAPI (blue) and αvβ3 (Green).
(B) Representative autoradiographic mages of liver sections treated as in (A) for mild and severe BDL mice. Selected area was stained with DAPI (blue) and αvβ3 (Green).
(C) Quantitation of radioactivity as intensity from (A) and (B). Values are mean ±1 SEM. P values are relative to sham.
[18F]-Alfatide autoradiography and Integrin αvβ3 distribution in human liver samples
To help determine whether our findings might be clinically translatable, we evaluated the binding of [18F]-Alfatide to human liver tissue obtained from biopsies of healthy patients and those with hepatic fibrosis. Figure 6A shows the autoradiography of [18F]-Alfatide binding to liver sections, with the increase in radioactivity as fibrosis increased from mild (F1) to severe (F3). Figure 6A also indicates the results of integrin αvβ3 immunohistochemical staining (green) and α-SMA (red) staining of liver sections in the boxes shown in autoradiography (top). Integrin αvβ3 expression and α-SMA were found in fibrotic but not control samples. Finally, the amount of [18F]-Alfatide binding (Figure 6B) correlated with the distribution of integrin αvβ3 and α-SMA expression in hepatic lobules. We also performed FITC-RDG2 in human advanced fibrotic liver frozen sections. Figure 6C shows FITC-RGD2 have a high co-localization with α-SMA, but a low co-localization with CD68 in advanced human liver section.
Figure 6. Ex vivo [18F]-Alfatide autoradiography and distribution of αvβ3, CD68 and collagen with liver sections of normal, mild, moderate and severely fibrotic patients.
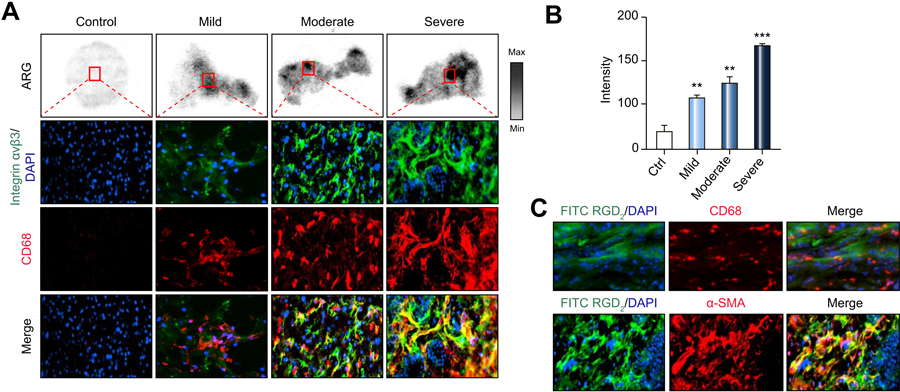
(A) Representative autoradiographic images after incubation of [18F]-Alfatide for healthy patients and for patients with mild, moderate and severe fibrosis. Selected area was stained for αvβ3 (green) and α-SMA (red).
(B) Quantitation of radioactivity from (A).
(C) Colocalization of FITC-RGD2 (green) with CD68 (red) and α-SMA (red) in advanced fibrosis human liver tissues. (Original magnifications: 100X).
Discussion
To our knowledge, this is the first study that systematically validates [18F]-Alfatide imaging in liver fibrosis by performing a spatially precise correlative analysis of PET/CT imaging, histopathology, integrin αvβ3 expression and autoradiography examination in both preclinical rodent models and clinical fibrotic liver specimens. We employed two commonly used fibrosis models: CCl4 intoxication and surgical bile duct ligation (BDL). CCl4 toxicity results from the generation of trichloromethyl (CCl3) radicals by oxidases, which results in lipid peroxidation. Lipid damage leads to hepatocyte necrosis and apoptosis and, along with defective repair, to fibrosis. As fibrosis spreads vascular structures draining the hepatic sinusoid are impaired with the development of cirrhosis [25, 26]. BDL toxicity results from the accumulation toxic bile acids in hepatocytes and in oval cell (precursor cells for hepatocytes) and cholangiocyte (epithelial cells of biliary ducts), the latter playing a key role in the initiation and progression of fibrosis in this model [27]. Though the CCl4 and BDL models produce effects through different toxins, hepatic αvβ3 was a surrogate biomarker of fibrosis and inflammation with both.
We characterized both models, first for the development of fibrosis by Sirius Red collagen staining (Figures 1A and 1B), defining “mild” (6 weeks of CCl 4 treatment or 10 days post a BDL) and “severe” (12 weeks of CCl 4 or 21 days post BDL). Serum ALT and AST levels correlated with the extent of fibrosis in the CCl4 model but not in the BDL model, where these enzymes were lower in severe rather than mild fibrosis (Figure 1C). Consistent with previous studies [28, 29], ALT and AST levels do not correlate well with the degree of fibrosis, and these measures may not have utility in identifying patients with advanced fibrosis. However, since hepatic integrin αvβ3 expression correlated well with the progression of fibrosis in two distinct injury models (vide infra), αvβ3-specific molecular imaging may be a useful and practical diagnostic method for determining the degree of fibrosis.
With both CCl4 and BDL models, hepatic αvβ3 was quantified by Western blots of the αv and β3 proteins (Figure 2A), paralleled α-SMA expression (Figure 3 A) and disease duration. Similarly, the expression of six profibrogenicand pro-inflammatory genes (Figure 2B) also paralleled disease duration with both models (e.g. IL1β, TGF-β1). TGF-β1 is recognized as a key profibrogenic cytokine and a stimulus for collagen formation due to its role in hepatic stellate cell (HSC) activation [30, 31]. TGF-β not only stimulates the synthesis of extracellular matrix (ECM) proteins like collagen I (Figure 2B) and α-SMA (Figure 2B, 3A), it inhibits their degradation by upregulating tissue inhibitors of metalloproteases (e.g. TIMP-1, Figure 2B) which degrade ECM proteins [32].
With the activation of HSCs, integrin αvβ3 is expressed on HSCs, not accumulation in the inflammation sites or macrophages (Kupffer cells) of fibrotic liver [33, 34]. Our results demonstrate that positive integrin αvβ3 staining in fibrotic livers essentially overlapped with positive α-SMA staining, an indicator of aHSCs. Integrin αvβ3 expressed in macrophages was shown to be lower than α-SMA positive cells (Fig. 3A, B). To investigate the exact location of RGD2 in the fibrotic liver tissues, we co-stained FITC-RGD2 with α-SMA. The results confirm the HSC-specific location ex vivo. In order to exclude possible accumulation of RGD2 in the inflammation sites of fibrotic liver, we also co-stained FITC-RGD2 with CD68, the results confirmed RGD2 had low specific binding and uptake in the macrophages (Figure 3C).
To examine whether non-invasive PET imaging could determine hepatic αvβ3 levels, we imaged mice with mild and severe disease with our animal models. To correct for small differences in injected radioactivity hepatic, radioactivity was determined as the hepatic AUC divided by blood AUC from 0 to 30 minutes (y-axis of Figures 4C, D). As shown for the CCl4 (Figures 4A, C) and BDL models (Figures 4B, D), hepatic [18F]-Alfatide by PET paralleled disease severity and hepatic αvβ3. Whole body (coronal and sagittal level) PET/CT provide overall distribution of [18F]-Alfatide (Fig. S2). We next explored whether hepatic αvβ3 levels could be determined with the [18F]-Alfatide using autoradiography (ARG). Hepatic sections of severe CCl4 and severe BDL mice bound [18F]-Alfatide by ARG as shown in Figures 5A and 5B, respectively, with radioactivity quantified in Figure 5C. [18F]-Alfatide binding paralleled disease severity for both models.
Elastography is another important noninvasive method for liver fibrosis assessment [35], we performed a limited ultrasound shear wave (SWV) elastography study by using the technique of Virtual Touch tissue imaging quantification (VTIQ) in these same models. 12 weeks CCl4 group showed higher SWV than control group indicating higher elasticity of the fibrosis tissue as reported earlier [36, 37] (Fig.S3 A, B). While, it didn’t display statistically significant increase when it compared with 6 weeks CCl4 group. It could be related to the inability of elastography to detect liver fibrosis at the early stage in this model, which was also investigated by other researchers [36, 38]. Regarding the BDL models, no statistical difference between 21 days BDL and sham group (Fig.S3 C, D). It might be attributed to parenchymal necrosis in liver at this stage. Previous studies demonstrated a significant negative correlation between the degree of necrosis and elastic modulus was observed [39]. However, the PET tracer [18F]-Alfatide was able to successfully detect fibrosis progression in both models.
99mTc-labeled RGD radiotracers have been used to monitor liver fibrosis by SPECT [33, 40] [33, 40], but PET provides advantages of higher sensitivity, higher spatial resolution and easier target quantitation. Therefore, several RGD peptide-based PET tracers have been investigated for clinical translation, [18F]-Alfatide is one of the dimeric RGD peptides and already has been studied in clinical trials for lung cancer detection. To evaluate its translation potential, for the first time, we tested [18F]-Alfatide and FITC-RGD2 in human liver fibrosis tissues with different clinical stages using ex vivo autoradiography and correlated tracer uptake with immunofluorescence staining for integrin αvβ3, CD68 and α-SMA. These studies confirmed specificity of [18F]-Alfatide for integrin αvβ3 in clinical fibrotic liver samples. The human sample data suggest that we have for the first time demonstrated that the protein expression of integrin αvβ3 increases with progression of fibrosis in human tissue and also demonstrated that the probe [18F]-Alfatide is sensitive for detection of fibrosis progression. Although the present study was restricted to a limited number of human tissue samples, even in this small sample, a significant correlation of [18F]-Alfatide uptake and integrin αvβ3 expression as well as autoradiography could be demonstrated. The value of such imaging should be confirmed in larger prospective studies.
Conclusion
In summary, our data strongly suggest that PET tracer [18F]-Alfatide specifically visualizes increased αvβ3 expression in preclinical liver fibrosis models and human tissue, which can be used as a surrogate imaging biomarker of hepatic fibrosis. Based on these promising preliminary results, further prospective studies are warranted to define the clinical value of PET imaging of αvβ3 expression for clinical assessment of liver fibrosis progression.
Supplementary Material
Highlights.
The radiotracer [18F]-Alfatide was demonstrated to bind specifically with integrin αvβ3 mainly expressed on aHSCs.
The probe [18F]-Alfatide is sensitive for detection of fibrosis progression both in animal liver fibrotic models and human liver tissues.
Imaging hepatic integrin αvβ3 with PET/[18F]-Alfatide offers a potential noninvasive method for monitoring the progression of liver fibrosis
Acknowledgments
Financial support: The work presented in this study was supported by NIH grants R01A I136715, R01DK108370.
Footnotes
Publisher's Disclaimer: This is a PDF file of an unedited manuscript that has been accepted for publication. As a service to our customers we are providing this early version of the manuscript. The manuscript will undergo copyediting, typesetting, and review of the resulting proof before it is published in its final form. Please note that during the production process errors may be discovered which could affect the content, and all legal disclaimers that apply to the journal pertain.
Conflicts of Interest: The authors declare no conflict of interest.
References
- [1].Gutierrez-Ruiz MC, Robles-Diaz G, Kershenobich D. Emerging concepts in inflammation and fibrosis. Archives of medical research 2002;33:595–599. [DOI] [PubMed] [Google Scholar]
- [2].Gines P, Cardenas A, Arroyo V, Rodes J. Management of cirrhosis and ascites. The New England journal of medicine 2004;350:1646–1654. [DOI] [PubMed] [Google Scholar]
- [3].Hashimoto E, Taniai M, Tokushige K. Characteristics and diagnosis of NAFLD/NASH. Journal of gastroenterology and hepatology 2013;28 Suppl 4:64–70. [DOI] [PubMed] [Google Scholar]
- [4].Angulo P, Hui JM, Marchesini G, Bugianesi E, George J, Farrell GC, et al. The NAFLD fibrosis score: a noninvasive system that identifies liver fibrosis in patients with NAFLD. Hepatology 2007;45:846–854. [DOI] [PubMed] [Google Scholar]
- [5].Rockey DC, Bissell DM. Noninvasive measures of liver fibrosis. Hepatology 2006;43:S113–120. [DOI] [PubMed] [Google Scholar]
- [6].Rockey DC, Caldwell SH, Goodman ZD, Nelson RC, Smith AD. Liver biopsy. Hepatology 2009;49:1017–1044. [DOI] [PubMed] [Google Scholar]
- [7].Patel K, Rockey DC. Clinical Utility of Biomarkers of Liver Fibrosis. Gastroenterology & hepatology 2006;2:48–57. [PMC free article] [PubMed] [Google Scholar]
- [8].Zhou X, Murphy FR, Gehdu N, Zhang J, Iredale JP, Benyon RC. Engagement of alphavbeta3 integrin regulates proliferation and apoptosis of hepatic stellate cells. J Biol Chem 2004;279:23996–24006. [DOI] [PubMed] [Google Scholar]
- [9].Carloni V, Romanelli RG, Pinzani M, Laffi G, Gentilini P. Expression and function of integrin receptors for collagen and laminin in cultured human hepatic stellate cells. Gastroenterology 1996;110:1127–1136. [DOI] [PubMed] [Google Scholar]
- [10].Schon HT, Bartneck M, Borkham-Kamphorst E, Nattermann J, Lammers T, Tacke F, et al. Pharmacological Intervention in Hepatic Stellate Cell Activation and Hepatic Fibrosis. Frontiers in pharmacology 2016;7:33. [DOI] [PMC free article] [PubMed] [Google Scholar]
- [11].Guo N, Lang L, Li W, Kiesewetter DO, Gao H, Niu G, et al. Quantitative analysis and comparison study of [18F]AlF-NOTA-PRGD2, [18F]FPPRGD2 and [68Ga]Ga-NOTA-PRGD2 using a reference tissue model. PloS one 2012;7:e37506. [DOI] [PMC free article] [PubMed] [Google Scholar]
- [12].Lang L, Li W, Guo N, Ma Y, Zhu L, Kiesewetter DO, et al. Comparison study of [18F]FAl-NOTA-PRGD2, [18F]FPPRGD2, and [68Ga]Ga-NOTA-PRGD2 for PET imaging of U87MG tumors in mice. Bioconjugate chemistry 2011;22:2415–2422. [DOI] [PMC free article] [PubMed] [Google Scholar]
- [13].Mammen M, Choi SK, Whitesides GM. Polyvalent Interactions in Biological Systems: Implications for Design and Use of Multivalent Ligands and Inhibitors. Angewandte Chemie (International ed in English) 1998;37:2754–2794. [DOI] [PubMed] [Google Scholar]
- [14].Montet X, Funovics M, Montet-Abou K, Weissleder R, Josephson L. Multivalent effects of RGD peptides obtained by nanoparticle display. J Med Chem 2006;49:6087–6093.17004722 [Google Scholar]
- [15].Liu S Radiolabeled multimeric cyclic RGD peptides as integrin alphavbeta3 targeted radiotracers for tumor imaging. Molecular pharmaceutics 2006;3:472–487. [DOI] [PubMed] [Google Scholar]
- [16].Goldenberg DM, Sharkey RM, McBride WJ, Boerman OC. Al18F: a new standard for radiofluorination. J Nucl Med 2013;54:1170. [DOI] [PubMed] [Google Scholar]
- [17].McBride WJ, Sharkey RM, Karacay H, D’Souza CA, Rossi EA, Laverman P, et al. A novel method of 18F radiolabeling for PET. J Nucl Med 2009;50:991–998. [DOI] [PubMed] [Google Scholar]
- [18].Wan W, Guo N, Pan D, Yu C, Weng Y, Luo S, et al. First experience of 18F-alfatide in lung cancer patients using a new lyophilized kit for rapid radiofluorination. Journal of nuclear medicine : official publication, Society of Nuclear Medicine 2013;54:691–698. [DOI] [PMC free article] [PubMed] [Google Scholar]
- [19].Wu J, Wang S, Zhang X, Teng Z, Wang J, Yung BC, et al. (18)F-Alfatide II PET/CT for Identification of Breast Cancer: A Preliminary Clinical Study. J Nucl Med 2018;59:1809–1816. [DOI] [PMC free article] [PubMed] [Google Scholar]
- [20].Yu C, Pan D, Mi B, Xu Y, Lang L, Niu G, et al. (18)F-Alfatide II PET/CT in healthy human volunteers and patients with brain metastases. European journal of nuclear medicine and molecular imaging 2015;42:2021–2028. [DOI] [PMC free article] [PubMed] [Google Scholar]
- [21].Shao T, Zhao C, Li F, Gu Z, Liu L, Zhang L, et al. Intestinal HIF-1alpha deletion exacerbates alcoholic liver disease by inducing intestinal dysbiosis and barrier dysfunction. J Hepatol 2018;69:886–895. [DOI] [PMC free article] [PubMed] [Google Scholar]
- [22].Cohen JA, Kaplan MM. The SGOT/SGPT ratio--an indicator of alcoholic liver disease. Digestive diseases and sciences 1979;24:835–838. [DOI] [PubMed] [Google Scholar]
- [23].Gitlin N The serum glutamic oxaloacetic transaminase/serum glutamic pyruvic transaminase ratio as a prognostic index in severe acute viral hepatitis. The American journal of gastroenterology 1982;77:2–4. [PubMed] [Google Scholar]
- [24].Williams AL, Hoofnagle JH. Ratio of serum aspartate to alanine aminotransferase in chronic hepatitis. Relationship to cirrhosis. Gastroenterology 1988;95:734–739. [DOI] [PubMed] [Google Scholar]
- [25].Kim YO, Popov Y, Schuppan D. Optimized Mouse Models for Liver Fibrosis In: Clausen BE, Laman JD, editors. Inflammation, methods and protocols. New York, N.Y.: Humana Press; 2017. [DOI] [PubMed] [Google Scholar]
- [26].Iredale JP. Models of liver fibrosis: exploring the dynamic nature of inflammation and repair in a solid organ. J Clin Invest 2007;117:539–548. [DOI] [PMC free article] [PubMed] [Google Scholar]
- [27].Glaser SS, Gaudio E, Miller T, Alvaro D, Alpini G. Cholangiocyte proliferation and liver fibrosis. Expert reviews in molecular medicine 2009;11:e7. [DOI] [PMC free article] [PubMed] [Google Scholar]
- [28].Tarcin O, Basaranoglu M, Tahan V, Tahan G, Sucullu I, Yilmaz N, et al. Time course of collagen peak in bile duct-ligated rats. BMC gastroenterology 2011;11:45. [DOI] [PMC free article] [PubMed] [Google Scholar]
- [29].Tag CG, Sauer-Lehnen S, Weiskirchen S, Borkham-Kamphorst E, Tolba RH, Tacke F, et al. Bile duct ligation in mice: induction of inflammatory liver injury and fibrosis by obstructive cholestasis. Journal of visualized experiments : JoVE 2015. [DOI] [PMC free article] [PubMed]
- [30].Fabregat I, Moreno-Caceres J, Sanchez A, Dooley S, Dewidar B, Giannelli G, et al. TGF-beta signalling and liver disease. FEBS J 2016;283:2219–2232. [DOI] [PubMed] [Google Scholar]
- [31].Kanzler S, Lohse AW, Keil A, Henninger J, Dienes HP, Schirmacher P, et al. TGF-beta1 in liver fibrosis: an inducible transgenic mouse model to study liver fibrogenesis. The American journal of physiology 1999;276:G1059–1068. [DOI] [PubMed] [Google Scholar]
- [32].Gressner AM, Weiskirchen R, Breitkopf K, Dooley S. Roles of TGF-beta in hepatic fibrosis. Frontiers in bioscience : a journal and virtual library 2002;7:d793–807. [DOI] [PubMed] [Google Scholar]
- [33].Li F, Song Z, Li Q, Wu J, Wang J, Xie C, et al. Molecular imaging of hepatic stellate cell activity by visualization of hepatic integrin alphavbeta3 expression with SPECT in rat. Hepatology 2011;54:1020–1030. [DOI] [PubMed] [Google Scholar]
- [34].Yu X, Wu Y, Liu H, Gao L, Sun X, Zhang C, et al. Small-Animal SPECT/CT of the Progression and Recovery of Rat Liver Fibrosis by Using an Integrin αvβ3–targeting Radiotracer. Radiology 2016;279:502–512. [DOI] [PubMed] [Google Scholar]
- [35].Barr RG, Ferraioli G, Palmeri ML, Goodman ZD, Garcia-Tsao G, Rubin J, et al. Elastography Assessment of Liver Fibrosis: Society of Radiologists in Ultrasound Consensus Conference Statement. Ultrasound quarterly 2016;32:94–107. [DOI] [PubMed] [Google Scholar]
- [36].Guo Y, Lin H, Dong C, Zhang X, Wen H, Shen Y, et al. Role of acoustic radiation force impulse imaging elastography in the assessment of steatohepatitis and fibrosis in rat models. Medical engineering & physics 2018;59:30–35. [DOI] [PubMed] [Google Scholar]
- [37].Carbonell G, Berna-Serna JD, Oltra L, Martinez CM, Garcia-Carrillo N, Guzman-Aroca F, et al. Evaluation of rat liver with ARFI elastography: In vivo and ex vivo study. PLoS One 2019;14:e0217297. [DOI] [PMC free article] [PubMed] [Google Scholar]
- [38].Mueller-Abt PR, Frawley KJ, Greer RM, Lewindon PJ. Comparison of ultrasound and biopsy findings in children with cystic fibrosis related liver disease. Journal of cystic fibrosis : official journal of the European Cystic Fibrosis Society 2008;7:215–221. [DOI] [PubMed] [Google Scholar]
- [39].Elyas E, Papaevangelou E, Alles EJ, Erler JT, Cox TR, Robinson SP, et al. Correlation of Ultrasound Shear Wave Elastography with Pathological Analysis in a Xenografic Tumour Model. Sci Rep 2017;7:165. [DOI] [PMC free article] [PubMed] [Google Scholar]
- [40].Yu X, Wu Y, Liu H, Gao L, Sun X, Zhang C, et al. Small-Animal SPECT/CT of the Progression and Recovery of Rat Liver Fibrosis by Using an Integrin alphavbeta3-targeting Radiotracer. Radiology 2016;279:502–512. [DOI] [PubMed] [Google Scholar]
Associated Data
This section collects any data citations, data availability statements, or supplementary materials included in this article.


