

Abstract
Background:
Pre-clinical studies and pilot patient studies shown that chronic infarctions can be detected and characterized from CMR without gadolinium-based contrast agents using native-T1 maps at 3T. We aimed to investigate the diagnostic capacity of this approach for characterizing chronic MIs in a multi-center setting.
Methods:
Patients with a prior MI (n=105) were recruited at three different medical centers and were imaged with native-T1 mapping and LGE at 3T. Infarct location, size and transmurality were determined from native-T1 maps and LGE. Sensitivity, specificity, ROC metrics and inter- and intra-observer variabilities were assessed relative to LGE.
Results:
Across all subjects, T1 of MI territory was 1621±110 ms and remote territory was 1225±75 ms. Sensitivity, specificity and AUC for detecting MI location based on native-T1 mapping relative to LGE were 88%, 92% and 0.93, respectively. Native-T1 maps were not different for measuring infarct size (Native-T1 maps: 12.1%±7.5%; LGE: 11.8%±7.2%, p=0.82) and were in agreement with LGE (R2=0.92, bias=0.09±2.6%). Corresponding inter- and intra-observer assessments were also highly correlated (inter-observer: R2=0.90, bias=0.18±2.4%; and intra-observer: R2=0.91, bias=0.28±2.1%). Native T1 maps were not different for measuring MI transmurality (Native-T1 maps: 49.1±15.8%; LGE: 47.2±19.0%, p=0.56) and showed agreement (R2 =0.71; bias=1.32±10.2%). Corresponding inter- and intra-observer assessments were also in agreement (inter-observer: R2=0.81, bias=0.1±9.4%; and intra-observer: R2=0.91, bias=0.28±2.1%, respectively). While the overall accuracy for detecting MI with native-T1 maps at 3T was high, logistic regression analysis showed that MI location was a prominant confounder.
Conclusions:
Native-T1 mapping can be used to image chronic MI with high degree of accuracy and as such, it is a viable alternative for scar imaging in chronic MI patients who are contraindicated for LGE. Technical advancements may be needed to overcome the imaging confounders that currently limit native-T1 mapping from reaching equivalent detection levels as LGE.
Keywords: Myocardial Infarction, Magnetic Resonance Imaging, Clinical Studies
Jounal Subject Terms: Myocardial Infarction, Magnetic Resonance Imaging (MRI)
INTRODUCTION
Acute myocardial infarction (MI) afflicts millions of people in the US. While major advances in acute care have markedly reduced the rate of immediate mortality from acute MI, the long-term morbidity and death from ischemic heart failure has emerged as a major problem. Epidemiological studies1–3 indicate that in the US (i) ~ 5.1 million patients suffer from heart failure; (ii) more than 650,000 patients are annually diagnosed with new HF; and (iii) the 5-year survival rate of HF patients is less than 50%. Among HF patients, ischemic cardiomyopathy, almost always associated with prior MI, is the principal cause4 and HF patients with prior MI have worse outcome than those with non-ischemic cardiomyopathy5. Existing treatment options (appropriate medical therapy or revascularization)4,6 or appropriate therapeutic options (implantable cardiac defibrillator7or cell-based therapies8,9) require specific diagnostic information regarding chronic MI, including its presence, location, size and transmurality to deliver appropriate care. Radionuclide imaging (SPECT and PET) and CT can identify the presence and territory of chronic MI10. However, their accuracy for detection of small MIs and estimation of MI size and transmurality are not optimal due to limitations in spatial resolution11,12 and sensitivity13. Over the past 15 years, late-gadolinium-enhanced (LGE) CMR has evolved into a robust non-invasive imaging technique for detecting and characterizing chronic MI13–16.
Despite its importance, LGE CMR is limited by the need for gadolinium-based contrast agents. Importantly, ~20% of heart failure patients (~ 1 million in US) concomitantly suffer from severe (stage 4 or 5) chronic kidney disease (CKD), in many of whom prior MI is common6,17,18,19–21,. Recent studies have also shown that ~20% of MI patients (both STEMI and NSTEMI) patients suffer from late stage CKD22,23. According to the NIH and the US Renal database, the prevalence and the cost of treating new cases of CKD has more than doubled in the past 10 years and this trend is predicted to grow given the increasing longevity and increasing prevalence of diabetes which contribute to the development of CKD24. Thus, it is prefereable to characterize chronic MIs without gadolinium-based contrast agents.
Native T1 mapping at 3T has been proposed recently to address the need for imaging chronic MI in subjects who are contraindicated for gadolinium-based contrast agents19,20. To date, large-animal and single-center human studies in a limited number of patients and diagnostic metrics have demonstrated that native T1 maps at 3T has the capacity to detect and characterize regions of replacement scar from chronic MIs. The objective of this study was to investigate the diagnostic capacity of native T1 mapping at 3T for characterizing chronic MIs in a multi-center setting.
METHODS
As per Tranparency and Openness Promotion Guidelines of the Journal, the data that support the findings of this study are available from the corresponding author upon reasonable request.
Study Design:
CMR studies were performed in 105 patients with at least one prior MI greater than 1 year prior to study. The presence of chronic MI and the culprit vessels were determined based on clinical history including record of percutaneous coronary intervention (notes and images). Patients were recruited after obtaining written informed consent as approved by the Institutional Review Boards (Cedars-Sinai Medical Center, Los Angeles, CA; Severance Hospital, Yonsei University Health System, Korea; and Xuanwu Hospital, Capital Medical University, China) between March 2014 and August 2017.
CMR Studies:
CMR studies were performed on 3.0 T clinical magnetic resonance systems (MAGNETOM Trio or Verio systems, Siemens Healthcare, Erlangen, Germany). Patients were excluded from the study if they had symptoms of chest pain, electrocardiogram changes, or cardiac enzyme elevation within 1 year before the date of CMR examination; or were contraindicated for a magnetic resonance study (claustrophobia, metallic implants, glomerular filtration rate <45 ml/min/1.73 m2). Electrocardiogram-triggered breath-held 2-dimensional cine balanced steady-state free precession (bSSFP: 25 to 30 cardiac phases, repetition time/echo time = 2.92/1.46 ms, flip angle = 50°, bandwidth =888 Hz/pixel, voxel size = 1.3 × 1.3 × 8 mm3), pre-contrast modified Look-Locker inversion recovery (MOLLI25 : 8 inversion times [TI] with 2 Look-Locker cycles of 3 + 5 images; minimum TI = 120 ms, TI increment = 80 ms) with bSSFP readout (flip angle = 35°, bandwidth =1,085 Hz/pixel, voxel size = 1.5 × 1.5 × 8 mm3), and LGE images (inversion-recovery prepared segmented fast low-angle shot, acquired 10 to 12 min following intravenous administration of 0.2 mmol/kg of gadobutrol [Gadovist, Bayer Schering Pharma, Berlin, Germany]; and optimal TI for nulling the remote myocardium; repetition time/echo time = 6.54/3.27ms; flip angle = 20°; bandwidth = 460 Hz/pixel; voxel size = 1.2 × 1.2 × 8 mm3) were acquired along the short-axis direction covering the entire left ventricle with no slice gap.
Image Analyses
Motion-corrected native T1 maps were generated from the MOLLI acquisitions (described above). All image analyses were performed using cvi42 (Circle Cardiovascular Imaging Inc., Calgary, Canada). LGE images and T1 maps were randomized and independently analyzed by two reviewers blinded to clinical history with more than five years of experience with CMR and prior knowledge on the use of cvi42. Each reviewer was assigned a set of images and was allowed to window the images and complete the measurements at their own pace. After at least one month, the images and order were randomized and assigned to one reviewer for repeat measurements.
Remote myocardium was identified both on LGE images and native T1 maps as the region showing no hyperintensity. Infarcted myocardium was identified using the Mean + 5 Standard Deviations (SD) criterion based on signal intensity and native T1 in a reference region-of-interest (ROI) drawn within the remote myocardium on LGE images and native T1 maps respectively. Hypointense cores on native T1 maps within the hyperintense zones, suggestive of chronic iron deposition20 or fatty infiltration17,18,26, that were not detected as infarcted using the mean ± 5 SD criterion were manually included in the final analysis.
Infarct size was measured as the percentage of total LV myocardial volume. Transmurality was measured using the centerline chord method as previously described27. Briefly, each slice was divided into 100 equally spaced chords and the extent of the infarct along the length of each chord was measured. Mean transmurality was measured by averaging the infarct transmurality across all the chords that had at least 1% of infarct extent. Infarct size and transmurality were also determined from American Heart Association (AHA) 16-segment model (apical cap was excluded to avoid partial volume effects). The concordance between the LGE and native T1 maps for detecting infarction and transmurality on a regional basis were evaluated using the data obtained from the 16-segment analysis.
Statistical Analyses
All statistical analyses were performed using SPSS (IBM Statistics 24, New York, US). Normality of the data was tested using Shapiro-Wilk test and quantile-quantile plots. Whole-LV infarct size and transmurality measured using Mean+5SD criterion on LGE images was compared to those measured using the same criterion on native T1 maps. Paired Student’s t-test or Wilcoxon sign-rank test was used depending on the normality of the data. Infarct size measured on segmental basis was averaged for a given AHA segment across subjects for both techniques. LGE images and T1 maps were then compared for AHA segmental infarct size.
Linear regression with Bland-Altman analyses and two-way mixed consistency Intraclass Correlation Coefficent (ICC) analysis were performed to evaluate the concordance between native T1 maps and LGE for measuring whole-LV infarct size and transmurality, and also to evaluate the inter- and intra-observer agreement. The slope and intercept of the lines of best fit were tested for their equality to 1 and 0, respectively. Statistical significance for all analyses was set at p<0.05. Normal data are expressed as mean ± SD, whereas non-normal data are expressed as median with IQR.
Sensitivity and specificity for identifying the location of chronic MI using native T1 maps were determined using LGE images as the gold standard28. For this purpose, an AHA segment with an infarct size >1% by volume was considered positive for infarction, whereas an AHA segment with an infarct size <1% by volume was considered negative. This 1% cutoff was used to eliminate segments with spurious hyperintense pixels from being considered as infarcted. Sensitivity and specificity for detecting MI location based on native T1 maps were assessed for each of the 16 segments and grouped segments representing the basal, mid-ventricular and apical sections.
Receiver-operating characteristic analysis was performed to calculate the area under the curve by using the AHA segmental infarct size determined from native T1 maps as the continuous variable and the presence or absence of infarction using the 1% cutoff on LGE images as the status variable. To assess the primary source of error in detecting infarcted regions with native T1 maps, AHA segments were grouped into those positive and negative for infarction using LGE as the ground truth. Subsequently, a binary logistic regression model was used to investigate the possible factors that might result in false negatives (i.e. native T1 missing an MI compared to LGE) in MI group and false positives (i.e. native T1 falsely identifying segment as infarcted compared to LGE) in group without MI. Seven variables were included in binary logistic regression model, including 4 categorical variables: male sex, wall thining, segmental location, low T1 regions (fatty metaplasia or chronic iron deposits) and 3 continuous variables: MI size, chronicity (age of MI), and heart rate. Specifically, segmental location of MI were categorized into 3 perfusion territories (similar to the Guidelines and Standards of the American Society of Echocardiography), defined as: LAD (anterior septum, anterior wall and anterior lateral wall), LCx (inferior lateral wall) and RCA (inferior septal wall and inferior wall). For infarct location two covariates, X1 and X2, were used: X1 was labeled as 0 for LCx and 1 for RCA; and X2 was labeled as 0 for LCx and 1 for LAD.29 The other categorial variables were dichotomized and assigned value as followed: male sex (female=0, male=1), wall thining (absence=0, presence=1), low T1(absence=0, presence=1). For all categorical analysis, “0” was set as the reference. MI detection based on native T1 was set as the dichotomous dependent variable (MI segments: false negative segments assigned “1”, while true positive segments were assigned to “0”; non-MI segments: false positive segments were assigned “1”, while true negative were assigned “0”). Infarct transmurality from native T1 maps was determined as the percentage extent of the infarction along 100 equally spaced chords on each slice. Mean infarct transmurality was obtained by averaging the infarct transmurality across all the chords.
RESULTS
Patient and Imaging Characteristics
The clinical features of the patients are summarized in Table 1. 1566 image slices (LGE, T1) from 105 patients were available for images analysis. The median time after first acute MI was 10.1 years (interquartile range [IQR]: 5.3 to 16.5 years). Approximately 7% (114 of 1680 slices) of the image slices were excluded from analysis due to uninterpretable image quality on matched datasets (LGE, T1) due to obvious banding artifacts in T1 maps (4%, 64 slices) or motion artifacts in LGE (3%, 48 slices). Supplementary Material provides additional details on the diagnostic performance when none of the T1 maps are excluded from the analysis. Across all subjects, T1 of MI territory was 1621 ± 110 ms and remote territory was 1225 ± 75 ms.
TABLE 1.
Patient Data
| Characteristic | Patients (n=105, STEMI=38, NSTEMI=67) |
|---|---|
| Age, yrs | 67.5 (62–73) |
| Male, n (%) | 83 (79) |
| Risk Factors | |
| Diabetes mellitus, n (%) | 40 (38) |
| Hyperlipidemia, n (%) | 40 (38) |
| Hypertension, n (%) | 63 (60) |
| Smoking history, n (%) | 44 (42) |
| Culprit coronary artery, n(%) | 163 |
| LAD, n (%) | 69 (42) |
| LCx, n (%) | 41 (25) |
| RCA, n (%) | 50 (31) |
| LM, n (%) | 3 (2) |
| Type of treatment | |
| PCI | 46 (44) |
| CABG | 33 (31) |
| Thrombolysis | 6 (6) |
| Medical therapy | 16 (15) |
| Duration between acute MI and CMR examination, yrs | 10.1 (5.3–16.5) |
Values are mean ± SD, n (%), or median (interquartile range).
MI: myocardial infarction; STEMI: ST-elevation MI; NSTEMI: Non-ST-elevation MI; CABG: coronary artery bypass graft; CMR: cardiac magnetic resonance; LAD: left anterior descending artery; LCx: left circumflex artery; LM: left main coronary artery; PCI: percutaneous coronary intervention; and RCA: right coronary artery.
Case Examples
Figure 1 shows representative native T1 maps and corresponding LGE images acquired from three different patients with single MI in different coronary territories (LAD, LCX and RCA). In each case, visually conspicuous native T1 increases could be observed within the MI territories identified on LGE images. Semi-automatic threshold analysis using mean ±5 SD criterion showed excellent visual agreement between the native T1 mapping at 3T and LGE with respect to MI location and spatial extent. Bull’s eye plots depicting infarct size and infarct transmurality also showed good agreement between the two techniques. Figure 2 shows representative contiguous native T1 maps and corresponding LGE images from a patient with an LAD MI. These images show the capacity of native T1 maps at 3T to accurately identify infarct location throughout the heart in much the same way LGE can.
Figure 1. Representative Native T1 Maps and Late Gadolinium Enhancement Images Acquired From Patients with LAD, LCx and RCA Infarctions at 3.0T.
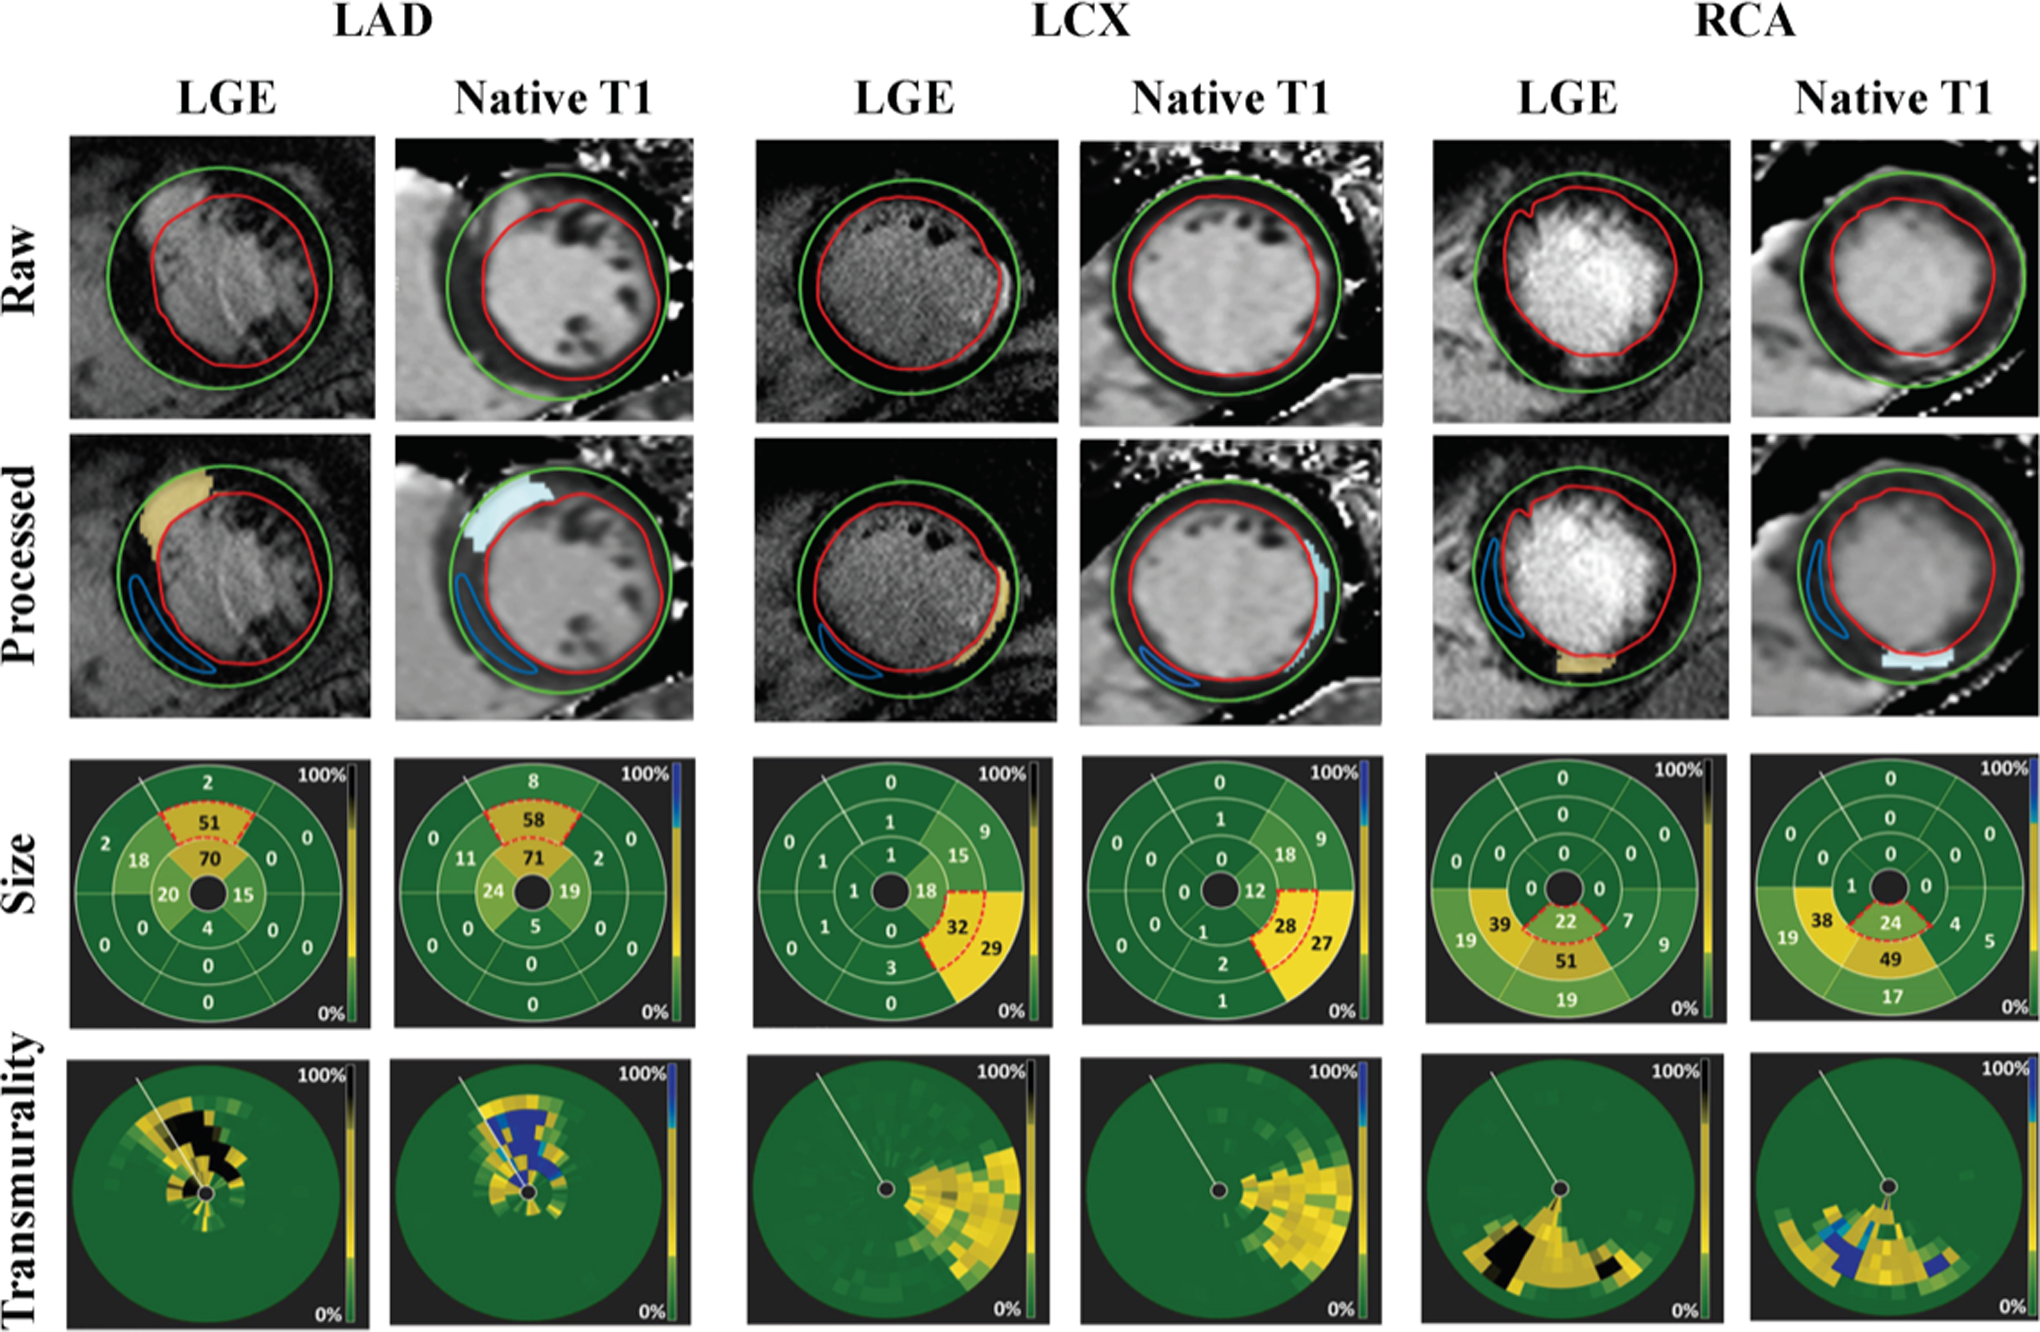
Late gadolinium enhancement (LGE) images and native T1 maps of three patients, each with infarctions in the LAD, LCx and RCA coronary territories. Infarcted areas were identified on both LGE images (yellow highlights) and T1 maps (pale blue highlights) using the mean±5 SD criterion. Infarct size was computed on a per-segment basis for each of the 16 segments of the AHA model (presented here as bulls-eye plots). Infarct transmurality was measured as the extent of the infarction along each chord and accordingly color-coded (also shown as the bull-eye plots). Each concentric ring of the transmurality bulls-eye plots represents a short-axis slice. Note that the Bulls-eye plots show a close concordance between LGE and native T1 maps for ascertaining infarct size and infarct transmurality.
Figure 2. Representative Contiguous Multi-Slice Native T1 Maps with Corresponding LGE in a Patient with LAD MI.
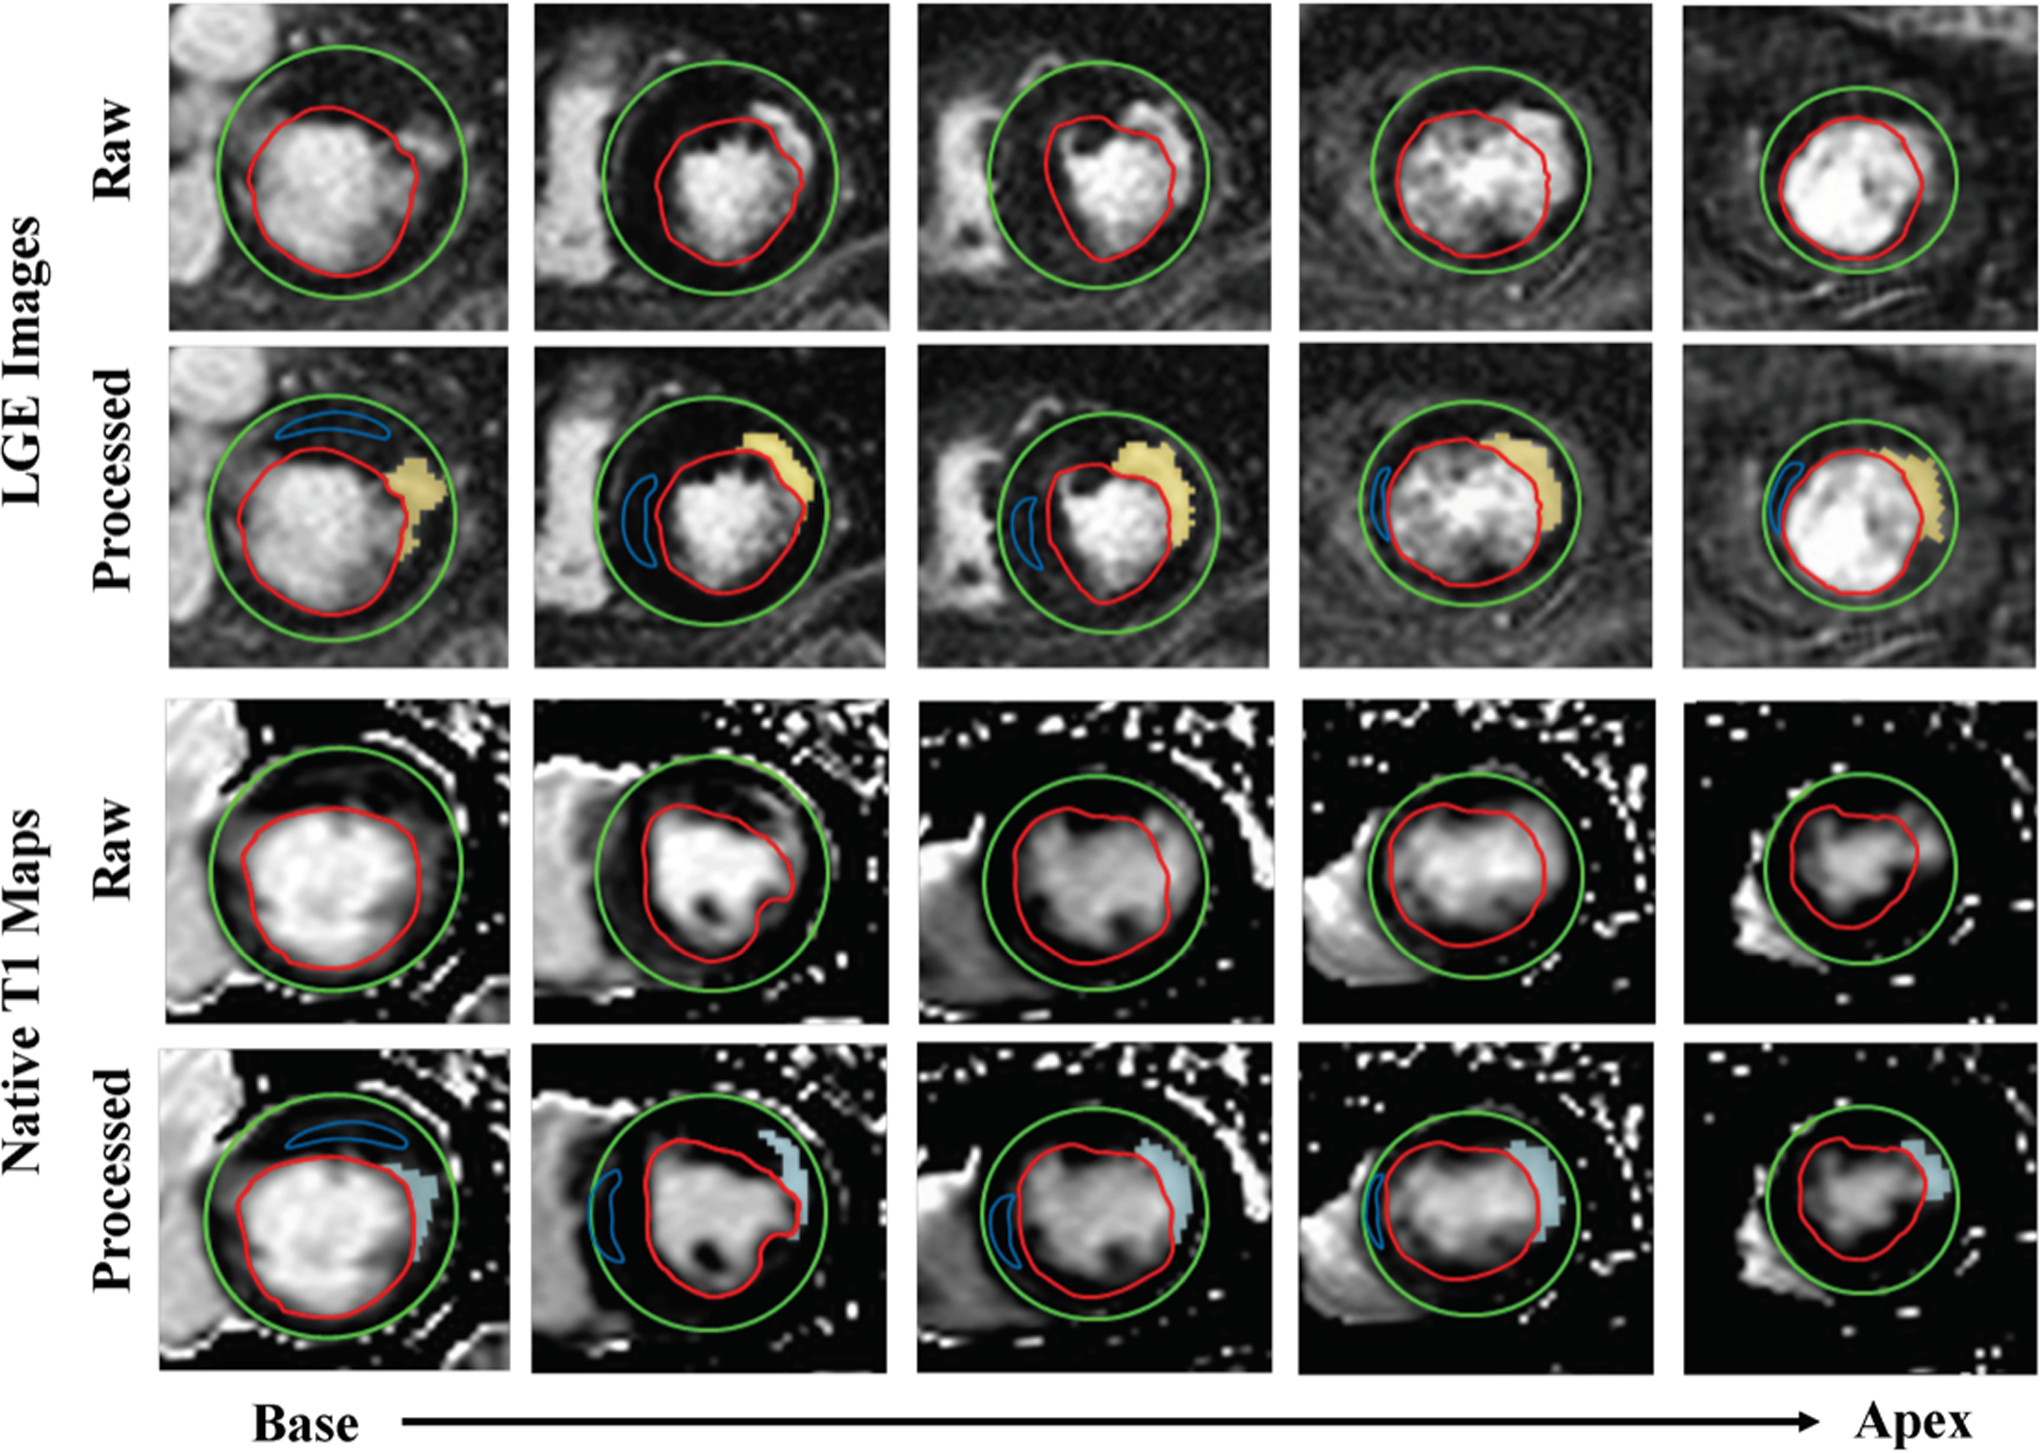
The infarct territories were readily visualized on native T1 maps and corresponded to the infarcted regions identified from LGE. Mean+5 SD thresholding showed visually comparable infarct size and infarct transmurality on native T1 maps (pale blue highlights) and LGE (yellow highlights).
Infarct Location
Accuracy -
Sensitivity, specificity and ROC analyses of native T1 mapping for identifying infarct location is shown in Figure 3. Sensitivity of native T1 maps for detecting infarct location on a segmental basis was 88% (621 of 702 true positive, 95% confidence interval [CI]: 86% to 91%,). Specificity of native T1 maps for detecting infarct location on a segmental basis was 92% (899 of 978 true negative, 95% confidence interval [CI]: 90% to 94%). (Figure 3A). Positive predictive value of the native T1 maps for detecting infarct location on a segmental basis was 89% (621 true positives out of 700, 95% confidence interval [CI]: 86% to 91%,). Negative predictive value of the native T1 maps for detecting infarct location on a segmental basis was 92% (899 true negative of 980 test negative, 95% confidence interval [CI]: 90% to 93%,). ROC analysis showed that the area-under-the-curve (AUC) for identifying infarct location from native T1 mapping to be 0.93 ([CI]:0.91–0.94, p<0.001). (Figure 3C).
Figure 3. Infarct Location Determined Using Native T1 Maps: Sensitivity, Specificity, Positive Predictive Value (PPV), Negative Predictive Value (NPV) and Receiver Operating Characteristic Analysis.
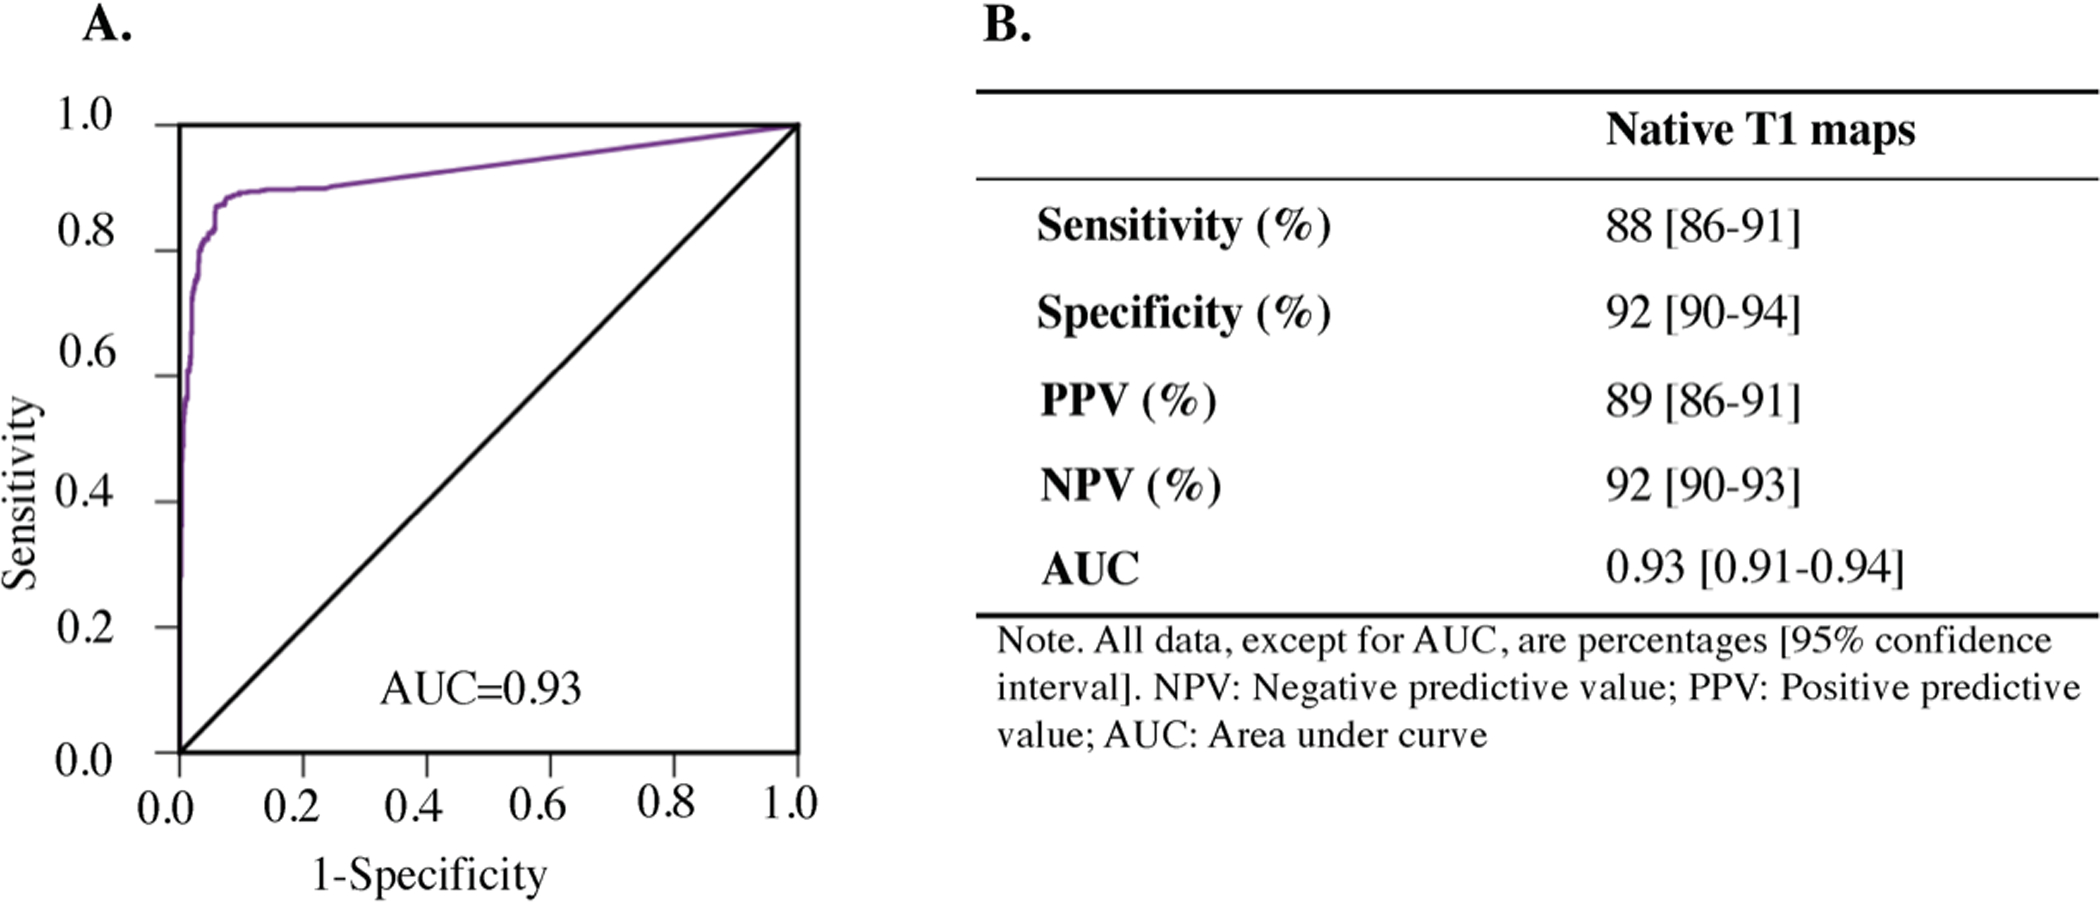
Receiver-operating characteristic (ROC) analysis (Panel A) showed excellent diagnostic performance of native T1 maps for detecting chronic MI location as well as high diagnostic sensitivity and specificity, high positive predictive value and high negative predictive value (Panel B). AUC= area under the curve. PPV= Positive Predictive Value, and NPV=Negative Predictive Value.
A more refined analysis of the sensitivity and specificity of native T1 for identifying infarct location, performed using the AHA segmental model provided additional insights, with sensitivity ranging between 0.83 (basal segments) to 0.94 (mid-ventricular/apical segments) and specificity ranging between 0.69 (apical segments) to 0.94 (mid-ventricular segments). While the overall sensitivity and specificity for infarct detection was high, a more granualar analysis revealed that the infarcts in the LCx territory were detected with lower sensitivity and the apical segments were detected with lower specificity than other segments. Additional details are provided in Table 2.
Table 2.
Regional Sensitivity and Specificity of Native T1 Maps for MI Detection Based on AHA 16 segment Model
| AHA Segmentation Region or Number |
Sensitivity | 95% C.I. | Specificity | 95% C.I. |
|---|---|---|---|---|
| Basal | 0.83 | 0.75–0.89 | 0.94 | 0.92–0.96 |
| 1 | 0.81 | 0.59–0.93 | 0.93 | 0.84–0.98 |
| 2 | 0.99 | 0.90–1.00 | 0.92 | 0.82–0.97 |
| 3 | 0.98 | 0.78–0.99 | 0.81 | 0.71–0.89 |
| 4 | 0.56 | 0.19–0.81 | 0.98 | 0.96–0.99 |
| 5 | 0.67 | 0.38–0.88 | 0.99 | 0.96–1.00 |
| 6 | 0.75 | 0.51–0.91 | 0.99 | 0.95–1.00 |
| Mid | 0.94 | 0.90–0.97 | 0.86 | 0.81–0.89 |
| 7 | 0.67 | 0.38–0.88 | 0.98 | 0.95–0.99 |
| 8 | 0.99 | 0.96–1.00 | 0.99 | 0.83–1.00 |
| 9 | 0.99 | 0.94–1.00 | 0.86 | 0.70–0.95 |
| 10 | 0.67 | 0.38–0.88 | 0.69 | 0.57–0.79 |
| 11 | 0.67 | 0.38–0.88 | 0.88 | 0.78–0.94 |
| 12 | 0.59 | 0.18–0.81 | 0.97 | 0.96–0.99 |
| Apical | 0.94 | 0.91–0.97 | 0.69 | 0.60–0.78 |
| 13 | 0.94 | 0.87–0.98 | 0.51 | 0.19–0.81 |
| 14 | 0.99 | 0.95–1.00 | 0.62 | 0.39–0.79 |
| 15 | 0.81 | 0.59–0.93 | 0.79 | 0.67–0.87 |
| 16 | 0.94 | 0.87–0.98 | 0.53 | 0.19–0.81 |
Infarct Size
Mean Infarct Size:
Average infarct size measured by the two readers using LGE and native T1 maps were not different (T1: 12.1%±7.5% vs. LGE: 11.8 %±7.2%; p = 0.82), were highly correlated (R2 = 0.92; slope = 1.01, p<0.001; intercept = 0.21%, p = 0.57), and showed minimal bias (0.09 ± 2.6%) with limits of agreement (LOA) = ±5.2%. See Figure 4. Intraclass Correaltion Coefficient (ICC) was 0.953 (95% confidence interval [CI]:0.926 to 0.971).
Figure 4. Infarct Size: Native T1 Maps Vs. LGE.
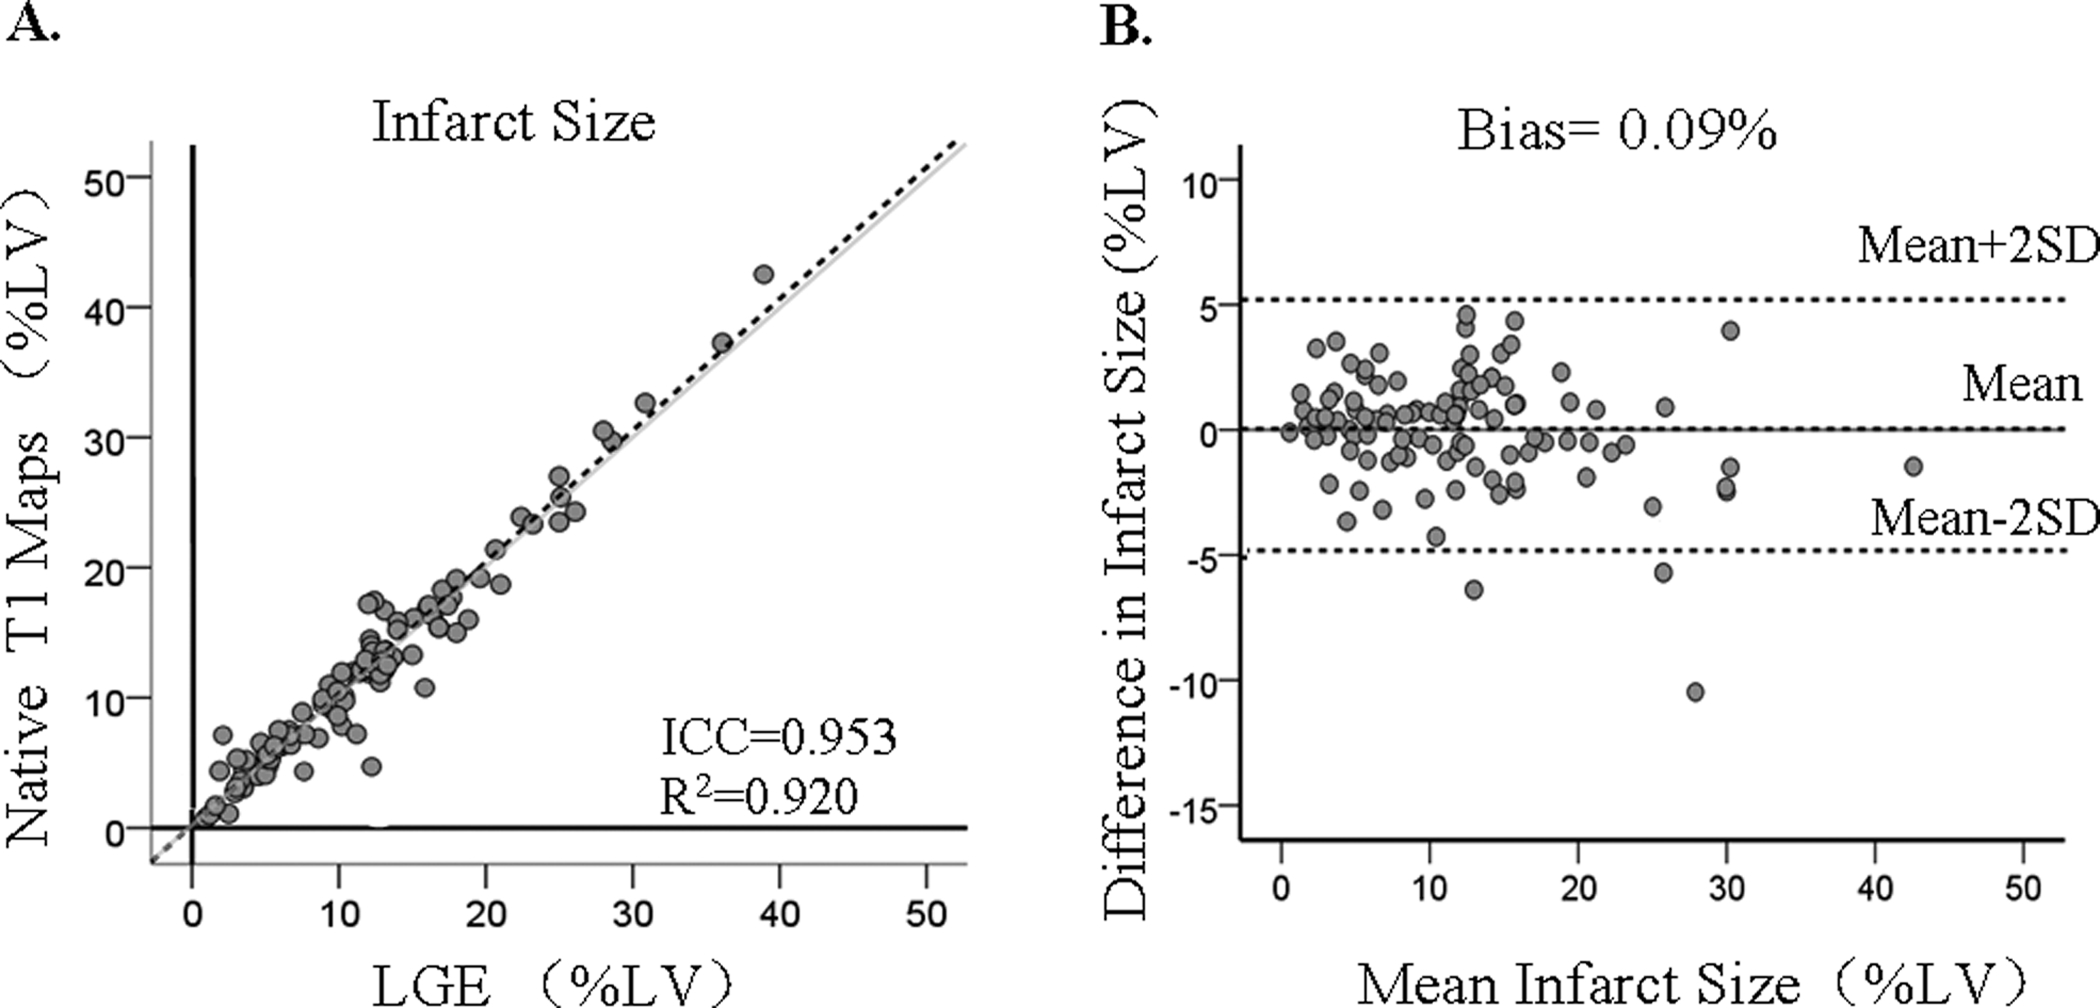
Infarct size determined based on native T1 maps and LGE showed excellent correlation and minimal bias. Each data point represents the mean infarct size determined from independent measurements made by the two readers. The grayline shows the line of identity.
Inter-observer Variability -
There were no significant differences between the two observers’ measurements with respect to infarct size measured from native T1 maps (Observer 1: 11.9 ±7.4% vs. Observer 2: 12.1%±7.5%; p=0.356) and LGE images (Observer 1: 11.8 ±8.0 % vs. Observer 2: 11.8 %±7.2%; p=0.72). Linear regression analysis performed between each of the observer’s measurements of infarct size on native T1 maps and LGE showed excellent agreement (native T1: R2 = 0.90; slope = 0.93, p<0.001; intercept = 0.58%, p = 0.19; ICC= 0.927, 95% confidence interval [CI]:0.902 to 0.943, and LGE: R2 = 0.91; slope = 1.06, p<0.001; intercept = 0.6%, p = 0.20; ICC= 0.946, 95% confidence interval [CI]:0.915 to 0.966). Bland-Altman analysis showed that there was negligible bias in the observers’ measurements with both techniques (native T1: bias = −0.18 ± 2.4% and LOA = ±4.8%; and LGE: bias = 0.19 ± 2.4%; LOA = ±4.8%). See Figure 5 (A–D).
Figure 5. Interobserver Variability and Intraobserver Variability in Infarct Size: Native T1 Maps Vs. LGE.
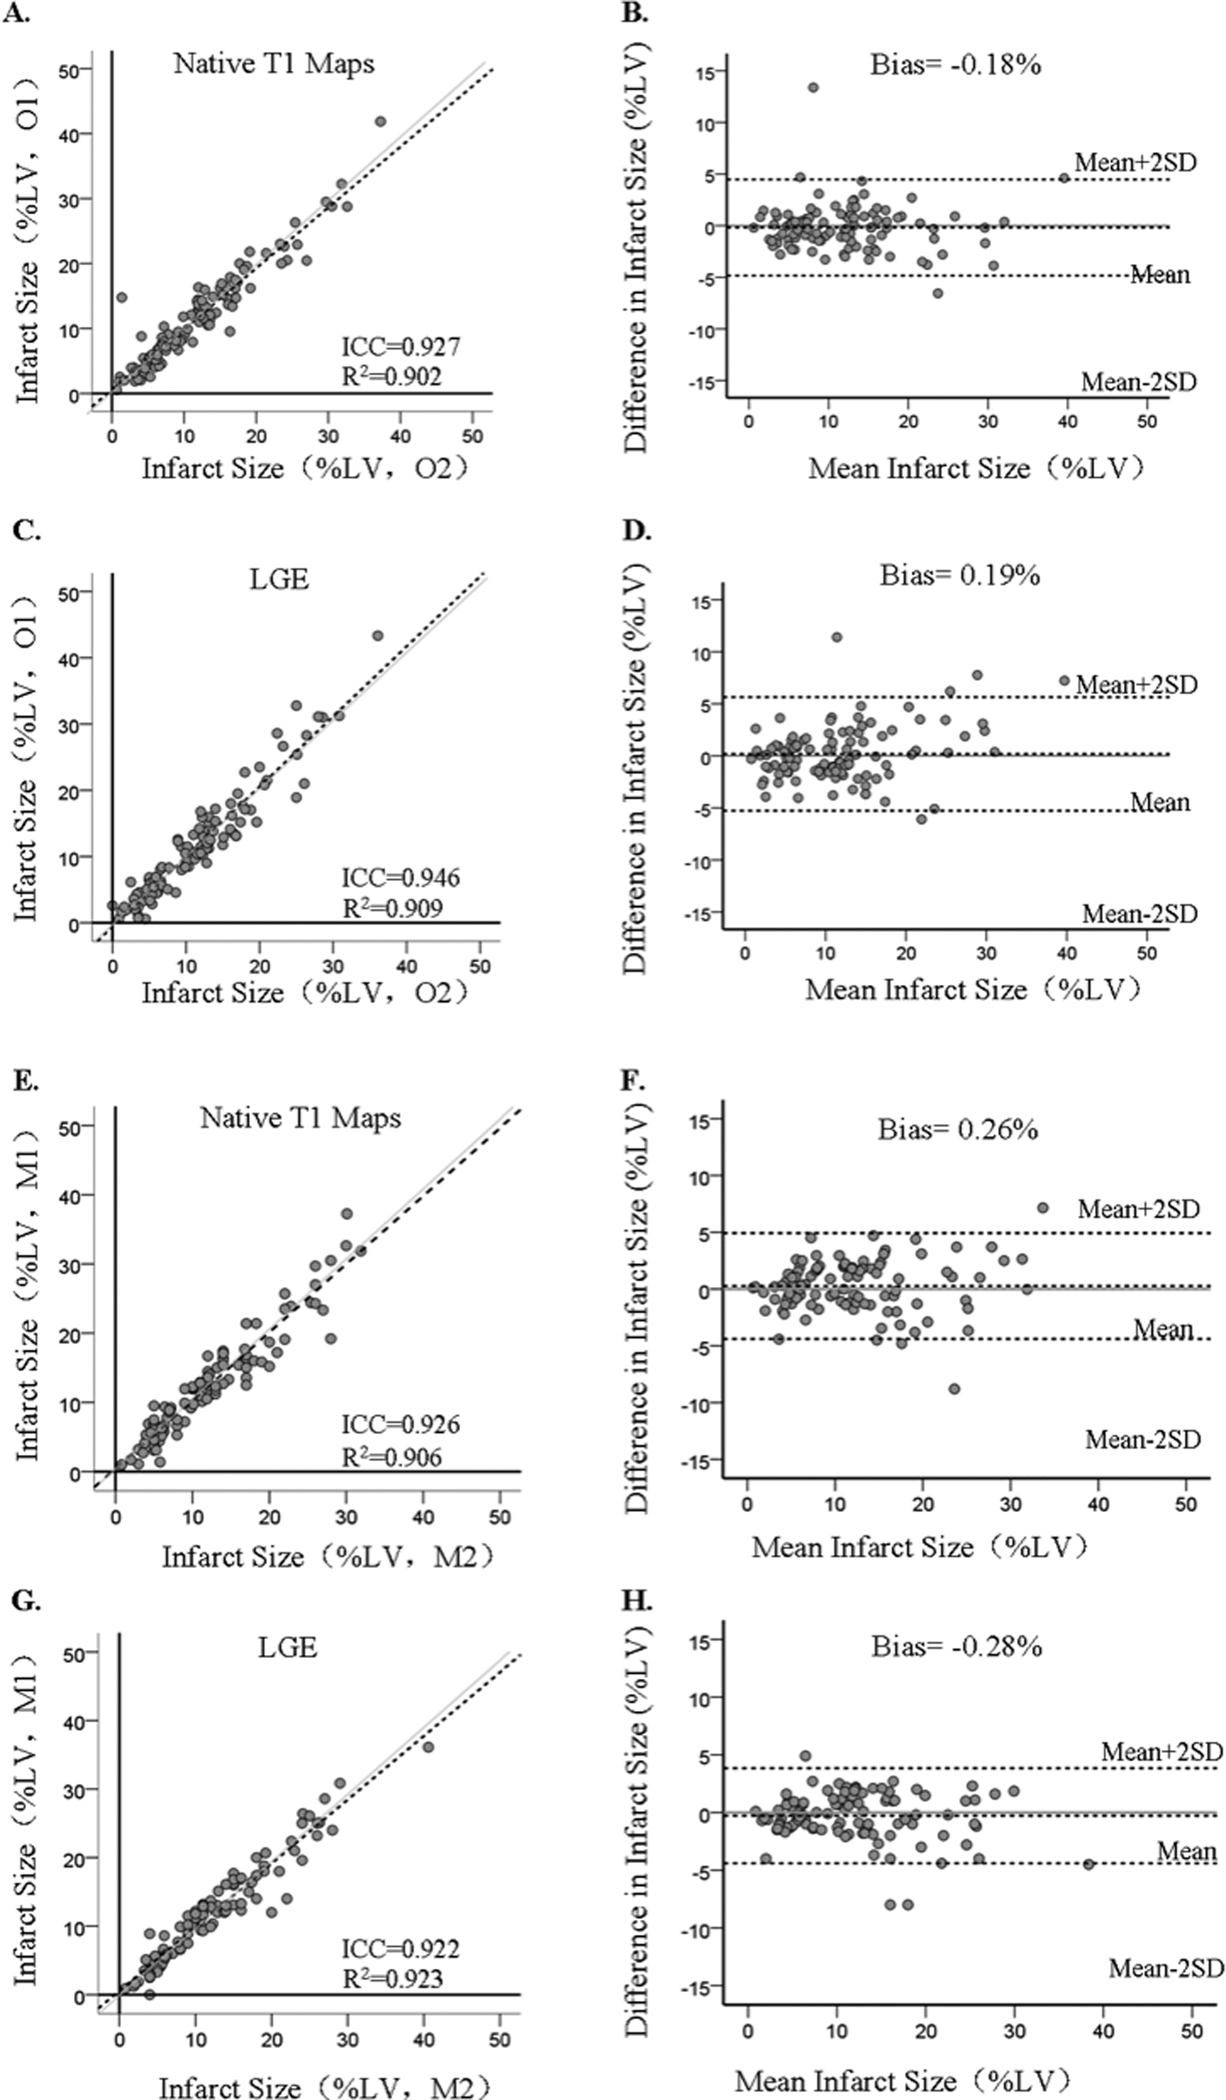
Variabilities for Determining Infarct Size Based on LGE and Native T1 Mapping. Interobserver Variability (Panels A- D): Linear regression and bland-Altman analyses showed good agreement in infarct size determined by Observers 1 and 2 (denoted as O1 and O2, respectively) from native T1 maps (panels A and B) and LGE images (Panels C and D. Intraobserver Variability: Infarct size determined by observer 2 at two different time points (at least a month apart) were highly correlated and showed minimal bias when assessed using native T1 maps (panels E and F) and LGE images (Panels G and H). M1 and M2 refer to first and second measurements performed by one observer to assess intraobserver variability in measuring infarct size. The grayline shows the line of identity.
Intra-observer Variability -
Repeat estimation of infarct size determined at least a month apart from native T1 maps were not different (first measurement (M1): 12.1 ± 7.5% vs. second measurement (M2): 11.9%±7.3%; p=0.25). This was consistent with findings from LGE (M1: 11.8 ± 7.2% vs. M2: 12.1 % ± 7.4%; p=0.16). The agreement between the observer’s repeat measurements using native T1 maps and LGE were also excellent: linear regression (Native T1, R2 = 0.91; slope = 0.98, p<0.001; intercept = 0.46%, p = 0.30; ICC= 0.926, 95% confidence interval [CI]:0.896 to 0.944; and LGE - R2 = 0.92; slope = 0.93, p<0.001; intercept = 0.57%, p = 0.13; ICC= 0.922, 95% confidence interval [CI]:0.894 to 0.939). Similarly, there was negligible bias in the observers’ repeat measurements (Native T1, bias = 0.26 ± 2.3%, LOA = ±4.6%; LGE - bias = −0.28 ± 2.1%; and LOA = ±4.2%). See Figure 5 (E–H).
Infarct Transmurality
Mean Infarct Transmurality:
Average infarct transmurality measured by the two readers using LGE and native T1 maps were not different (Native T1: 49.1 ± 15.8% vs. LGE: 47.2 ± 19.0%, p = 0.56) and showed good agreement (R2 = 0.71; slope = 0.70, p<0.001; intercept = 16.01%, p < 0.001; and bias of 1.32 ± 10.2%, LOA = ±20.4%). See Figure 6. ICC was 0.902 (95% confidence interval [CI]:0.847 to 0.943).
Figure 6. Infarct Transmurality: Native T1 Maps Vs. LGE.

Infarct transmurality determined based on native T1 maps and LGE showed good correlation and mild bias. Each data point represents the mean infarct transmurality determined from independent measurements made by the two readers. The grayline shows the line of identity.
Interobserver Variability:
There were no significant differences between the two observers’ measurements with respect to infarct transmurality measured from native T1 maps(Observer 1: 48.9 ± 14.8% vs. Observer 2: 49.2 ± 16.1%; p=0.29) and LGE images (Observer 1: 46.0 ± 19.0% vs. Observer 2: 49.0 ± 16.1%; p=0.33). Linear regression analysis performed between each of the observer’s measurements of infarct transmurality on native T1 maps and LGE showed very good agreement (native T1: R2 = 0.68; slope = 0.81, p<0.001; intercept = 9.35%, p<0.001; ICC= 0.876, 95% confidence interval [CI]:0.809 to 0.921; and LGE: R2 = 0.73; slope = 1.01, p<0.001; intercept = 2.35%, p = 0.45; ICC= 0.892, 95% confidence interval [CI]:0.818 to 0.938). Similarly, there was negligible bias in the observers’ repeat measurements (Native T1: bias = −0.01 ± 9.4%, LOA = ±18.4%; and LGE: bias = 1.79 ± 9.7%, LOA = ±19.4%). See Figure 7 (A–D).
Figure 7. Interobserver Variability and Intraobserver Variability in Infarct Trasnmurality: Native T1 Maps Vs. LGE. Variabilities for Determining Infarct Transmurality Based on LGE and Native T1 Mapping.

Interobserver Variability (Panels A- D): Linear regression and bland-Altman analyses showed good agreement in infarct transmurality determined by the two observers (denoted by O1 and O2, respectively) from native T1 maps (panels A and B) and LGE images (Panels C and D). Intraobserver Variability: Infarct transmurality determined by observer 2 at two different time points (at least a month apart) were highly correlated and showed minimal bias when assessed using native T1 maps (panels E and F) and LGE images (Panels G and H). M1 and M2 refer to the first and second measurements performed by one observer to enable the assessment of intraobserver variability in measuring infarct transmurality. The grayline shows the line of identity.
Intra-observer Variability:
Repeat measurement of infarct transmurality performed at least a month apart from native T1 maps were not different (M1: 49.2 ± 16.1% vs. M2: 49.3 ± 14.8%; p=0.46). This was consistent with findings from LGE (M1: 49.2 ± 16.1% vs. M2: 48.7 ± 14.5%; p=0.56). The agreement between the observer’s repeat measurements using LGE and native T1 were also very good: linear regression (native T1, R2 = 0.81; slope = 0.98, p<0.001; intercept = 0.80%, p = 0.74; ICC= 0.909, 95% confidence interval [CI]:0.857 to 0.943; and LGE, R2= 0.85; slope = 1.02, p<0.001; intercept = 0.63%, p = 0.77; ICC= 0.916, 95% confidence interval [CI]:0.868 to 0.947). Similarly, there was negligible bias in the observers’ repeat measurements (native T1: −0.12 ± 7.0% (LOA = ±14.0%); and LGE: 0.31 ± 6.2% (LOA = ±12.4%)). See Figure 7 (E–H).
Detection Limits of Native T1 Maps
While the detection sensitivity and specificity for MI detection based on native T1 maps was high, it was not a perfect match with LGE. Specifically, based on LGE as the ground truth there were 81 false negative and 79 false positive segments in T1 maps. Further analysis based on logistic regression showed that the dominant factor limiting MI detection with native T1 maps compared to LGE was infarct location; and size of MI, wall thining and heart rate were mild confounders. Specifically the incremental size of MI as % LV (Odds Ratio, OR=0.822 per every 1% increase in MI size, p=0.017) and presence of wall thining (OR=0.082, p=0.014) were influence factors that contributed to the lower risk of false negatives. For the categorical variable Infarct location with three categories LCx, RCA, and LAD, we found that LAD (15 segments, including anterior septal, anterior wall and anterior lateral, OR=0.037, p=0.015) and RCA (27 segments, including inferior septal and inferior wall, OR=0.053, p=0.034) were influence factors that contributed to the lower risk of false negatives relative to LCx (inferior lateral, 39 segments) for false negatives. Within the false positive group, only infarct location and heart rate were significant factors. Specifically, LAD (17 segments, including anterior septal, anterior wall and anterior lateral, OR=0.005, p=0.042) was a influence factors contributing lower risk of false positives relative to LCx (inferior lateral, 33 segments) and heart-rate was a influence factor that contributed higher risk of false positives (OR=1.166 per every one beat per minute increase, p=0.045). Additional details are provided in Table 3.
Table 3.
Factors Contributing to the Detection Limits Native T1 Maps
| Factor | False Negative(81 segments) | False Positive(79 segments) | ||||
|---|---|---|---|---|---|---|
| p-value | OR | 95% C.I. for OR | p-value | OR | 95% C.I. for OR | |
| Sex (male) | 0.227 | 0.300 | 0.043 – 2.116 | 0.451 | 0.278 | 0.010 – 7.764 |
| MI Size (%LV) | 0.017 | 0.822 | 0.699 – 0.966 | 0.099 | 1.260 | 0.958 – 1.658 |
| Chronicity (Yrs) | 0.662 | 0.962 | 0.915 – 1.181 | 0.078 | 1.412 | 0.962 – 2.074 |
| Wall Thining | 0.014 | 0.082 | 0.011 – 0.599 | 0.795 | 1.424 | 0.099 – 20.540 |
| Infarct Location | ||||||
| RCA vs. LCx | 0.034 | 0.053 | 0.004 – 0.796 | 0.313 | 0.142 | 0.003 – 6.266 |
| LAD vs. LCx | 0.015 | 0.037 | 0.003 – 0.521 | 0.042 | 0.005 | 0.000 – 0.828 |
| Low T1 (Fat/Iron) | 0.942 | 1.092 | 0.103 – 11.546 | 0.894 | 1.273 | 0.041 – 39.451 |
| Heart rate (bpm) | 0.690 | 1.015 | 0.944 – 1.019 | 0.045 | 1.166 | 1.003 – 1.356 |
OR: Odds ratio
Categorical variables: Male sex (female=0, male=1), Wall Thinning (absence=0, presence=1), Reference category=0. For Infarct Location, two covariates were used: first – LCx (inferior lateral wall)=0, RCA (inferior septal and inferior wall) =1; and second – LCx (inferior lateral wall)=0, LAD (anterior septum, anterior wall and anterior lateral wall)=1, Low T1(absence=0, presence=1); and Continuous variables: MI size (%LV), Chronicity (age of the infarct, years), Heart rate (bpm or beats per minute).
DISCUSSION
Based on previous reports demonstrating the feasibility of native T1 mapping at 3T for detecting and characterizing chronic myocardial infarctions, we evaluated the diagnostic capacity of the approach in a multi-center setting. We found that native T1 maps acquired at different CMR centers can identify infarct location and infarct size with accuracy that is comparable to LGE CMR. In comparison, while the detection of infarct transmurality from native T1 maps was not as strong as assessments of size and location, it also showed reasonable accuracy when compared to LGE CMR. Importantly, our findings in a larger population than previously studied provide multicenter evidence that native T1 mapping at 3T is a viable alternative to LGE for detecting and characterizing chronic MI without the need for contrast agents.
While the findings from this study are compelling, there are multiple opportunities for further refinement. First, we observed that specific characterisitics of MI (location, size and wall thickness) and heart rate are confounders of detection of MI with native T1 maps; with the MI location, specifically LCx territory, being the the dominant factor. The confounding effects of MI in the LCx territory is likely associated with the off-resonance affects, which are most commonly observed in this territory when bSSFP readouts are employed at 3T (as is the case with MOLLI T1 maps). Technical improvements which overcome these off-resonance artifacts are expected to improve this limitation. We also observed a reduced specificity for detecting MI in the apical segments compared to LGE, which may partly be related to the lower in-plane resolution of native T1 maps (1.5 × 1.5 mm2) compared to LGE (1.2 × 1.2 mm2). Capacity to match the higher spatial resolution and augmentation of the endogenous image contrast in native T1 maps through futher technical advancements are likely to overcome the dectection limitations ascribable to infarct size and wall thickness, which stem from partial volume effects. The confounding effects of heart rate towards sensitivity is likely related to well-known dependence of MOLLI T1 maps on heart rate30. Although we minimized the influence of heart-rate influence using mean+5SD thresholding approach (rather than identifying MI territories on the basis of specific T1 cutoffs across all subjects), T1 maps generated with no depdendence on heart rate differences between subjects could provide additional opportunities. If achieved, this may also enable the identification of infarct zones on the basis of absolute T1 cutoffs across subjects and enable the defintion of scar border, which has been implicated in arrhythmogenesis in the post MI setting31. Second, we allowed the readers to manually window the images to visually ascertain infarct location; however, this step can be streamlined through machine learning approaches to objectively window the native T1 images as they are displayed on the scanner consoles. Alternatively, or in addition, pulse sequence optimization schemes can also be applied to suppress the remote myocardium to enhance the visual conspicuity of the infarct zone. This could be particularly advantageous over standard 3D LGE acquisition since high-resolution non-contrast 3D images can be captured without the modulation in image contrast during the acquisition period since the image contrast is endogenous and is not time dependent. Moreover, given the myriad of opportunities for accelerated imaging and motion-correction strategies, the proposed approach can be coupled with ungated acquisition schemes to improve workflow. Additionally, the bSSFP readout of MOLLI T1 maps and spoiled-gradient-echo readouts used for LGE, lead to signal loss at the epicardial boundaries as a consequence of phase cancellation between fat and water signal in the native T1 maps. Hence, methods that could improve the signal profile at the interface of the epicardial border while preserving the image contrast for identifying replacement scar in chronic MI may help to increase the sensitivity for detecting transmural infarctions. Finally, the contrast mechanism permitting the detection of chronic MI based on MOLLI T1 maps has been previously proposed19. Current understanding posits that the image contrast in MOLLI T1 maps is derived from differences in spin diffusivity and magnetization transfer effects between the remote and infarct zones. However, systematic investigations into biophysical factors enabling MOLLI T1 maps to generate image contrast, allowing for the detection of chronic MI are needed -- an improved understanding can guide technical developments to overcome the remaining accuracy limitations of MOLLI T1 maps in detecting chronic MI relative to LGE.
Accurate detection and sizing of myocardial scar has almost universally been associated with increased risk of adverse outcome across a wide variety of cardiac conditions32,33. In this study we demonstrated the capacity of native T1 mapping at 3T to identify focal myocardial scar that is secondary to myocardial infarction. Based on our findings, we anticipate that the same approach can be expanded to detect focal non-vascular myocardial scar independent of etiology, including mid-ventricular fibrosis observed in hypertensive cardiomyopathies. However, the proposed approach and analysis may not be effective in identifying non-focal (diffuse) fibrosis without further improvement in native image contrast. This remains to be investigated in future studies.
Clinical Implications
Our findings open several new opportunities for CMR. First, given that native T1 mapping at 3T is excellent for determining infarct size and infarct location and good for infarct transmurality, it would be of particular importance in patients with contraindications to gadolinium-based contrast media or who have reluctance to be injected with a contrast agent that remains in the body. Second, the capability to assess the presence of prior MIs without contrast agents facilitates assessment of prior MI in the early part of a CMR exams, rather than having to wait for LGE scans, which are typically performed at the terminal part of the exam. This can provide critical information that will allow for scan protocol to be adjusted, which may shorten the overall CMR exam time. Third, at least some key aspects of CMR exam (cine, infarct detection, and viability) can be performed with minimal patient preparation (e.g., no venous cannulation) and at lower cost. Fourth, CMR work flow can be optimized to improve efficiency given there would be no need to wait for late-gadolinium enhancement or repeated scouting to identify optimal inversion times prior to acquiring data. Finally, given the growing advances in non-contrast-enhanced CMR approaches for ascertaining myocardial perfusion, together with native T1 mapping, a path may be forged for CMR to evaluate the key parameters of ischemic heart disease (perfusion and viability) without contrast agents.
One limitation of the proposed approach for characterizing chronic MI is acute tissue injury resulting in edema which can also lead to significant elevations in native T1. To overcome this, it woud be necessary to perform native T2 acquisitions along with T1 mapping to rule out ongoing acute injury similar to how LGE is used with native T2 to discriminate between acute and chronic MI.
Study Limitations
Since the patient population consisted only of subjects with evidence of prior MI by LGE, the capability of the native T1 mapping approach to detect scar in non-ischemic cardiac pathology could not be assessed. While further studies are needed to address this limitation, we anticipate that signal thresholding approach we employed here should be able to identify mid-wall or subepicardial scars from non-ischmic etiologies. Further, the current study only utilized Siemens scanners, hence additional investigations are needed to ascertain the performance of the native T1 mapping approach in other CMR platforms. In addition, nearly 7% of the imaging slices were excluded from the analysis due to image quality issues with both LGE and T1 maps (poor breath-holds limiting the imaging quality in LGE images (3%); banding artifacts in native T1 maps (4%)). Further improvements in cardiac shimming or reduction in TR to minimize banding artifacts in balanced SSFP readouts would provide opportunities to improve image quality. Finally, the current approach requires a 3T scanner, while currently 1.5 T scanners are most commonly used for CMR. Approaches that can be sensitized to generate image contrast for identifying scar regions, such as those that employ magnetization transfer34 or spin-locking at 1.5T35 which are under development, may provide an option for scar imaging without contrast agents at 1.5T. Finally, while the proposed approach is expected be generalizable to MI patients in whom contrast exams cannot be performed, the true validation of whether LGE and native T1 mapping at 3T provide equivalent information in patients contraindicated for contrast was not assessed. This is expected to be a broader limitation for any non-contrast-enhanced CMR method aiming to be validated against LGE since contrast agent is required to perform LGE.
CONCLUSION
Native T1 mapping can accurately characterize chronic MI and as such, it is a viable alternative for scar imaging in chronic MI patients who are contraindicated for LGE. Technical advancements may be needed to overcome the imaging confounders that currently limit native T1 mapping from reaching detection levels equivalent to LGE.
Supplementary Material
Clinical Perspective.
Late Gadolinium Enhancement Cardiac Magnetic Resonance imaging (LGE CMR) is the current clinical standard for accurate characterization of myocardial infarction. However, its utility is primarily diminished by the observation that in patients with chronic kidney disease in whom gadolinium infusions can trigger nephrogenic systemic fibrosis. This limitation has put the imaging community at high alert, currently requiring every patient identified for LGE CMR to be first assessed for renal sufficiency. It is estimated that ~20% of the myocardial infarction patients are currently contraindicated for LGE CMR due to poor renal function. To date, large animal and patient studies from a single-center have shown that chronic myocardial infarction can be accurately detected and characterized from CMR without gadolinium-based contrast agents using native T1 maps at 3T. In this work, we evaluated the capacity of native T1 mapping at 3T in a multi-center setting as a contrast-agent-free alternative to LGE CMR for assessment of chronic myocardial infarctions. Our findings demonstrate the native T1 mapping at 3T performs as well as LGE CMR. Thus, this work is a key step towards the use of native T1 mapping at 3T as a reliable alternative to LGE CMR for characterization of patients with chronic infarct-related scar.
SOURCES OF FUNDING
This work was supported in part by NIH R01 HL136578 to Dr. Dharmakumar; in part by the National Research Foundation (NRF) of Korea (Grant No. 2012027176) to Dr. Hyuk-Jae Chang; and in part by The National Natural Science Foundation of China (Grant No.81801661) to Dr. Guan Wang.
LIST OF ABBREVIATIONS
- AUC
Area Under Curve
- CMR
Cardiac Magnetic Resonance
- CKD
Chronic Kidney Disease
- HF
Heart Faluir
- LAD
Left Anterior Descending Artery
- LCx
Left Circumflex Artery
- LGE
Late Gadolinium Enhancement
- MI
Myocardial Infarction
- NSTEMI
Non-ST elevelation MI
- RCA
Right Coronary Artery
- ROC
Receiver Operating Characteristics
- STEMI
ST-elevation MI
Footnotes
DISCLOSURES
None.
REFERENCES
- 1.Yancy CW, Jessup M, Bozkurt B, Butler J, Casey DE Jr, Drazner MH, Fonarow GC, Geraci SA, Horwich T, Januzzi JL, et al. 2013 accf/aha guideline for the management of heart failure: Executive summary: A report of the american college of cardiology foundation/american heart association task force on practice guidelines. Circulation. 2013;128:1810–1852. doi: 10.1161/CIR.0b013e31829e8807. [DOI] [PubMed] [Google Scholar]
- 2.Go AS, Mozaffarian D, Roger VL, Benjamin EJ, Berry JD, Borden WB, Bravata DM, Dai S, Ford ES, Fox CS, et al. Heart disease and stroke statistics--2013 update: A report from the American Heart Association. Circulation. 2013;127:e6–e245. doi: 10.1161/CIR.0b013e31828124ad. [DOI] [PMC free article] [PubMed] [Google Scholar]
- 3.Roger VL, Weston SA, Redfield MM, Hellermann-Homan JP, Killian J, Yawn BP, Jacobsen SJ. Trends in heart failure incidence and survival in a community-based population. JAMA. 2004;292:344–350. [DOI] [PubMed] [Google Scholar]
- 4.Virani SS, Alonso A, Benjamin EJ, Bittencourt MS, Callaway CW, Carson AP, Chamberlain AM, Chang AR, Cheng S, Delling FN, et al. Heart Disease and Stroke Statistics-2020 Update: A Report From the American Heart Association. Circulation. 2020. doi: 10.1161/CIR.0000000000000757. [DOI] [PubMed] [Google Scholar]
- 5.Zannad F, Briancon S, Juilliere Y, Mertes PM, Villemot JP, Alla F, Virion JM. Incidence, clinical and etiologic features, and outcomes of advanced chronic heart failure: The epical study. Epidemiologie de l’insuffisance cardiaque avancee en lorraine. J Am Coll Cardiol.. 1999;33:734–742 [DOI] [PubMed] [Google Scholar]
- 6.WRITING COMMITTEE MEMBERS, Yancy CW, Jessup M, Bozkurt B, Butler J, Casey DE Jr, Drazner MH, Fonarow GC, Geraci SA, Horwich T, et al. 2013 accf/aha guideline for the management of heart failure: A report of the american college of cardiology foundation/american heart association task force on practice guidelines. Circulation. 2013;128:e240–327. doi: 10.1161/CIR.0b013e31829e8776. [DOI] [PubMed] [Google Scholar]
- 7.Hunt SA, Abraham WT, Chin MH, Feldman AM, Francis GS, Ganiats TG, Jessup M, Konstam MA, Mancini DM, Michl K, et al. ACC/AHA 2005 guideline update for the diagnosis and management of chronic heart failure in the adult: A report of the american college of cardiology/american heart association task force on practice guidelines (writing committee to update the 2001 guidelines for the evaluation and management of heart failure): Developed in collaboration with the american college of chest physicians and the international society for heart and lung transplantation: Endorsed by the heart rhythm society. Circulation. 2005;112:e154–235 [DOI] [PubMed] [Google Scholar]
- 8.Malliaras K, Smith RR, Kanazawa H, Yee K, Seinfeld J, Tseliou E, Dawkins JF, Kreke M, Cheng K, Luthringer D, et al. Validation of contrast-enhanced magnetic resonance imaging to monitor regenerative efficacy after cell therapy in a porcine model of convalescent myocardial infarction. Circulation. 2013;128:2764–75. doi: 10.1161/CIRCULATIONAHA.113.002863. [DOI] [PMC free article] [PubMed] [Google Scholar]
- 9.Makkar RR, Smith RR, Cheng K, Malliaras K, Thomson LE, Berman D, Czer LS, Marbán L, Mendizabal A, Johnston PV, et al. Intracoronary cardiosphere-derived cells for heart regeneration after myocardial infarction (caduceus): A prospective, randomised phase 1 trial. Lancet. 2012;379:895–904. doi: 10.1016/S0140-6736(12)60195-0. [DOI] [PMC free article] [PubMed] [Google Scholar]
- 10.Kramer CM, Sinusas AJ, Sosnovik DE, French BA, Bengel FM. Multimodality imaging of myocardial injury and remodeling. J Nucl Med. 2010;51:107S–121S. doi: 10.2967/jnumed.109.068221. [DOI] [PMC free article] [PubMed] [Google Scholar]
- 11.Wagner A, Mahrholdt H, Holly TA, Elliott MD, Regenfus M, Parker M, Klocke FJ, Bonow RO, Kim RJ, Judd RM, et al. Contrast-enhanced mri and routine single photon emission computed tomography (spect) perfusion imaging for detection of subendocardial myocardial infarcts: An imaging study. Lancet. 2003;361:374–379. [DOI] [PubMed] [Google Scholar]
- 12.Slomka PJ, Fieno D, Thomson L, Friedman JD, Hayes SW, Germano G, Berman DS. Automatic detection and size quantification of infarcts by myocardial perfusion SPECT: clinical validation by delayed-enhancement MRI. J Nucl Med. 2005;46:728–35. [PubMed] [Google Scholar]
- 13.Bauer RW, Kerl JM, Fischer N, Burkhard T, Larson MC, Ackermann H, Vogl TJ. Dual-energy CT for the assessment of chronic myocardial infarction in patients with chronic coronary artery disease: comparison with 3-T MRI. AJR Am J Roentgenol. 2010;195:639–46. doi: 10.2214/AJR.09.3849. [DOI] [PubMed] [Google Scholar]
- 14.Kim RJ, Fieno DS, Parrish TB, Harris K, Chen EL, Simonetti O, Bundy J, Finn JP, Klocke FJ, Judd RM. Relationship of mri delayed contrast enhancement to irreversible injury, infarct age, and contractile function. Circulation. 1999;100:1992–2002. [DOI] [PubMed] [Google Scholar]
- 15.Kim RJ, Albert TS, Wible JH, Elliott MD, Allen JC, Lee JC, Parker M, Napoli A, Judd RM. Gadoversetamide Myocardial Infarction Imaging Investigators. Performance of delayed-enhancement magnetic resonance imaging with gadoversetamide contrast for the detection and assessment of myocardial infarction: An international, multicenter, double-blinded, randomized trial. Circulation. 2008;117:629–637. doi: 10.1161/CIRCULATIONAHA.107.723262. [DOI] [PubMed] [Google Scholar]
- 16.Farrelly C, Rehwald W, Salerno M, Davarpanah A, Keeling AN, Jacobson JT, Carr JC. Improved detection of subendocardial hyperenhancement in myocardial infarction using dark blood-pool delayed enhancement MRI. Int J Cardiovasc Imaging. 2011;196:339–348. doi: 10.2214/AJR.10.4418. [DOI] [PubMed] [Google Scholar]
- 17.Goldfarb JW, Arnold S, Roth M, Han J. T1-weighted magnetic resonance imaging shows fatty deposition after myocardial infarction. Magn Reson Med. 2007;57:828–834. [DOI] [PubMed] [Google Scholar]
- 18.Ferreira VM, Holloway CJ, Piechnik SK, Karamitsos TD, Neubauer S. Is it really fat? Ask a T1-map. Eur Heart J Cardiovasc Imaging. 2013;14:1060. doi: 10.1093/ehjci/jet095. [DOI] [PMC free article] [PubMed] [Google Scholar]
- 19.Kali A, Cokic I, Tang RL, Yang HJ, Sharif B, Marbán E, Li D, Berman DS, Dharmakumar R. Determination of location, size, and transmurality of chronic myocardial infarction without exogenous contrast media by using cardiac magnetic resonance imaging at 3 T. Circ Cardiovasc Imaging. 2014;7:471–81. doi: 10.1161/CIRCIMAGING.113.001541. [DOI] [PMC free article] [PubMed] [Google Scholar]
- 20.Kali A, Choi EY, Sharif B, Kim YJ, Bi X, Spottiswoode B, Cokic I, Yang HJ, Tighiouart M, Conte AH, et al. Native T1 Mapping by 3-T CMR Imaging for Characterization of Chronic Myocardial Infarctions. J Am Coll Cardiol Img. 2015;8:1019–1030. doi: 10.1016/j.jcmg.2015.04.018. [DOI] [PubMed] [Google Scholar]
- 21.Messroghli DR, Radjenovic A, Kozerke S, Higgins DM, Sivananthan MU, Ridgway JP. Modified Look-Locker inversion recovery (MOLLI) for high-resolution T1 mapping of the heart. Magn Reson Med. 2004;52:141–146. [DOI] [PubMed] [Google Scholar]
- 22.Fox CS, Muntner P, Chen AY, Alexander KP, Roe MT, Cannon CP, Saucedo JF, Kontos MC, Wiviott SD. Acute Coronary Treatment and Intervention Outcomes Network registry. Use of evidence-based therapies in short-term outcomes of ST-segment elevation myocardial infarction and non-ST-segment elevation myocardial infarction in patients with chronic kidney disease: a report from the National Cardiovascular Data Acute Coronary Treatment and Intervention Outcomes Network registry. Circulation. 2010;121:357–65. doi: 10.1161/CIRCULATIONAHA.109.865352. [DOI] [PMC free article] [PubMed] [Google Scholar]
- 23.Shroff GR, Frederick PD, Herzog CA. Renal failure and acute myocardial infarction: clinical characteristics in patients with advanced chronic kidney disease, on dialysis, and without chronic kidney disease. A collaborative project of the United States Renal Data System/National Institutes of Health and the National Registry of Myocardial Infarction. Am Heart J. 2012;163:399–406. doi: 10.1016/j.ahj.2011.12.002. [DOI] [PMC free article] [PubMed] [Google Scholar]
- 24.Saran R, Li Y, Robinson B, Ayanian J, Balkrishnan R, Bragg-Gresham J, Chen JT, Cope E, Gipson D, He K, et al. US Renal Data System 2014 Annual Data Report: Epidemiology of Kidney Disease in the United States. Am J Kidney Dis. 2015; 66:Svii, S1–305. doi: 10.1053/j.ajkd.2015.05.001. [DOI] [PMC free article] [PubMed] [Google Scholar]
- 25.Salerno M, Janardhanan R, Jiji RS, Brooks J, Adenaw N, Mehta B, Yang Y, Antkowiak P, Kramer CM, Epstein FH. Comparison of methods for determining the partition coefficient of gadolinium in the myocardium using T1 mapping. J Magn Reson Imaging. 2013;38: 217–224. doi: 10.1002/jmri.23875. [DOI] [PMC free article] [PubMed] [Google Scholar]
- 26.Dall’Armellina E, Ferreira VM, Kharbanda RK, Prendergast B, Piechnik SK, Robson MD, Jones M, Francis JM, Choudhury RP, Neubauer S. Diagnostic value of pre-contrast T1 mapping in acute and chronic myocardial infarction. J Am Coll Cardiol Img. 2013;6:739–742. doi: 10.1016/j.jcmg.2012.11.020. [DOI] [PubMed] [Google Scholar]
- 27.Amado LC, Gerber BL, Gupta SN, Rettmann DW, Szarf G, Schock R, Nasir K, Kraitchman DL, Lima JA. Accurate and objective infarct sizing by contrast-enhanced magnetic resonance imaging in a canine myocardial infarction model. J Am Coll Cardiol. 2004;44:2383–9. [DOI] [PubMed] [Google Scholar]
- 28.Flett AS, Hasleton J, Cook C, Hausenloy D, Quarta G, Ariti C, Muthurangu V, Moon JC. Evaluation of techniques for the quantification of myocardial scar of differing etiology using cardiac magnetic resonance. JACC Cardiovasc Imaging. 2011;4:150–6. doi: 10.1016/j.jcmg.2010.11.015. [DOI] [PubMed] [Google Scholar]
- 29.Lang RM, Badano LP, Mor-Avi V, Afilalo J, Armstrong A, Ernande L, Flachskampf FA, Foster E, Goldstein SA, Kuznetsova T, et al. Recommendations for cardiac chamber quantification by echocardiography in adults: an update from the American Society of Echocardiography and the European Association of Cardiovascular Imaging. J Am Soc Echocardiogr. 2015;28:1–39.e14. doi: 10.1016/j.echo.2014.10.003. [DOI] [PubMed] [Google Scholar]
- 30.Taylor AJ, Salerno M, Dharmakumar R, Jerosch-Herold M. T1 Mapping: Basic Techniques and Clinical Applications. JACC Cardiovasc Imaging. 2016;9:67–81. doi: 10.1016/j.jcmg.2015.11.005. [DOI] [PubMed] [Google Scholar]
- 31.de Bakker JM, Coronel R, Tasseron S, Wilde AA, Opthof T, Janse MJ, van Capelle FJ, Becker AE, Jambroes G. Ventricular tachycardia in the infarcted, Langendorff-perfused human heart: role of the arrangement of surviving cardiac fibers. J Am Coll Cardiol. 1990;15:1594–607. [DOI] [PubMed] [Google Scholar]
- 32.Wu KC, Weiss RG, Thiemann DR, Kitagawa K, Schmidt A, Dalal D, Lai S, Bluemke DA, Gerstenblith G, Marbán E, et al. Late gadolinium enhancement by cardiovascular magnetic resonance heralds an adverseprognosis in nonischemic cardiomyopathy. J Am Coll Cardiol. 2008;51:2414–21. doi: 10.1016/j.jacc.2008.03.018. [DOI] [PMC free article] [PubMed] [Google Scholar]
- 33.Volpe GJ, Moreira HT, Trad HS, Wu KC, Braggion-Santos MF, Santos MK, Maciel BC, Pazin-Filho A, Marin-Neto JA, Lima JAC, et al. Left Ventricular Scar and Prognosis in Chronic Chagas Cardiomyopathy. J Am Coll Cardiol. 2018;72:2567–2576. doi: 10.1016/j.jacc.2018.09.035. [DOI] [PubMed] [Google Scholar]
- 34.Duan C, Zhu Y, Jang J, Rodriguez J, Neisius U, Fahmy AS, Nezafat R. Non-contrast myocardial infarct scar assessment using a hybrid native T1 and magnetization transfer imaging sequence at 1.5T. Magn Reson Med. 2019;81:3192–3201. doi: 10.1002/mrm.27636. [DOI] [PMC free article] [PubMed] [Google Scholar]
- 35.Stoffers RH, Madden M, Shahid M, Contijoch F, Solomon J, Pilla JJ, Gorman JH 3rd, Gorman RC, Witschey WRT. Assessment of myocardial injury after reperfused infarction by T1ρ cardiovascular magnetic resonance. J Cardiovasc Magn Reson. 2017; 19: 17. doi: 10.1186/s12968-017-0332-z. [DOI] [PMC free article] [PubMed] [Google Scholar]
Associated Data
This section collects any data citations, data availability statements, or supplementary materials included in this article.