. 2020 Jun 18;9:e55957. doi: 10.7554/eLife.55957

Figure 2. LUZP1 localizes to the centrosome and the actin cytoskeleton.

(A) Immunofluorescence micrographs of LUZP1 (green) and Centrin-2 (CETN2, blue) in RPE1 cells. (B–D) Immunofluorescence micrographs of U2OS cells expressing LUZP1-YFP (green) stained with antibodies against CETN2 (blue) and CCP110 (B), Pericentrin (C) and PCM1 (D) in magenta. Plot profile of the different fluorophore intensities along the yellow lines in (C, D). Schematic representation of LUZP1 localization at the centrosome according to their respective micrographs in (A–D). Scale bar, 1 µm. Imaging in (A–D) was performed using confocal microscopy (Leica SP8, 63x objective). Lightning software (Leica) was applied. (E, F) Immunofluorescence micrographs of U2OS cells stained with an antibody against endogenous LUZP1 (green), phalloidin to detect F-actin (magenta), and counterstained with DAPI (blue). Single green and magenta channels are shown in black and white. (F) LUZP1 at the midbody in dividing cells (yellow arrowhead). Scale bar, 10 µm (E, F). Imaging in (E, F) was performed using widefield fluorescence microscopy (Zeiss Axioimager D1, 63x objective).

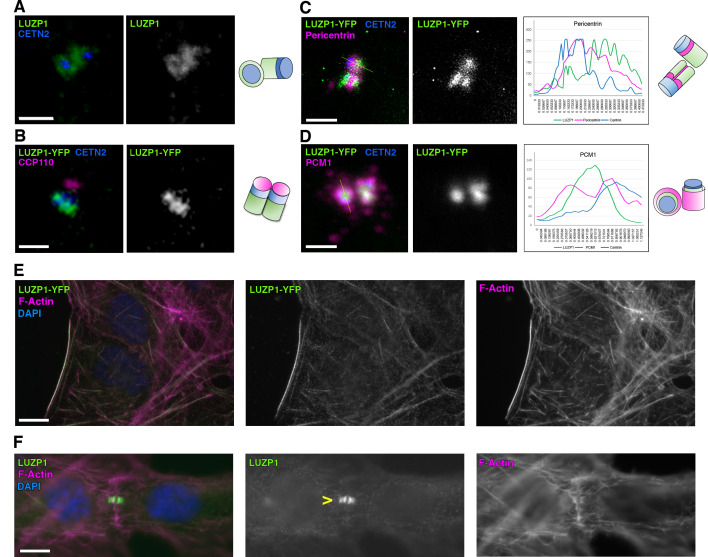
Figure 2.

Figure 2—figure supplement 1. Centrosomal localization of LUZP1 at different cell cycle stages.

Figure 2—figure supplement 1.

Immunofluorescence micrographs showing LUZP1 in the centrosome during cell cycle in RPE1 cells. Cells were treated with mimosine (G1 phase), thymidine (S phase), RO-3306 (G2/M phase) or starved (G0) with and without the proteasome inhibitor MG132. Cells were stained in green with antibodies against endogenous LUZP1, and in blue with DAPI. Scale bar 0.5 µm. Imaging was performed using widefield fluorescence microscopy (Zeiss Axioimager D1, 63x objective). On the lower right panel, graphical representation of the percentage of cells showing the presence of LUZP1 at the centrosome per micrograph, corresponding to the experiment in (A); n > 6 micrographs. Note a general decrease of LUZP1 during G2/M and upon starvation (G0), which is recovered by MG132 addition. Graphs represent Mean and SEM of three independent experiments pooled together. P-values were calculated using Kruskall-Wallis and Dunn's multiple comparisons test. ** over G2/M and G0 columns indicate that they are significantly different from the rest of the columns and not significant amongst them.
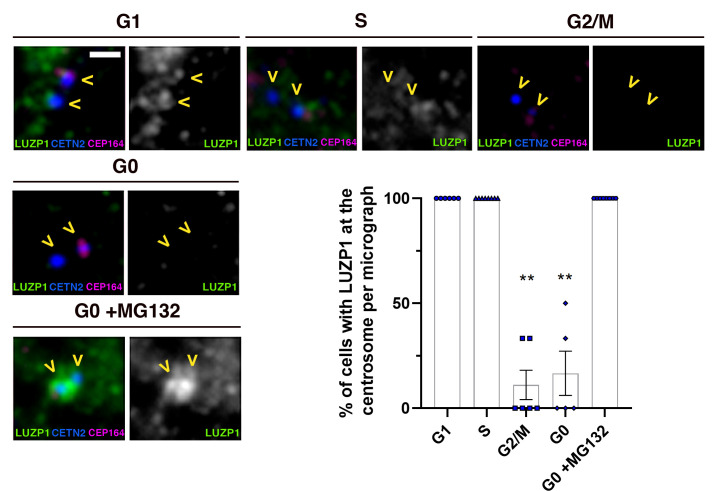
Figure 2—video 1. LUZP1 localization in the centrosome.
Download video file (238KB, mp4)
3D reconstruction of Z-stack micrographs of human control fibroblasts (ESCTRL#2) stained with antibodies against endogenous LUZP1 (green) and acetylated alpha and gamma tubulin to label the cilia and centrosomes, respectively (magenta). Image was taken using Confocal Super-resolution microscopy (LSM 980, Zeiss).