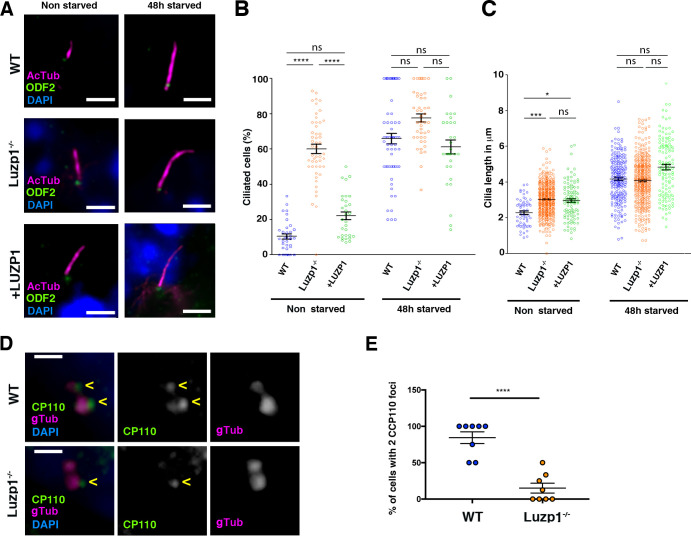
Figure 6. Loss of Luzp1 causes aberrant cilia frequency and length and Shh signaling.
(A) Micrographs of Shh-LIGHT2 cells (WT), Shh-LIGHT2 cells lacking Luzp1 (Luzp1-/-) and Luzp1-/- cells rescued with human LUZP1-YFP (+LUZP1) analyzed in cycling conditions (non-starved), or during cilia assembly (48 hr starved). Cilia were visualized by acetylated alpha-tubulin (magenta), basal body by ODF2 (green) and nuclei by DAPI (blue). Scale bar 2.5 µm. (B, C) Graphical representation of percentage of ciliated cells per micrograph (B) and cilia length (C) measured in WT (blue circles, n > 34 micrographs), Luzp1-/- (orange circles, n > 44 micrographs) or +LUZP1 cells (green circles, n > 30 micrographs) from three independent experiments. No starvation: WT 2.3 µm; Luzp1-/- cells 3.0 µm; +LUZP1 cells 2.9 µm; 48 hr starvation: WT 4.2 µm; Luzp1-/- cells 4.1 µm; +LUZP1 cells 4.8 µm; all average measures. (D) Immunofluorescence micrographs of WT and LUZP1-/- cells stained with antibodies against endogenous CCP110 (green), gamma-tubulin (gTub) to label the centrioles (magenta) and DAPI to label the nuclei (blue). Black and white images show the single green and magenta channels. Note the different distribution of CCP110 to the centrosome in LUZP1-/- compared to WT cells. Scale bar, 1 µm. (E) Graphical representation of the percentage of cells showing the presence of CCP110 to both centrioles per micrograph corresponding to the experiments in (D); n = 10 micrographs. Three independent experiments were pooled together.

