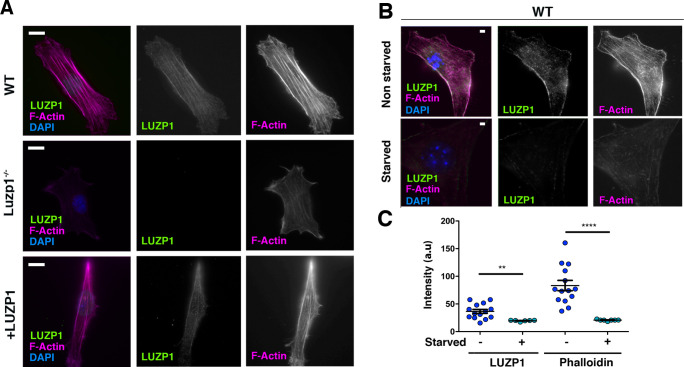
Figure 8. Cells missing Luzp1 show reduced F-actin levels.
(A) Immunofluorescence micrographs of WT, Luzp1-/- and +LUZP1 cells stained with an antibody against endogenous LUZP1 (green), phalloidin to detect F-actin (magenta), and counterstained with DAPI (blue). Single green and magenta channels are shown in black and white. Note the lack of LUZP1 signal in Luzp1-/- cells. Scale bar, 10 µm. (B) Immunofluorescence micrographs of non-starved and starved WT cells stained with antibodies against endogenous LUZP1 (green), phalloidin (magenta) and DAPI (blue). Single green and magenta channels are shown in black and white. Scale bar, 5 µm. Imaging was performed using widefield fluorescence microscopy (Zeiss Axioimager D1, 63x objective). (C) Graphical representation of the LUZP1 or F-actin mean intensity (arbitrary units) as shown in (B). Graphs represent Mean and SEM of three independent experiments pooled together. P-values were calculated using One-way ANOVA and Bonferroni post-hoc test.

