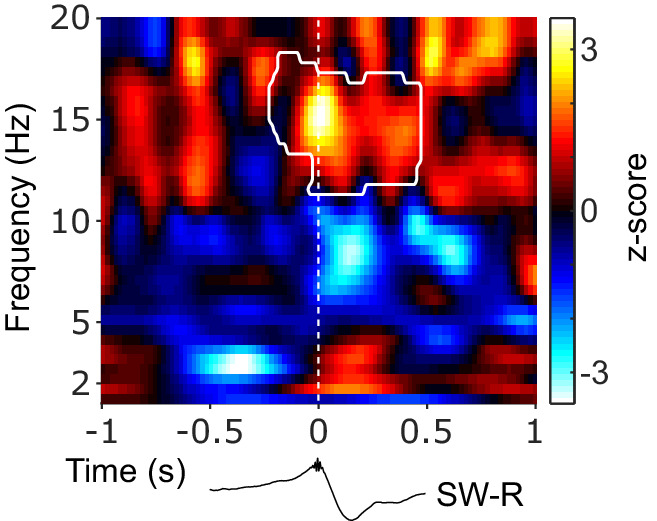
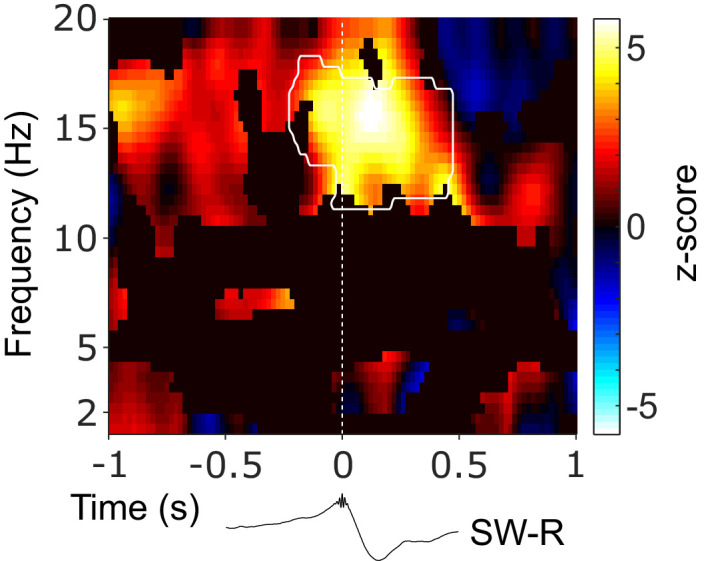
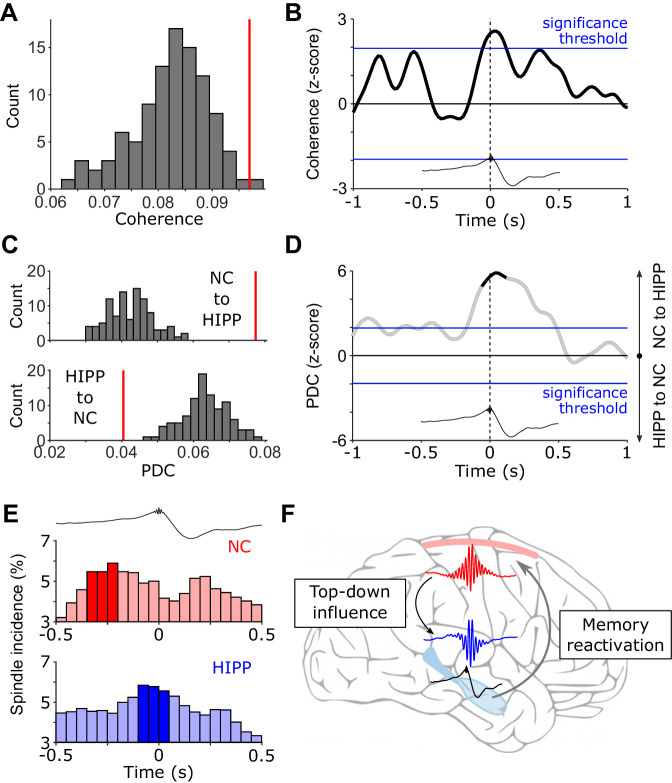
Figure 3. (Directional) Cortical-hippocampal communication via spindles.
(A) HIPP-NC coherence. The red line depicts the observed coherence between HIPP and NC in the cluster of concurrent increases in spindle power around HIPP SW-Rs (see Figure 2C). Histogram depicts the distribution of individual coherence values for 100 sets of control events. (B) Time-resolved HIPP-NC coherence for the 12–16 Hz spindle range transformed into a z-score with respect to the control events. Blue lines indicate standard significance thresholds (z = 1.96). Time 0 denotes HIPP SW-Rs. (C) Partial directed coherence (PDC). Red vertical lines represent directional influence from NC to HIPP (top) or directional influence from HIPP to NC (bottom) in the cluster of concurrent increases in spindle power around HIPP SW-Rs (Figure 2C). Histograms depict distribution of individual PDC values for 100 sets of control events. (D) Time course of difference between z-transformed NC - > HIPP and HIPP - > NC influence in the 12–16 Hz spindle range. Positive values signify a cortical influence in the 12–16 Hz spindle range on HIPP and vice versa for negative values. Black-colored sections correspond to time intervals with significant spectral coherence shown in (B). Blue lines mark standard significance thresholds (z = 1.96). (E) Peri-event histograms of spindle onsets in NC (top) and HIPP (bottom) within a ± 0.5 s time window around SW-Rs (time = 0 s, top trace). Dark colored bars indicate significant time bins, resulting from comparison with ripple-free control events (z > 1.96). (F) Schematic illustrating the hypothesized spindle-mediated cortical-hippocampal dialogue around SW-Rs: First, sleep spindles mediate a top-down influence from NC to HIPP. In HIPP, sleep spindles in turn coordinate the occurrence of SW-Rs on a fine temporal scale. SW-Rs are linked to the reactivation of relevant memory traces, thought to be distributed to neocortical sites for long-term storage (Klinzing et al., 2019).
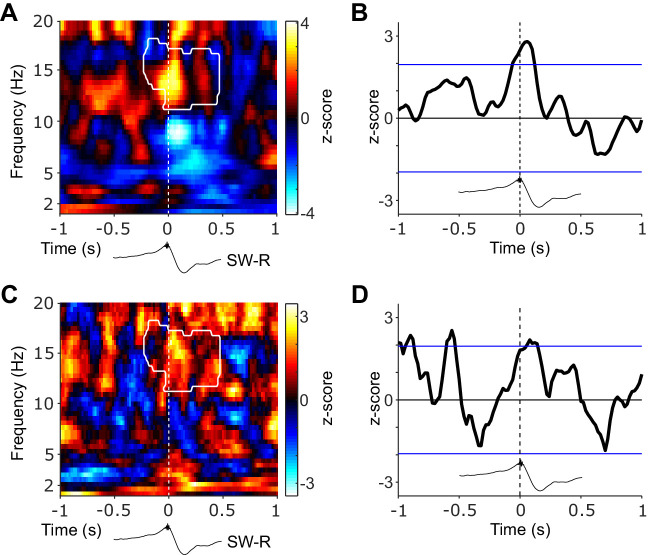
Figure 3—figure supplement 1. Mutual cortical-hippocampal connectivity around SW-Rs.

Figure 3—figure supplement 2. Amplitude- and phase-based cortical-hippocampal connectivity.
Figure 3—figure supplement 3. Directed cortical-hippocampal connectivity around SW-Rs.


