Abstract
Background.
MOG antibody and AQP4 antibody seropositive diseases are immunological distinct subtypes of neuromyelitis optica spectrum disorders (NMOSD) with similar clinical presentations. MRI findings can be instrumental in distinguishing MOG antibody disease from AQP4 antibody NMOSD.
Objectives:
To characterize the neuroradiological differences between MOG antibody disease and AQP4 antibody NMOSD with the aim to distinguish between the two entities.
Methods.
This is a retrospective study of 26 MOG and 25 AQP4 seropositive patients in which MRI features of the brain, spinal cord and orbit were compared.
Results.
The majority of the abnormal findings in the MOG cohort were located on orbital MRIs, while spinal cord MR abnormalities were more common in the AQP4 cohort. Brain abnormalities showed some overlap, but cortical grey/juxtacortical white matter involvement was distinct to MOG patients, while area postrema involvement was a rare feature.
Conclusions.
Cortical grey/juxtacortical white matter lesions on brain MRI might help distinguish MOG antibody disease from AQP4 positive NMOSD. These findings could be of value in distinguishing the two entities as early as the first presentation.
Keywords: MOG antibody, AQP4 antibody, NMOSD, magnetic resonance imaging
Introduction.
Neuromyelitis optica spectrum disorder (NMOSD) is rare autoimmune central nervous system (CNS) disease. It was thought to only involve the optic nerves and spinal cord leading to blindness and paralysis(1). In 2015, the spectrum was defined to include 6 core features namely, optic nerves, spinal cord, area postrema, brain stem, diencephalic structures and cerebral hemispheres.(2) Up to 87% of NMOSD patients harbor a serological antibody to the aquaporin-4 (AQP4) water channel(3). Among NMOSD patients who test negative for the AQP4 antibody, up to 42% test positive for an antibody against myelin oligodendrocyte glycoprotein antibody (MOG) (4, 5). Compared to AQP4 seropositive patients, MOG antibody disease (MOGAD) is thought to more commonly affect young Caucasian males, with a relatively better long-term clinical outcome (6, 7).
MRI is instrumental in distinguishing NMOSD from multiple sclerosis (MS), but initial MR reports in MOG antibody disease identified both overlapping and unique features compared with AQP4 NMOSD (5, 8). Longitudinally extensive optic nerve lesions are common in both MOGAD and AQP4 seropositive NMOSD,(9, 10) while posterior nerve segment and chiasmatic involvement appears to be more unique to AQP4 NMOSD (10). Despite the fact that 50% of MOG patients relapse with transverse myelitis (7, 11, 12), they are less likely to experience cord necrosis or atrophy as a sequelae, relative to AQP4 patients (13–15). Conus medullaris is a frequent target of attack in MOGAD patients compared to the cervical and thoracic spinal cord in AQP4 NMOSD (13).
In this study we retrospectively reviewed the MR imaging findings of MOG and AQP4 antibody seropositive NMOSD and compared our findings with those that have been reported. The goal is to confirm known MRI features or identify new ones in NMOSD that can prompt serological testing for the MOG antibody.
Patients and Methods.
This is a retrospective analysis of patients recruited in person from the Johns Hopkins Hospital NMO clinic between 2015-2018 or recruited remotely through review of records by the principle investigator (ML). Inclusion criteria for MOG antibody disease were: 1. MOG antibody seropositivity by live cell-based assay with IgG1 secondary antibody from the Mayo Medical Lab, Quest Diagnostics or the Oxford University Neuroimmunology Laboratory (UK); and 2. inflammatory attack(s) of the optic nerve, spinal cord or brain. We did not necessarily exclude patients who also met criteria for multiple sclerosis (MS) as there is no consensus-based distinction between MS and MOGAD. Inclusion criteria for AQP4 seropositive NMOSD were based on the 2015 International Panel on NMOSD Diagnosis which requires 1. AQP4 antibody seropositivity by ELISA( four patients were tested subsequently using cell-based assay due to negative ELISA results despite strong clinical suspicion) ; 2. inflammatory attack(s) of the optic nerve, spinal cord or brain, including the brainstem and area postrema attacks(2).
All MOG positive patients were included (n=26) and 25 AQP4 positive patients with matching age and sex were collected from the records.
All subjects provided consent to participate in this study, which was approved by the Johns Hopkins University institutional review board.
The MR exams were performed with different scanners at either 1.5T or 3T magnetic strength: Philips Healthcare (Best, the Netherlands), GE Healthcare (Milwaukee, Wisconsin), and Siemens (Erlangen, Germany). For brain MRI, sagittal T1WI, axial fast spin-echo T2WI, axial/sagittal fast spin-echo FLAIR, and in some cases sagittal 3D FLAIR images, axial diffusion and ADC mapped images followed by post-contrast axial and coronal T1WI were analyzed. Small field of view axial and coronal T2WI with fat saturation and fat saturated post contrasted axial and coronal images were obtained for orbital evaluation. Sagittal T1, T2, STIR and axial T1, T2 weighted images were obtained through the spine without contrast followed by sagittal and axial T1 weighted images obtained after gadolinium administration. All patients were given intravenous gadolinium-based contrast media.
MRIs were performed for clinical purposes either during an acute neurological presentation or for follow up. The images were reviewed blindly by two independent raters (II, MK). Brain lesions were described in regards to location in the supratentorial or infratentorial compartment and enhancement pattern. Spinal lesions were described according to location, length of involvement, cord expansion and enhancement characteristics/pattern. Longitudinally extensive transverse myelitis was defined as myelitis extending three or more spinal segments. Optic nerve lesions were described in regards to their location, length of involved enhancing segment, unilaterality or bilaterality of involvement, and T2 signal abnormality. Long segment optic neuritis was defined by enhanced segment length of 17.6 mm or more (16). When there was a discrepant finding between the two readers, the images were reviewed by both readers and a consensus was achieved.
Statistical analysis:
Qualitative data were described using number and percent. Quantitative data were described using mean and median, minimum and maximum. Categorical data were compared using the two-tailed Fisher exact test, a statistical test without assumptions on the sampling distribution that is considered preferred for small sample sizes and/or number of observations(17). Results were corrected for multiple-comparison testing by using the Bonferroni correction method, and significant results both without and with multiple-testing correction are reported. With the Bonferroni correction, statistical significance is reached if P value is < 0.05/N, where N was conservatively set to 30, the total number of imaging features tested. Therefore, P values < 0.0017 were considered significant, corrected for multiple comparisons. All statistical analysis were performed in R.
Results.
A total of 413 MRIs were reviewed, 210 belonging to 26 MOGAD patients and 203 from 25 AQP4 positive NMOSD patients. The MOG positive MRIs included 89 brain, 76 spinal and 45 orbital MRIs, while the AQP4 positive images included 72 brain, 105 spinal and 26 orbital MRIs. The detailed demographic and clinical features of all patients are provided in Table 1.
Table 1.
Summary of the epidemiologic and clinical characteristics of the MOG positive vs AQP4 seropositive cohorts.
| Characteristic | MOG Antibody Disease n=26 (%) | AQP4 seropositive NMOSD n=25 (%) |
|---|---|---|
| Sex | ||
| Female | 18 (69.2) | 18 (72%) |
| Race | ||
| Caucasians | 15 | 3 |
| African/American | 5 | 15 |
| Latino | 1 | 3 |
| Other | 5 | 4 |
| Age | ||
| Mean | 40.6 years | 40.96 years |
| Median | 41.5 years | 41 years |
| Range | 7-72 years | 15-65 years |
| Age at onset | ||
| Mean | 35 years | 33.3 years |
| Median | 37.5 years | 34 years |
| Range | 3.5 – 66 years | 10 – 56 years |
| EDSS | ||
| Mean | 2 | 4.7 |
| Median | 2 | 5.5 |
| Range | 0 – 4 | 0-8 |
| Number of relapses | ||
| Mean | 4 | 3.8 |
| Median | 3.5 | 3 |
| Range | 1 – 18 | 1-16 |
| Autoimmune disease | ||
| Thyroid disease | 5 (21.7%) | 0 (0%) |
| Ulcerative colitis | 1 (4.3%) | 0 (0%) |
| Presentation at disease onset | ||
| Optic neuritis | 11(42.3%) | 6 (24%) |
| Encephalopathy | 6 (23%) | 1 (4%) |
| Transverse myelitis | 5 (19%) | 11 (44%) |
| ON + TM | 1 (3.8%) | 2 (8%) |
Brain MRI.
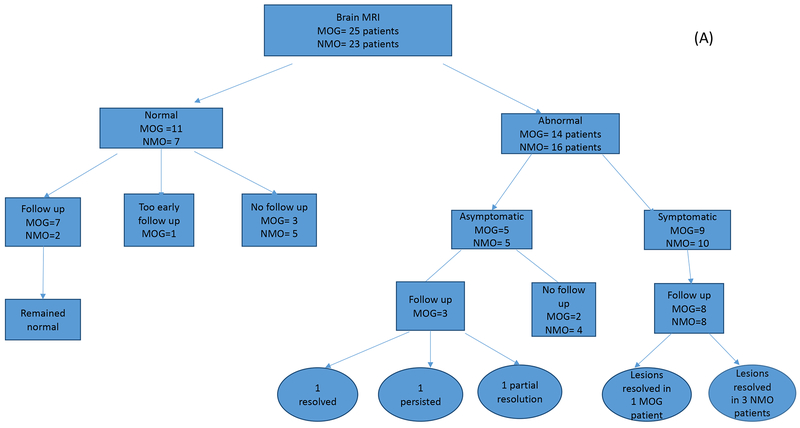
In this study, we divided patients into those who had no evidence of brain involvement (normal brain MRIs) throughout their disease course and those who had at least one abnormal MRI at any point during their disease process. Patients with abnormal MRIs were subdivided into symptomatic or asymptomatic according to the contribution of the brain lesions to their clinical symptomatology (Figure 1). In the MOGAD cohort, brain MRIs were available for 25 patients, with eleven of these patients having completely normal MRIs throughout their available disease course of 17 months (3-46 months). Interestingly, three of the 11 subjects nevertheless had complaints that localized to the brain at some time in their disease course. In the cohort of 14 MOGAD patients with abnormal brain MRIs, there were a total of 48 abnormal brain MRIs over an average duration of 17.8 months. The most common lesion locations in descending frequencies were; the supratentorial deep white matter (WM), in 9 patients (64%), cortical grey/juxtacortical white matter (cortical GM/juxtacortical WM) (Figure 2A) and pons in 8 patients (57%), cerebellum, midbrain, medulla and corpus callosum were each affected in 6 patients (43%). The least frequently involved locations were periventricular white matter, area postrema, and basal ganglia (Table 2).
Figure 1.
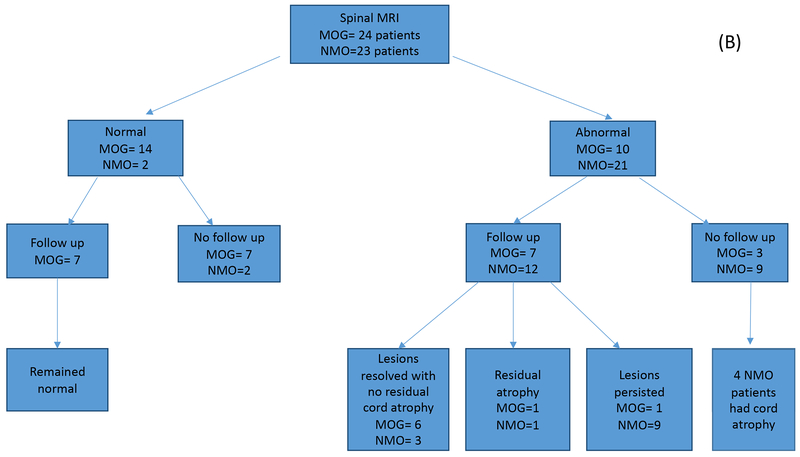
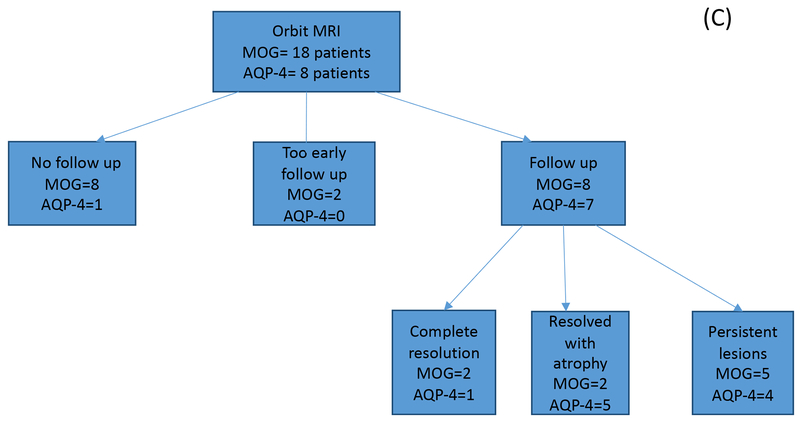
A. Number of brain MRIs analyzed for the MOG antibody (n=25) and matched AQP4 seropositive disease groups (n=23). Studies were first divided into abnormal versus normal studies, then by follow up status. Final outcomes are indicated in both cohorts. B. Number of spinal cord MRIs analyzed for the MOG antibody (n=24) and matched AQP4 seropositive disease groups (n=23). Studies were first divided into abnormal versus normal studies, then by follow up status. Final outcomes are indicated in both cohorts. C. Number of orbital MRIs analyzed for the MOG antibody (n=18) and matched AQP4 seropositive disease groups (n=8). Studies were first divided into abnormal versus normal studies, then by follow up status. Final outcomes are indicated in both cohorts.
Figure 2.
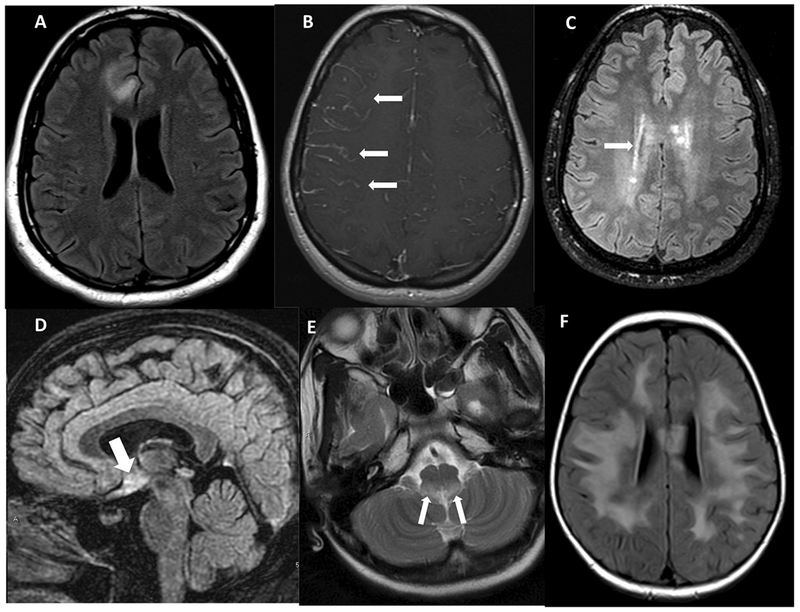
A. Axial FLAIR image showing cortical grey matter and juxta-cortical white matter involvement in MOG B. Axial post-contrast images showing leptomeningeal enhancement in a patient with MOG. C. Axial FLAIR image showing peri-ependymal involvement of supratentorial brain. D. Sagittal FLAIR showing signal changes from involvement of hypothalamus suggestive of diencephalon syndromic pattern of AQP4 NMOSD. E. Axial T2W-weighted image showing signal changes in the region of area postrema in a patient with NMOSD. F. Axial FLAIR image showing the encephalopathic pattern of involvement in a patient with MOG disease.
Table 2.
Location of brain lesions in MOG antibody vs AQP4 antibody NMOSD.
| Location involved | MOG antibody disease, n=14 (%) | AQP4 NMOSD, n=16 (%) | P value |
|---|---|---|---|
| Deep WM | 9 (64%) | 8 (50%) | 0.4837 |
| Pons | 8 (57%) | 8 (50%) | 0.73 |
| Cortical GM/juxtracortical WM | 8 (57%) | 0 (0%) | 0.0005* |
| Cerebellum | 6 (43%) | 4 (25%) | 0.4421 |
| Corpus callosum | 6 (43%) | 4 (25%) | 0.4421 |
| Midbrain | 6 (43%) | 3 (18.8) | 0.236 |
| Medulla | 6 (43%) | 7 (43.8%) | 1 |
| Periventricular WM | 5 (35.7%) | 3 (18.8%) | 0.4171 |
| Basal ganglia | 2 (14.2%) | 4 (25%) | 0.6567 |
| Area postrema | 1 (7%) | 8 (50%) | 0.0169 |
statistically significant corrected for multiple comparisons (<0.0017).
MOGAD positive periventricular lesions were seen to extend from nearby cortical lesions, with larger lesion size and without perpendicular orientation to ventricular ependyma. None of the lesions fulfilled the Macdonald’s MS imaging criteria. Gadolinium enhancement was observed in 9 patients (64.3%) with nodular type enhancement pattern as the most frequent pattern (in 8 patients), followed by incomplete ring pattern (in 3 patients). Three patients showed a linear leptomeningeal enhancement pattern (Figure 2B)
In the AQP4 NMOSD cohort, 23 patients had brain MRIs, of which only 7 were normal. The most common locations of brain lesions in the AQP4 seropositive group were pontine, area postrema and deep white matter lesions in 8 patients (50% each), followed by medullary lesions in 7 patients (46%). No patients in this group showed involvement of cortical grey/juxtcortical white matter location. The least frequently involved locations were basal ganglia (4), corpus callosum (3), cerebellum (4) and periventricular area (4). Periventricular lesions, when present, tended to follow linear periependymal (Figure 2C) or focal nodular patterns as opposed to the larger lesion size seen in the MOG group. Gadolinum enhancement in brain lesions was less frequent among AQP4 patients, observed in 4 (25%). No patients imaged in this group showed the leptomeningeal disease pattern.
Asymptomatic Brain Lesions.
Among the fourteen MOGAD patients with abnormal brain MRIs, five were asymptomatic and nine were symptomatic. The asymptomatic brain lesions were scattered and punctate without enhancement in 3 out of 5. Two patients (2/5) had enhancing lesions, one with localized leptomeningeal enhancement and one with an enhancing pontine lesion. Follow up MRIs were available for three of the asymptomatic subjects, obtained over an average duration of 37 months (1-96 months): one patient showed complete resolution before treatment initiation (Figure 3), one had persistent, unchanged T2 signal changes and a third showed partial resolution of findings.
Figure 3:
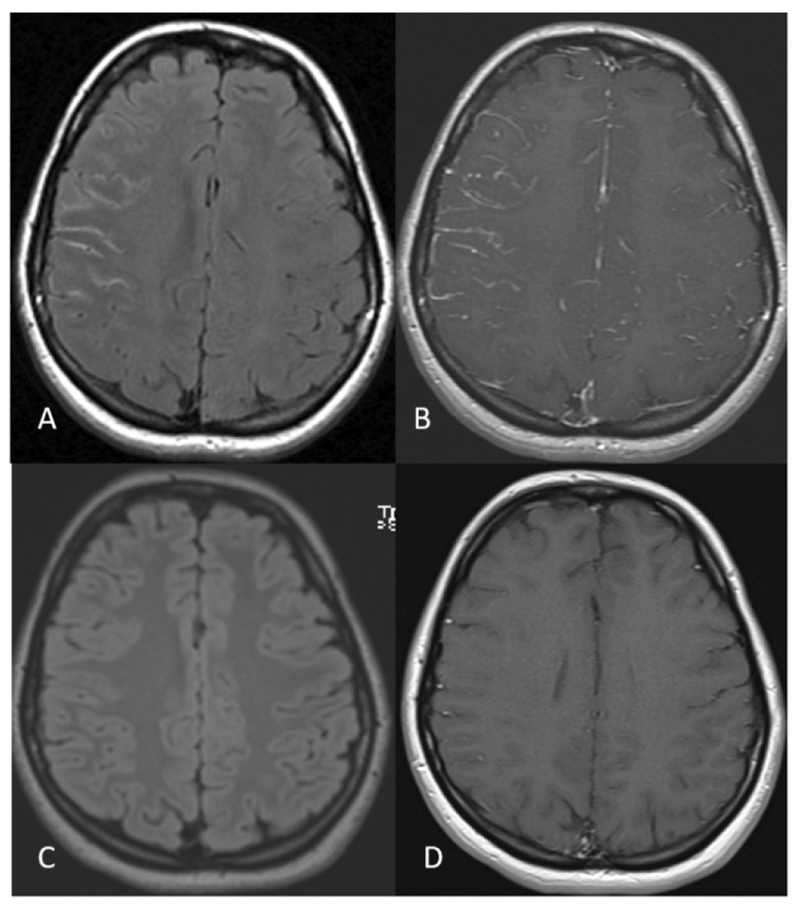
A 23 year- old MOGAD woman without past medical history presents with 5 days of right frontal headache and painful right eye movements. Orbital MRI shows right optic neuritis (not shown) and right sided non-suppression of CSF signal on the FLAIR sequence (A) and leptomeningeal enhancement in the right cerebral sulci (B). Follow up brain MRI after one month shows normal brain MRI findings (C and D).
Sixteen AQP4 seropositive patients had abnormal brain MRIs, of which 5 were asymptomatic and 11 were symptomatic. In the asymptomatic group, 3 patients showed a similar pattern of punctate and scattered non-specific signal abnormalities observed in the MOGAD group, while the other two had lesions in the hypothalamus (Figure 2D) and area postrema (Figure 2E). No follow up was available.
Symptomatic Brain Lesions.
Among the nine MOG patients with symptomatic brain lesions, 8 were followed with repeat scans over a mean duration of 15 months (1-67). All eight except one, showed persistent lesion load, though on final MRI there were various degrees of improvement.
Four (4/9) presented with bilateral ADEM-like pattern of brain involvement (Figure 2F). One of those four patients showed resolution of their lesions on final follow up. Rituximab was started in this patient immediately after diagnosis. The other four patients with symptomatic lesions had involvement of the brain stem mainly along with few patches scattered in the supratentorial brain, and periventricular area.
Among the eleven AQP4 seropositive patients with symptomatic brain MRIs, follow up was available in 8 patients over an average duration of 40 months (6-78). Of those, five showed persistent lesion load while three had complete resolution of their lesions on final follow up. Those three with complete resolution involved lesions in the area postrema. The persistent lesions involved the brainstem with non-specific white matter lesions in some scans. The three patients with complete lesion resolution received long-term immunsuppression immediately after diagnosis , with one receiving rituximab, one mycophenolate mofetil and the third failed azathioprine and was switched to rituximab.
Spinal cord MRI.
Out of the 26 MOGAD patients in this cohort, 24 underwent spine MR imaging for either routine purposes or for relapse investigation (Figure 1). Fourteen patients (58%) had normal spine MRIs over their 1.5-year disease course despite a clinical suspicion of myelitis in two subjects. Ten patients (38%) had abnormal spine MRI, of which 7 had serial spine MRIs over a mean follow up duration of 21.3 months (3 weeks - 55 months). Among the 25 AQP4 seropositive NMOSD patients, 23 underwent spine MR imaging, of which 2 were normal (Figure 1). Twenty-one (91.3%) patients showed abnormal spine MRIs, of which 12 had follow up over an average duration of 26.8 months (3-114 months)
The features of myelitis in the two groups are summarized in Table 3. Interestingly, there were no specific radiological features that could reliably differentiate between the two cohorts. There were equal numbers of longitudinally extensive lesions in both groups, and the characteristics of these spinal cord lesions were the same in terms of grey/white matter involvement, location and gadolinium enhancement. Examples of spinal cord involvement in AQP-4 NMOSD (Figure 4A,B,C). Spinal lesions resolved more frequently in MOGAD patients as compared to AQP4 (Figure 5). Interestingly, in 2/6 MOGAD patients with complete lesion resolution, long term immunsupression was not started at the time of follow up images . The remaining 4 were maintained on rituximab in two patients and azathioprine in the other two.
Table 3.
Spinal MRI Characteristics of MOG antibody vs AQP4 antibody.
| Characteristic | MOG antibody disease, n=10 (%) | AQP4 NMOSD, n=21 (%) | P value |
|---|---|---|---|
| Central cord lesion | 8 (80%) | 18 (85.7%) | 1 |
| Peripheral cord lesion | 5 (50%) | 17 (80.9%) | 0.1045 |
| Cord expansion | 6 (60%) | 12 (57%) | 1 |
| Bright spots | 5 (50%) | 13 (61.9%) | 0.7007 |
| T1 hypointensity | 4 (40%) | 14 (66.6%) | 0.2469 |
| Enhancement | 6 (60%) | 12 (57%) | 1 |
| Cord atrophy | 1 (10%) | 5 ( 23.8) | 0.6342 |
| Lesion length | |||
| Longitudinally Extensive | 7 (70%) | 14 (66%) | 1 |
| Focal Lesions | 4 (40%) | 14 (66%) | 0.2469 |
Figure 4.
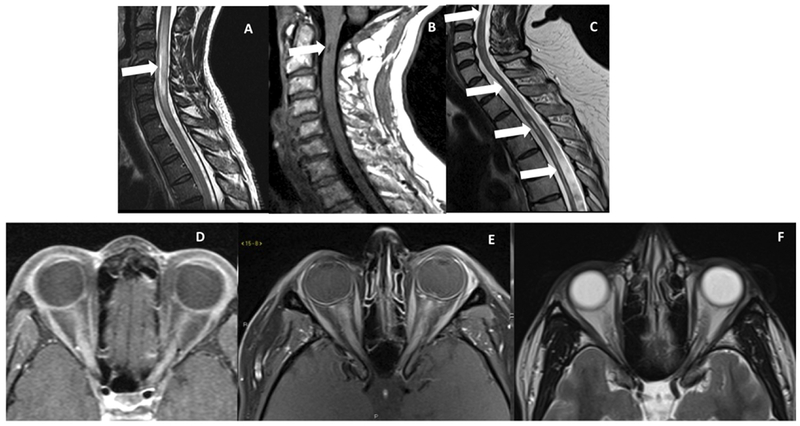
A. Sagittal T2-weighted image showing a bright spot ventrally in the cervical cord in an NMOSD patient. B. Sagittal T1-weighted image shows a dark T1 spot in a patient with AQP4 NMOSD. C. Sagittal T2-weighted image showing cord atrophy and residual T2 hyperintensity in a patient with NMOSD. D. Axial post-contrast image showing longitudinally extensive optic neuritis in a patient with MOG. E. Axial post-contrast image showing longitudinally extensive bilateral optic neuritis in a patient with NMOSD, and on follow up scan as seen in F axial T2-weighted image showing bilateral optic atrophy.
Figure 5:
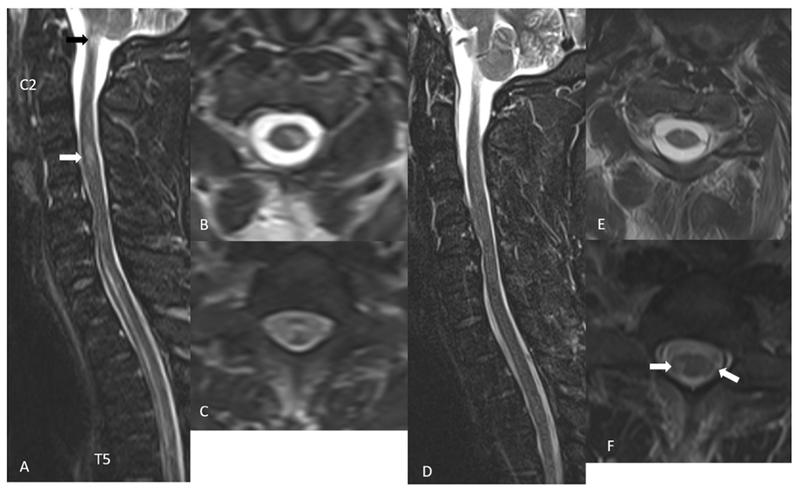
A 32-year-old MOGAD male presents with leg weakness and numbness, bladder and bowel retention. STIR sagittal image (A) shows longitudinally extensive T2 hyperintense signal changes in the anterior cord extending from C7 to T5 vertebra and a smaller areas of T2 hyperintensity at C4 level (white arrow in A) and at C1 level (black arrow in A). Axial T2 weighted images show a left central and lateral cord hyperintensity (B) and almost entire cord signal abnormality at T1 level (C). Follow up imaging after 18 days show almost complete resolution of signal abnormalities on STIR sagittal image (D and E). There are a few small areas of residual T2 hyperintense signal changes in the bilateral lateral cord at T1 level (arrows in F).
Orbital MRI.
Forty-six orbital MRIs were obtained in 21 MOGAD patients, most of which were performed during investigation of acute optic neuritis (Figure 1). T2 hyperintense MOG lesions were generally more anteriorly based: orbital (75% of 24 images), intracanalicular (54%), pre-chiasmatic (37.5%), chiasmatic (8.3%) and optic tracts (4%). Gadolinium enhancement was noted in all 24 images (100%) from MOG seropositive cases, with the orbital segment involvement being the most common as noted on 20 MRIs (83.3%). Canalicular and pre-chiasmatic enhancement was observed in 14 (58.3%) and 10 (41.7%) MRIs, respectively. Chiasmatic enhancement was evident in 2 (8.3%) MRIs with optic tract enhancement in one (4%) MRI. Longitudinally extensive lesions, defined as gadolinium enhancing lesions greater than 17.6 mm, were measured in 17 (48.6%) cases (Figure 4D), while 18 (51.4%) showed short segment optic neuritis. The average lesion length was of 20.5 mm (range 4 - 41.7 mm).
Twenty-six orbital MRIs obtained in 23 AQP4 seropositive NMOSD patients were available for analysis, all of which were done for workup or follow up of acute optic neuritis. Similar to the MOG cohort, AQP4 seropositive patients showed T2 hyperintense signal most commonly in the orbital segment – in 11 out of 12 MRIs (91.7%). The intracanalicular, prechiasmatic, chiasmatic and optic tract were additionally involved in 75%, 25%, 16.7% and 16.7% of MRIs, respectively. Gadolinum enhancement was less evident, observed in 8 MRIs (66.7%) of images obtained during relapse. Orbital segment enhancement was the most common, observed in 7 MRIs (87.5%), followed by canalicular, prechiasmatic, chiasmatic and optic tracts in 6 (75%), 5 (62.5%), 1 (12.5%) and 1 (12.5%) MRIs, respectively. Seven of the eight were longitudinally extensive with an average length of 28.8 mm (12-51 mm) (Figure 4E).
Eight MOGAD patients had serial MRI imaging of the optic nerves, two of which showed complete resolution of optic nerve abnormalities over an average of 4.25 months. One of them was maintained on azathioprine (Figure 6) while the other was not on treatment at the time. Two cases showed residual optic atrophy over an average of 8.5 months and five patients had persistent T2 hyperintense optic nerve lesions on follow up over 11.9 months average duration. Among the AQP4 seropositive patients, seven were followed with serial MRIs over an average duration of 43.9 months (6-91 months). Optic atrophy was the sequele in 5 patients (71.4%) (Figure 4F).
Figure 6:
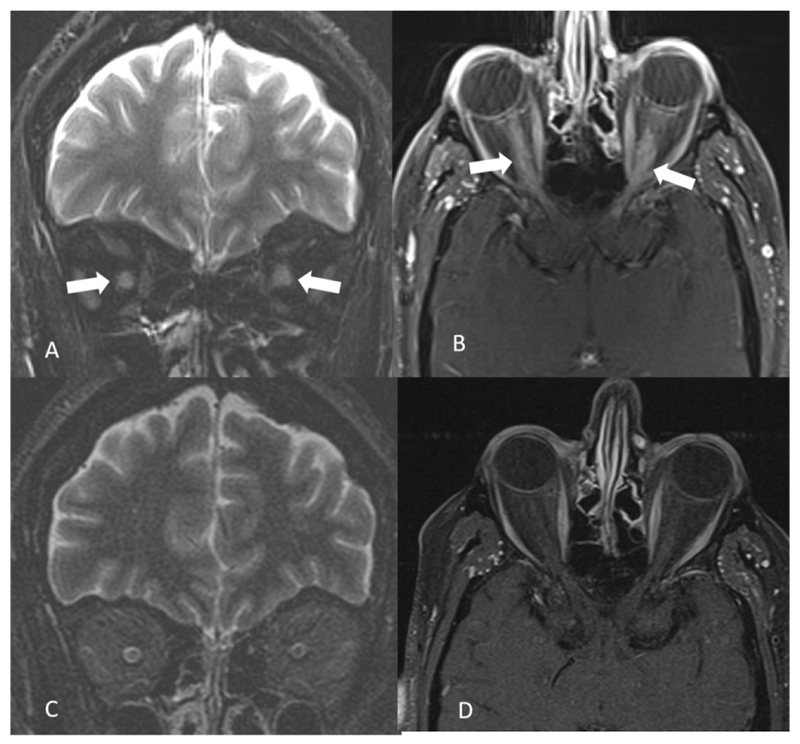
A 53-year-old MOGAD male presents with bilateral orbital pain and gradual loss of vision within 2 weeks. Coronal fat saturated T2 weighted image shows bilateral optic nerve hyperintensity and swelling (arrows in A). On fat saturated contrast enhanced T1 weighted image longitudinally extensive contrast enhancement is noted in bilateral optic nerves (arrows in B). Three months follow up orbital MRI shows complete resolution of the findings (C and D).
Twelve MOG patients (63%) had bilateral, simultaneous optic nerve involvement during their disease course, as opposed to only 3 (25%) in the AQP4 seropositive cohort.
Discussion.
In this study we characterized MRI imaging features of the brain, optic nerves, and spinal cord of patients with MOGAD and AQP4 seropositive NMOSD disease. Overall, the location of lesions in our population of MOG antibody disease patients was in line with previously published studies. We observed that the most commonly noted MRI findings were localized to the optic nerves associated with attacks of optic neuritis, which is the most frequent clinical presentation of MOGAD (11, 15, 18, 19). The most commonly noted finding on orbital MRI in MOGAD was T2 hyperintensity and gadolinium enhancement of orbital segment of bilateral optic nerves. Same finding was reported by Chen et al(20). On the other hand, the same study reported chiasmal and optic tract involvement in 12% and 2% respectively, as opposed to 8% and 0% in our study. The orbital segment was also the most frequently involved segment in AQP4 seropositive optic neuritis. Compared to MS, both MOG and AQP4 optic nerve lesions commonly extend into the intracanalicular and pre-chiasmic segments of the optic nerve as well (16, 21, 22). Similarly, bilateral optic neuritis was a feature that used to distinguish NMO from MS, but now it appears that bilateral optic neuritis is even more common in MOGAD (63%) than AQP4 NMOSD (25%). Our results are concordant with a similar finding by Kitley et al, where bilateral optic neuritis occured in up to 63% of MOG positive patients (7). Longitudinally extensive optic nerve lesions were common in both the MOGAD and AQP4 seropositive NMOSD cohorts, which also helps distinguish them from MS (16).
In a French study, similar to our study, the most and the least frequently involved locations of lesions on brain MRI in the MOGAD cohort, were in the deep white matter and the area postrema, respectively (18). In a German study, supratentorial deep white matter lesions was the most frequently involved location, observed in 47% of patients on final MRI (11). Deep white matter lesions were much less common in the AQP4 cohort and could be helpful in distinguishing MOG and AQP4 seropositive disease. Another feature that appears unique to MOGAD is leptomeningeal enhancement. Leptomeningeal enhancement was observed in 3 patients in one study [7] and one patient in another [8], and in three patients in our study. None of the AQP4 seropositive NMOSD had leptomeningeal enhancement. Moreover, cortical/juxtacortical lesions were only observed among our MOGARD cohort, unlike what was reported by Jurynczyk et al, who reported these lesions in AQP4 NMOSD (23). A unique feature of brain MRIs in NMOSD is the localization of lesions to the periependymal (3 patients), periaqueductal (4 patients) and hypothalamic (1 patient) areas, which were only observed among the AQP4 positive group, with no imaging abnormality noted in the same anatomic locations in the MOG positive cohort. Such findings can be explained by the high frequency of AQP4 distribution in these anatomic locations. Contrary to our findings, these locations couldn’t separate the two entities in a previous study (23).
In a Korean study, MOG patients showed less spinal cord involvement and fewer brain abnormalities compared to NMOSD and MS groups, which is also consistent with our findings (15). As opposed to our study, Jarius el al reported cervical cord to be the most frequently involved part of myelitis attacks in MOGAD patients (82.1% of patients), while in our study it was the least frequently involved (20%) (11). In a Dutch study, the thoracic cord was the most frequently involved segment (19). Although originally thought to be a seminal feature of MOG myelitis (24), isolated lesions of the conus medullaris was seen in four patients (40%) among our cohort (25). Conus involvement was also observed in 23.8% of AQP4 seropositive NMOSD patients, but only as part of more extensive thoracic cord involvement. Compared to MOGAD, cord atrophy was more pronounced in AQP4 seropositive NMOSD observed in 23.8% patients as opposed to 10% in the MOG positive group. Similar to the study by Dubey et al(24), longitudenally extensive myelitis was of not help distinguishing between the two diseases.
Resolution of abnormal T2 signal on MRI is not typical for NMOSD lesions associated with AQP4, but is more commonly seen in patients with MOGAD. Similar to our findings, five out of six MOG patients in the U.K. showed resolution of their brain lesions on follow up imaging in comparison to none in the NMO group (7). In our cohort, resolution of MOG brain lesions were limited to clinically asymptomatic lesions only while the symptomatic ones improved but did not resolve completely. On spine imaging, complete resolution of MOG spinal lesions was seen in 6/7 patients as observed over a median of 2 months after onset with one developing cord atrophy, similar to findings reported by Kitley et al reported in which 6 out of 7 MOG positive patients showed complete resolution of lesions within a median of 9.5 months, but no evidence of cord atrophy (7). In the same study, only one out of four AQP4 patients showed resolution of their cord abnormalities but none showed cord atrophy, while in our cohort 3/12 AQP4 patients showed resolution of their cord lesions with one showing cord atrophy on final MRI.
Longitudinally extensive lesions are more common in MOGAD attacks of the spinal cord than short lesions. Jarius et al reported longitudinally extensive lesions in the spinal cord at least once in 72.4% of German MOG patients and short segment myelitis in 41.3% of patients (11). These findings are similar to our results where we observed LETM in 70% of our cohort and short segment myelitis in 40%. In the same German study, 20 out of 28 patients had two simultaneous spinal cord lesions on the same MRI, compared to only 1 patient out of 24 among our cohort (11). Although it has been reported that a small percentage (7%) of MOGAD patients may present with short myelitis that can be confused with MS (26, 27), more than a third (40%) of our cohort experienced short segment involvement of their spinal cords. These findings may be due to a bias in testing for MOG antibody in patients with longitudinally extensive lesions over those with focal spinal cord lesions.
In conclusion, we identified distinct MRI features that could help clinicians favor one antibody testing over the other in a timely fashion especially in certain regions of the world where resources are limited: 1) cortical/juxta-cortical involvement on brain MRI points towards MOGAD, while area postrema, periependymal, periaqueductal and hypothalamic involvement favors AQP4; 2) cord atrophy on spine MRI points more towards AQP4 NMOSD, while lesion resolution with no evidence of cord atrophy advocates for MOG diagnosis; 3) isolated conus involvement would be more suggestive of MOG disease; and 4) bilateral optic neuritis favors MOG while development of residual atrophy would move AQP4 higher on the differential.
The main limitations of this study are that it is a retrospective analysis, and the number of active and follow up MRIs are few due to rarity of both diseases.
Table 4.
Orbital MRI characteristics of MOG antibody vs AQP4 seropositive NMOSD.
| Feature | MOG antibody disease, n=24 | AQP4 NMOSD, n= 12 | P value |
|---|---|---|---|
| Orbital T2 hyperintensity | 18 (75%) | 12 (100%) | 0.0793 |
| Canalicular T2 hyperintensity | 13 (54%) | 9 (75%) | 0.2925 |
| Prechiasmal T2 hyperintensity | 9 (37.5)% | 3 (25%) | 0.7091 |
| Chiasmal hyperintensity | 3 (12.5%) | 2 (16.7%) | 1 |
| Optic tract hyperintensity | 0 (0%) | 2 (16.7%) | 0.1048 |
| Enhancement | 24 (100%) | 8 (67%) | 0.0084 |
| Orbital | 19 (79%) | 7 (88%) | 1 |
| Canalicular | 14 (63%) | 6 (75%) | 0.676 |
| Prechiasmatic | 8 (33%) | 5 (63%) | 0.219 |
| Chiasmatic | 4 (8%) | 1 (13%) | 1 |
| Optic tracts | 0 (0%) | 1 (13%) | 0.250 |
Acknowledgments
Funding: This work was supported by a scholarship from the Egyptian ministry of higher education, JS-3725 (SS), as well as a grant from the National Institute of Neurological Disease and Stroke, R01-130548 (ML).
Footnotes
None of the authors has any conflict of interests to disclose.
References.
- 1.Oh J, Levy M. Neuromyelitis optica: an antibody-mediated disorder of the central nervous system. Neurol Res Int. 2012;2012:460825. [DOI] [PMC free article] [PubMed] [Google Scholar]
- 2.Wingerchuk DM, Banwell B, Bennett JL, Cabre P, Carroll W, Chitnis T, et al. International consensus diagnostic criteria for neuromyelitis optica spectrum disorders. Neurology. 2015;85(2):177–89. [DOI] [PMC free article] [PubMed] [Google Scholar]
- 3.Jiao Y, Fryer JP, Lennon VA, Jenkins SM, Quek AM, Smith CY, et al. Updated estimate of AQP4-IgG serostatus and disability outcome in neuromyelitis optica. Neurology. 2013;81(14):1197–204. [DOI] [PMC free article] [PubMed] [Google Scholar]
- 4.Jarius S, Ruprecht K, Kleiter I, Borisow N, Asgari N, Pitarokoili K, et al. MOG-IgG in NMO and related disorders: a multicenter study of 50 patients. Part 1: Frequency, syndrome specificity, influence of disease activity, long-term course, association with AQP4-IgG, and origin. J Neuroinflammation. 2016;13(1):279. [DOI] [PMC free article] [PubMed] [Google Scholar]
- 5.Probstel AK, Rudolf G, Dornmair K, Collongues N, Chanson JB, Sanderson NS, et al. Anti-MOG antibodies are present in a subgroup of patients with a neuromyelitis optica phenotype. J Neuroinflammation. 2015;12:46. [DOI] [PMC free article] [PubMed] [Google Scholar]
- 6.Kitley J, Woodhall M, Waters P, Leite MI, Devenney E, Craig J, et al. Myelin-oligodendrocyte glycoprotein antibodies in adults with a neuromyelitis optica phenotype. Neurology. 2012;79(12):1273–7. [DOI] [PubMed] [Google Scholar]
- 7.Kitley J, Waters P, Woodhall M, Leite MI, Murchison A, George J, et al. Neuromyelitis optica spectrum disorders with aquaporin-4 and myelin-oligodendrocyte glycoprotein antibodies: a comparative study. JAMA Neurol. 2014;71(3):276–83. [DOI] [PubMed] [Google Scholar]
- 8.Spadaro M, Gerdes LA, Krumbholz M, Ertl-Wagner B, Thaler FS, Schuh E, et al. Autoantibodies to MOG in a distinct subgroup of adult multiple sclerosis. Neurol Neuroimmunol Neuroinflamm. 2016;3(5):e257. [DOI] [PMC free article] [PubMed] [Google Scholar]
- 9.Akaishi T, Sato DK, Nakashima I, Takeshita T, Takahashi T, Doi H, et al. MRI and retinal abnormalities in isolated optic neuritis with myelin oligodendrocyte glycoprotein and aquaporin-4 antibodies: a comparative study. J Neurol Neurosurg Psychiatry. 2016;87(4):446–8. [DOI] [PubMed] [Google Scholar]
- 10.Ramanathan S, Prelog K, Barnes EH, Tantsis EM, Reddel SW, Henderson AP, et al. Radiological differentiation of optic neuritis with myelin oligodendrocyte glycoprotein antibodies, aquaporin-4 antibodies, and multiple sclerosis. Mult Scler. 2016;22(4):470–82. [DOI] [PubMed] [Google Scholar]
- 11.Jarius S, Ruprecht K, Kleiter I, Borisow N, Asgari N, Pitarokoili K, et al. MOG-IgG in NMO and related disorders: a multicenter study of 50 patients. Part 2: Epidemiology, clinical presentation, radiological and laboratory features, treatment responses, and long-term outcome. J Neuroinflammation. 2016;13(1):280. [DOI] [PMC free article] [PubMed] [Google Scholar]
- 12.Mariotto S, Ferrari S, Monaco S, Benedetti MD, Schanda K, Alberti D, et al. Clinical spectrum and IgG subclass analysis of anti-myelin oligodendrocyte glycoprotein antibody-associated syndromes: a multicenter study. J Neurol. 2017;264(12):2420–30. [DOI] [PMC free article] [PubMed] [Google Scholar]
- 13.Kitley J, Leite MI, Kuker W, Quaghebeur G, George J, Waters P, et al. Longitudinally extensive transverse myelitis with and without aquaporin 4 antibodies. JAMA Neurol. 2013;70(11):1375–81. [DOI] [PubMed] [Google Scholar]
- 14.Kim HJ, Paul F, Lana-Peixoto MA, Tenembaum S, Asgari N, Palace J, et al. MRI characteristics of neuromyelitis optica spectrum disorder: an international update. Neurology. 2015;84(11):1165–73. [DOI] [PMC free article] [PubMed] [Google Scholar]
- 15.Kim SM, Woodhall MR, Kim JS, Kim SJ, Park KS, Vincent A, et al. Antibodies to MOG in adults with inflammatory demyelinating disease of the CNS. Neurol Neuroimmunol Neuroinflamm. 2015;2(6):e163. [DOI] [PMC free article] [PubMed] [Google Scholar]
- 16.Mealy MA, Whetstone A, Orman G, Izbudak I, Calabresi PA, Levy M. Longitudinally extensive optic neuritis as an MRI biomarker distinguishes neuromyelitis optica from multiple sclerosis. J Neurol Sci. 2015;355(1-2):59–63. [DOI] [PMC free article] [PubMed] [Google Scholar]
- 17.Applegate KE, Tello R, Ying J. Hypothesis testing III: counts and medians. Radiology. 2003;228(3):603–8. [DOI] [PubMed] [Google Scholar]
- 18.Cobo-Calvo A, Ruiz A, Maillart E, Audoin B, Zephir H, Bourre B, et al. Clinical spectrum and prognostic value of CNS MOG autoimmunity in adults: The MOGADOR study. Neurology. 2018;90(21):e1858–e69. [DOI] [PubMed] [Google Scholar]
- 19.van Pelt ED, Wong YY, Ketelslegers IA, Hamann D, Hintzen RQ. Neuromyelitis optica spectrum disorders: comparison of clinical and magnetic resonance imaging characteristics of AQP4-IgG versus MOG-IgG seropositive cases in the Netherlands. Eur J Neurol. 2016;23(3):580–7. [DOI] [PubMed] [Google Scholar]
- 20.Chen JJ, Flanagan EP, Jitprapaikulsan J, Lopez-Chiriboga ASS, Fryer JP, Leavitt JA, et al. Myelin Oligodendrocyte Glycoprotein Antibody-Positive Optic Neuritis: Clinical Characteristics, Radiologic Clues, and Outcome. Am J Ophthalmol. 2018;195:8–15. [DOI] [PMC free article] [PubMed] [Google Scholar]
- 21.Khanna S, Sharma A, Huecker J, Gordon M, Naismith RT, Van Stavern GP. Magnetic resonance imaging of optic neuritis in patients with neuromyelitis optica versus multiple sclerosis. J Neuroophthalmol. 2012;32(3):216–20. [DOI] [PubMed] [Google Scholar]
- 22.Levin MH, Bennett JL, Verkman AS. Optic neuritis in neuromyelitis optica. Prog Retin Eye Res. 2013;36:159–71. [DOI] [PMC free article] [PubMed] [Google Scholar]
- 23.Jurynczyk M, Geraldes R, Probert F, Woodhall MR, Waters P, Tackley G, et al. Distinct brain imaging characteristics of autoantibody-mediated CNS conditions and multiple sclerosis. Brain. 2017;140(3):617–27. [DOI] [PubMed] [Google Scholar]
- 24.Dubey D, Pittock SJ, Krecke KN, Morris PP, Sechi E, Zalewski NL, et al. Clinical, Radiologic, and Prognostic Features of Myelitis Associated With Myelin Oligodendrocyte Glycoprotein Autoantibody. JAMA Neurol. 2019;76(3):301–9. [DOI] [PMC free article] [PubMed] [Google Scholar]
- 25.Sato DK, Callegaro D, Lana-Peixoto MA, Waters PJ, de Haidar Jorge FM, Takahashi T, et al. Distinction between MOG antibody-positive and AQP4 antibody-positive NMO spectrum disorders. Neurology. 2014;82(6):474–81. [DOI] [PMC free article] [PubMed] [Google Scholar]
- 26.Dos Passos GR, Oliveira LM, da Costa BK, Apostolos-Pereira SL, Callegaro D, Fujihara K, et al. MOG-IgG-Associated Optic Neuritis, Encephalitis, and Myelitis: Lessons Learned From Neuromyelitis Optica Spectrum Disorder. Front Neurol. 2018;9:217. [DOI] [PMC free article] [PubMed] [Google Scholar]
- 27.Sepulveda M, Armangue T, Martinez-Hernandez E, Arrambide G, Sola-Valls N, Sabater L, et al. Clinical spectrum associated with MOG autoimmunity in adults: significance of sharing rodent MOG epitopes. J Neurol. 2016;263(7):1349–60. [DOI] [PMC free article] [PubMed] [Google Scholar]


