

Abstract
Recent genome-wide association studies (GWAS) have found cerebellum as a top hit for sleep regulation. Restless legs syndrome (RLS) is a sleep-related sensorimotor disorder characterized by uncomfortable sensations in the extremities, generally at night, which is often relieved by movements. Clinical studies have found that RLS patients have structural and functional abnormalities in the cerebellum. However, whether and how cerebellar pathology contributes to sleep regulation and RLS is not known. GWAS identified polymorphisms in BTBD9 conferring a higher risk of sleep disruption and RLS. Knockout of the BTBD9 homolog in mice (Btbd9) and fly results in motor restlessness and sleep disruption. We performed manganese-enhanced magnetic resonance imaging on the Btbd9 knockout mice and found decreased neural activities in the cerebellum, especially in lobules VIII, X, and the deep cerebellar nuclei. Electrophysiological recording of Purkinje cells (PCs) from Btbd9 knockout mice revealed an increased number of non-tonic PCs. Tonic PCs showed increased spontaneous activity and intrinsic excitability. To further investigate the cerebellar contribution to RLS and sleep-like behaviors, we generated PC-specific Btbd9 knockout mice (Btbd9 pKO) and performed behavioral studies. Btbd9 pKO mice showed significant motor restlessness during the rest phase but not in the active phase. Btbd9 pKO mice also had an increased probability of waking at rest. Unlike the Btbd9 knockout mice, there was no increased thermal sensation in the Btbd9 pKO. Our results indicate that the Btbd9 knockout influences the PC activity; dysfunction in the cerebellum may contribute to the motor restlessness found in the Btbd9 knockout mice.
Keywords: Sleep, Restless legs syndrome, Btbd9, cerebellum, Purkinje cells
Introduction
Restless legs syndrome (RLS), also known as Willis-Ekbom disease, is a sleep-related sensorimotor disorder that affects up to 10% of the general population (Chen et al., 2019; Trenkwalder and Paulus, 2010). The sensory components of RLS include uncomfortable sensations and an urge to move. The motor components are characterized by movements to relieve the leg discomfort and by involuntary periodic leg movements (PLM) (Allen et al., 2014). The symptoms often occur at night and while lying at rest. The perturbation of the sleep cycle occurs commonly, affecting the patient's overall quality of life (Abetz et al., 2004; Giannaki et al., 2017).
To date, no neurodegeneration has been observed in RLS patients. However, imaging studies have found structural and functional alterations in multiple brain regions, including the cerebellum. A regional decrease of cerebellar gray matter volume has been shown with voxel-based morphometry (Chang et al., 2015). In another study, the activity of the anterior tibial muscle of RLS patients was recorded. There is a negative association between the sensory leg discomfort (SLC) and the tonic muscle activity, as well as the tonic muscle activity and the activation in the cerebellum (Spiegelhalder et al., 2008). The results indicate increased RLS-related subjective SLC and cerebellum activity during muscle relaxation at rest. In addition, the cerebellum is bilaterally activated both during SLC, and SLC combined with PLM conditions (Bucher et al., 1997; Margariti et al., 2012). Furthermore, cerebellar GABA levels are negatively correlated with both PLM indices and RLS severity in RLS subjects (Winkelman et al., 2014). In summary, these clinical studies suggest that RLS patients have increased activity within cerebellar circuits, which may be caused by the lower level of GABA and is correlated with sensory (SLC) and motor symptoms (PLM) (Winkelman et al., 2014).
As a region of emerging importance in sleep-wake regulation, the cerebellum has been found participating in the neuronal circuitry underlying the sleep-wake regulation and shows sleep stagedependent activity (Canto et al., 2017). In addition, recent GWAS identified the cerebellum as the top brain region for genes associated with circadian rhythms and sleep duration (Dashti et al., 2019; Jones et al., 2019a).
GWAS have also implicated up to nineteen risk loci, including BTBD9, as genetic risk factors of RLS (Schormair et al., 2017; Stefansson et al., 2007; Winkelmann et al., 2007). Other GWAS identified BTBD9 as an associated gene of sleep duration, sleep timing, and daytime sleepiness (Jones et al., 2019b; Wang et al., 2019). However, how the altered function of BTBD9 could lead to or contribute to RLS and sleep regulation are unclear. BTBD9 is ubiquitously expressed and codes for a protein belonging to the BTB (broad-complex, tramtack and bric à brac) protein family. Proteins of BTB family are involved in transcriptional regulation, cytoskeleton organization, regulation of ion channels, and protein ubiquitination (Stogios et al., 2005; Stogios and Prive, 2004). BTBD9 also contains a BACK (BTB and C-terminal Kelch) domain, which may play a role in substrate orientation in Cullin3-based E3 ligase complexes (Stogios et al., 2005). Cullin3 and some BTB proteins have been suggested to be important for dopaminergic and glutamatergic functions in the brain (Laezza et al., 2007; Rondou et al., 2008; Salinas et al., 2006; Schaefer and Rongo, 2006). Dysregulated iron homeostasis and dysfunctional dopaminergic system can lead to RLS (Ferre et al., 2019). One of the two original GWAS shows an association of the BTBD9 variant with serum ferritin concentration (Stefansson et al., 2007), which was replicated partially by others (Ji et al., 2018; Sorensen et al., 2012). Interestingly, both iron deficiency and excess of iron can cause impairments in the dopaminergic system (Jellen et al., 2012).
A quantitative trait loci (QTL) analysis in mice identified several QTLs related to the iron in the ventral midbrain, including one on mouse chromosome 17 that contains Btbd9 (Jones et al., 2003). Changes in hippocampal synaptic plasticity and neurotransmission have been found in Btbd9 (mouse homolog of human BTBD9 gene) knockout mice (DeAndrade et al., 2012b). Gene silencing of the BTBD9 homolog, dBTBD9, in fly has been used to understand the function of BTBD9 protein in RLS, and the flies were found to have increased motor activity, decreased dopamine levels, and fragmented sleep patterns (Freeman et al., 2012). Knockdown of dBTBD9 in subsets of dopaminergic neurons is able to reproduce these phenotypes, which are rescued by a dopamine receptor agonist pramipexole (Freeman et al., 2012). Additionally, over-expression of BTBD9 in HEK cells decreases iron-responsive element-binding protein, IRP2, and increases ferritin expression (Freeman et al., 2012). Similarly, Btbd9 knockout (KO) mice show motor restlessness, thermal hypersensitivity, increased serum iron level, and a disruption in sleep structure (DeAndrade et al., 2012a). The sensory deficit of Btbd9 KO mice can be rescued by a dopamine receptor agonist ropinirole (DeAndrade et al., 2012a). These studies indicate systematic Btbd9 KO mice as a viable genotypic RLS animal model to elucidate the pathophysiology of RLS and other sleep disorders (Allen et al., 2017; DeAndrade et al., 2012a; DeAndrade and Li, 2015).
We hypothesize that Btbd9 mutation leads to altered cerebellar activity that contributes to the disruption of sleep-like behaviors and pathogenesis of RLS. To test the hypothesis, we performed in vivo manganese-enhanced MRI (MEMRI) with the systematic Btbd9 KO mice to characterize abnormal cerebellar regions. This was followed by electrophysiological recordings to measure both intrinsic excitability and spontaneous firing activity of Purkinje cells (PCs). Finally, we generated a PC-specific Btbd9 KO mouse model to test if the loss of BTBD9 in PCs alone is sufficient to induce behavioral abnormalities, as we observed in the systematic Btbd9 KO mice.
Experimental Procedures
Mice
The experiments described here comply with the ARRIVE guidelines and are in accordance with the National Institute of Health Guide for the Care and Use of Laboratory Animals (NIH Publications No. 80-23) revised 1996. All mice used in the experiments were male adults unless specified in the text.
The generation of the systematic Btbd9 KO mice
The systematic Btbd9 KO mice used for imaging were described previously (DeAndrade et al., 2012a). The systematic Btbd9 KO mice for electrophysiological recordings and Western blot were generated from a line of mice imported from the European Mouse Mutant Archive (EMMA) (EMMA ID: 05554) as previously described (Lyu et al., 2019b). The mice were housed at 23-25 C under normal twelve hours light and twelve hours dark condition (12-LD). To confirm the loss of Btbd9 mRNA in the cerebellum, we dissected out the cerebellum from Btbd9 KO and their wildtype (WT) littermates, and flash froze the tissue in liquid nitrogen. RNA was isolated using an RNAeasy Mini kit (Qiagen) following the manufacturer’s instructions. cDNA was made subsequently with SuperScript III reverse transcriptase (Invitrogen). Btbd9 mRNA expression was detected by PCR primers specific to Btbd9 exons 4 and 5 (forward: GAC TCT TGT CTC CGG ATG CT; reverse: TCA CAA CCT GAG CCC CAT AC; Fig. 4A).
Figure 4.

Generation and molecular characterization of Btbd9 pKO mice. (A) No Btbd9 mRNA in the cerebellum of the Btbd9 KO mice. (B) Schematic diagram of the generation of the Btbd9 pKO mice. Filled boxes represent exons. Filled triangles indicate loxP sites. Open triangles indicate the FRT sites that were incorporated to remove the neo cassette. In Btbd9 pKO mice, exon 4 is deleted in PCs because cre is expressed specifically and the recombination occurs in the PCs. The red arrows indicate the sites of the PCR primers used to detect the recombination event. (C) Tissue-specific deletion of Btbd9 exon 4 in Btbd9 pKO mice was confirmed by PCR using DNA isolated from each brain region. The deletion (Δ) was detected only in the cerebellum (includes PCs) of Btbd9 pKO mice as predicted.
The generation of PC-specific Btbd9 knockout mice
The PC-specific Btbd9 knockout mice (Btbd9 pKO) were generated from Btbd9 loxP mice crossed with Pcp2-cre mice (Zhang et al., 2004) as described (Lyu et al., 2019b; Yokoi et al., 2012a; Yokoi et al., 2012b; Zhang et al., 2011). Mice doubly heterozygous for both Btbd9 loxP and Pcp2-cre were then crossed with Btbd9 loxP hetero- or homozygous mice to derive Btbd9 pKO mice and their control littermates, including WT littermates, Pcp2-cre+/− (animals only expressing Pcp2-cre) and Btbd9 loxP+/− (animals only having loxP sites in one allele) or Btbd9 loxP−/− (animals having loxP sites in both alleles). PCRs were used for genotyping the Pcp2-cre (forward: ATC TCC GGT ATT GAA ACT CCA GCG C; reverse: CAC TCA TGG AAA ATA GCG ATC) and loxP sites (forward: ACA TCA CCC ATT ACT TAG AAC CTC; reverse: CAC AGC TAT TTC CTG TCA TTC TGG ACA). To assess the specific deletion of Btbd9 in the cerebellum, we dissected out brain regions following the protocol (Spijker, 2011) and conducted PCR with primers specific for recombined locus (forward: AAG GCG CAT AAC GAT ACC ACG AT; reverse: TGG TGA TTC AAA TCT CCT TCC AAC ACA) (Fig. 4C). However, due to the lack of a high-quality BTBD9 antibody, we did not provide a direct indication of the specific missing of the BTBD9 protein in the Purkinje cells in the pKO mice. The Pcp2-cre mice we used (Zhang et al., 2004) are well-established and have been used extensively in at least 23 published original research studies based on citation analysis. Five out of 23 studies used fluorescent indicators to mark Pcp2-cre positive neurons. Six out of 23 articles did not assess protein or mRNA expression of the floxed gene. The Pcp2-cre mice appear to work with at least 26 different floxed loci.
Manganese-enhanced MRI
Data were collected at the same time and the same set of mice as previously described (Lyu et al., 2019b).
Electrophysiological recording
Slice preparation
Experiments were conducted using six WT male mice and six systematic Btbd9 KO male littermates around 8 months of age. The electrophysiological recordings were assessed by investigators who were blind to genotypes. Parasagittal brain slices (300 μm in thickness) were cut inside a chamber filled with ice-cold, oxygenated saline using a Vibratome (Leica VT 1000s). The concentrations of solutes in the holding chamber were (in mM): 180 sucrose, 2.5 KCl (potassium chloride), 1.25 NaH2PO4 (monosodium phosphate), 25 NaHCO3 (sodium bicarbonate), 10 D-glucose, 1 CaCl2 (calcium chloride), and 10 MgCl2 (magnesium chloride). The slices were recovered for 60 minutes at 35°C in a holding chamber with oxygenated artificial cerebrospinal fluid (ACSF; in mM: 126 NaCl, 2.5 KCl, 1.25 NaH2PO4, 25 NaHCO3, 2 MgCl2, 2 CaCl2, and 10 D-glucose). The slices were then incubated at room temperature until electrophysiological recording.
Cell-attached recordings
The slices were transferred to a recording chamber with ACSF continuously perfused and bubbled by 5% CO2 and 95% O2 at a rate of 1.5 ml/minute while being visualized with an upright microscope (Zeiss, Germany) using a 40× water-immersion objective with infrared optics. The temperature was kept at 34.5–35.5°C. PCs from the apex and bank of lobules IV to VI of the cerebellums were randomly selected and recorded.
Cell-attached recordings were performed with a K-gluconate-based internal solution with the following concentrations (in mM) of: 112.5 K-gluconate, 4 NaCl, 17.5 KCl, 0.5 CaCl2, 5 MgATP (adenosine 5'-triphosphate magnesium salt), 1 NaGTP (adenosine 5'-triphosphate sodium salt), 5 EGTA (ethylene glycol-bis(β-aminoethyl ether)-N,N,N’,N’-tetraacetic acid), 10 HEPES (4-(2-hydroxyethyl)-1-piperazineethanesulfonic acid); with pH of 7.2 (270–280 mOsm) and resistance of 5–10 MΩ. Positive pressure was applied to the patch electrode as it approached the PC. Suction was applied to the electrode to create a seal (> 5 GΩ) between the recording pipette and the cell membrane. Action potential (AP) current was recorded in a voltage-clamp mode that was maintained at an average of 0 pA holding current. Picrotoxin (10 μM) and CGP55845 (1 μM) were used to block inhibitory synaptic transmission, while kynurenic acid (5mM) was used to block excitatory synaptic transmission (Fremont et al., 2017).
Whole-cell recordings
After breaking through the cell membrane, access resistance was maintained throughout at <15 MΩ. Resting membrane potential was recorded in current-clamp mode. AP for current step recording was triggered using depolarizing current steps of 300 ms.
All experiments were conducted at 35±0.5°C by a dual automatic temperature controller (TC-344B). Cell-attached and whole-cell recordings were obtained from PCs using Axopatch 1D Amplifier (Molecular Devices). Electrophysiological recording data were acquired using pCLAMP 10 software (Molecular Devices). Signals were filtered at 5 kHz, digitized at 10 kHz with a DigiData 1440 (Molecular Devices). Cell firing activity was derived using the Mini Analysis Program. All data had been adjusted with the liquid junction potential.
Behavioral studies
Continuous open field
Six male Btbd9 pKO mice and seven male control littermates with an average age of 3 months were maintained on 12-LD for 7 days. As described previously (Lyu et al., 2019a; Meneely et al., 2018), each mouse was placed in a VersaMax Legacy open field apparatus with sufficient corncob bedding, food, and water. The apparatus has infrared sensors along the walls that detect any breaks in the beams, which are then decoded by VERSDATA software (version 2.70-127E, AccuScan Instruments Inc.) into behavioral outputs. The data were recorded every 15 minutes throughout 7 days. Data from the first three days were excluded because the animals were acclimating to the device. Data processing was done as previously described (Lyu et al., 2019b; Lyu et al., 2020). Briefly, to compare the total distance traveled between Btbd9 pKO and WT mice, we separated the data into light and dark phases because mice are nocturnal. Each phase contains 4 periods, from day 4 to day 7, or night 4 to night 7. The distance traveled during each period was added up from the 15 min bins. To compare the probability of waking between the two groups, we recoded the data according to the total distance traveled during each 15 min bin. Although an immobile mouse may or may not be asleep, if the total distance traveled during the 15 min was “0”, the mouse was assumed as sleeping and coded as “0”; otherwise, the mouse was considered as awake, and coded as “1”. The method was established and validated by others (Davies et al., 2017; Singh et al., 2019). A similar method of activity-based sleep estimation was applied to humans. Pubmed search using the keywords “accelerometer” and “sleep” produced 144 articles for human studies from January 1st, 2019 to April 26, 2020. It appears activity-based method is widely used to estimate sleep with the caveat that actual sleep and immobility may commingle (Acosta et al., 2019; Dashti et al., 2019; Devine et al., 2019; Ettore et al., 2019; Jones et al., 2019b; Kessler et al., 2019; Kuula et al., 2019; Lane et al., 2019; Papandreou et al., 2019; Wendt et al., 2020).
Wheel running
Nine male Btbd9 pKO mice and eleven male control littermates with an average age of 6 months were maintained on 12-LD for seven days. Wheel running activity was recorded as the number of wheel revolutions in 5 minutes bins using Lafayette Instrument Activity Wheel Monitors. The activity from the last 4 days was included in the data analysis, grouped by light and dark phases.
Tail flick
Ten male Btbd9 pKO mice and eleven male control littermates with an average age of 8 months were tested for the sensitivity to warm stimuli using the Tail Flick Analgesia Meter (San Diego Instruments) as previously described (DeAndrade et al., 2012a). Briefly, each mouse was placed in an acrylic restrainer with the distal end of its tail protruding under a heat lamp. The lamp, together with a timer, was turned on, both of which stopped automatically when the mouse flicked its tail away from the light. The latency to respond was limited to 30 seconds to prevent injury to the mouse.
Statistical analysis
Brain images were acquired and analyzed as previously reported (Lyu et al., 2019b; Perez et al., 2013). Mean number of voxels for each region of interest (ROI) was compared by an unpaired two-tailed t-test (homoscedastic variances, α ≤ 0.05). Other data were tested for normality first using the SPSS statistical package. Tiring frequency obtained by injection of step currents, spontaneous firing data, tonic/non-tonic cell distribution, continuous open field, and wheel running data were not normally distributed and analyzed by generalized mixed model ANOVA (GENMOD, SAS statistical package). For tonic/non-tonic cell distribution analysis, GENMOD with binomial distribution was used. The tail-flick data were normally distributed and therefore analyzed by mixed model ANOVA and repeated measurement ANOVA (SAS). Age was used as a continuous variable in both GENMOD and ANOVA. The hourly activities in Figures 5 and 6 were processed as described previously (Lyu et al., 2019b; Lyu et al., 2020). Briefly, for Figure 5, we summed the interval counts during each hour for each animal. Wheel-running activity during the last 96 hours was analyzed. Therefore, each animal had 4 data points for each hour. The mean interval counts within each hour were calculated for each genotype. The p values, derived from the unpaired Student’s t-test, were marked above hours in the figure. For figure 6A, we summed the total distance traveled during each hour for each animal and did the rest the same as the wheel-running test (Fig. 5) described above. To generate the hourly probability of waking in Figure 6B, we determined the sleep status by the total distance traveled during 15 min in the continuous open field test, as mentioned above. Therefore, there were 4 data points for each animal during each hour, which were coded from 1 to 4 as “sample”. The open field activity of the last 4 days was analyzed. Hence each animal had 4 days of data, which were coded from 4 to 7 as “period”. The probability of waking was compared between pKO mice and controls during each hour using SAS GENMOD with a binomial distribution and with repeated measurement of period and sample. The significant p values were marked above hours in the figure.
Figure 5.
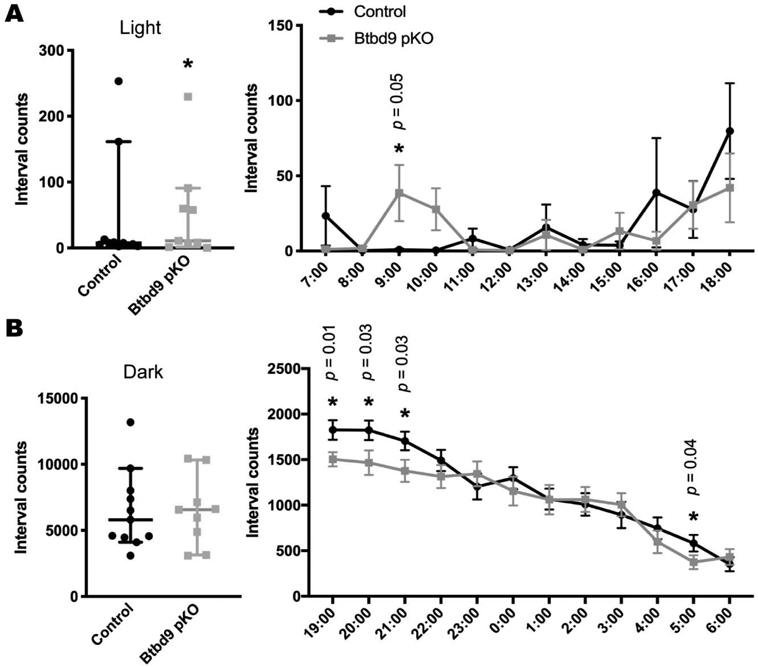
Wheel running test of Btbd9 pKO mice. Btbd9 pKO mice (n=9, 4 periods), compared with the controls (n=11, 4 periods), showed an increased level of activity in the wheel running test specifically during the light phase (A), but not during the dark phase (B). Detailed hourly activities were presented next to the related scatter plots. Scatter plots were presented as median with 95% CIs. Each dot in the scatter plots is an averaged value from 4 periods for each animal. Significant p values are marked above the corresponding time points. *, p ≤ 0.05.
Figure 6.
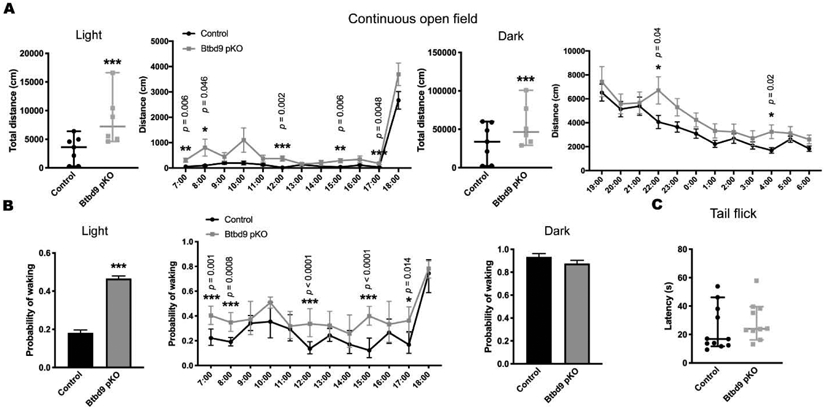
Continuous open field and tail-flick tests of Btbd9 pKO mice. (A) Btbd9 pKO mice (n=6, 4 periods) showed an increased level of activity in the continuous open field test both during the light phase and during the dark phase, compared with the control group (n=7, 4 periods). Detailed hourly activities were presented next to the corresponding scatter plots. (B) Btbd9 pKO mice showed an increased probability of waking during the light phase, but not during the dark phase, in the continuous open field test. A detailed hourly probability of waking was presented next to the corresponding histogram. (C) Btbd9 pKO mice (n=10, 3 trials) did not have sensory deficit compared with the controls (n=11, 3 repeats) in the tail-flick test. Scatter plots and histograms were presented as median with 95% CIs. Each dot in the scatter plots is an averaged value from 4 periods or 3 trials for each animal. Significant p values are marked above the corresponding time points. ***, p ≤ 0.001 **, p ≤ 0.01, *, p ≤ 0.05.
Results
Decreased cerebellar neural activity in the systematic Btbd9 KO mice
MEMRI has been extensively used to detect Ca2+-dependent synaptic activity (Chiu et al., 2015; Dudek et al., 2015; Hsu et al., 2008; Lu et al., 2007; Perrine et al., 2015). Mn2+ penetrates active synapses through voltage-gated calcium channels as a calcium analog (Fukuda and Kawa, 1977; Narita et al., 1990) and is sequestered and transported transynaptically either antero- or retrogradely across active neural circuits (Murayama et al., 2006; Pautler et al., 1998; Saleem et al., 2002; Sloot and Gramsbergen, 1994; Takeda et al., 1998a; Takeda et al., 1998b). The presence of the paramagnetic Mn2+ ion in the brain increases longitudinal relaxation rates and enhances signal intensity in T1 weighted scans, and is utilized for functional mapping of synaptic activity (Duong et al., 2000). Here, after intraperitoneal injection of Mn2+ into the mice, the images of ROI were acquired (Fig. 1A). These ROIs were further parceled into smaller sub-sections for subsequent qualitative inspection of neural activity. In Btbd9 KO mice the activated number of voxels were generally decreased in the cerebellar region, especially in the lobules VIII, lobules X and the deep cerebellar nuclei (DCN) (Fig. 1B, p < 0.05, unpaired two-tailed t-test). The result suggests Btbd9 KO mice have a lower level of neural activity in certain cerebellar regions.
Figure 1.

MEMRI recordings of neural activity in cerebellar regions of the systematic Btbd9 KO mice (n=6) and their WT littermates (n=8). Btbd9 KO mice had significantly decreased neural activity in cerebellar lobules VIII, cerebellar lobules X and deep cerebellar nuclei. Cb: cerebellum lobules; 7N: facial nucleus; Cer: cerebellar nuclear area; Sim: Simple lobule. Bars represent means plus standard error of means (SEMs). *, p ≤ 0.05.
Increased percentage of non-tonic PCs and spontaneous activity in tonic PCs of the systematic Btbd9 KO mice
PCs constitute the sole output of the cerebellum. They send inhibitory output to the DCN, which connects to the thalamus, then to the striatum and cortical areas that modulate movement and sensation (D'Mello and Stoodley, 2015). PCs either fire at a relatively constant rate, tonic firing, or intermittently with pauses separating the firing periods, non-tonic firing (Engbers et al., 2013; Loewenstein et al., 2005; Womack and Khodakhah, 2002; Yartsev et al., 2009). Here, we grouped those cells without pause of the spontaneous firing lasting for more than 300 msec during the cell-attached patch-clamp as tonic cells (Tian et al., 2013) and otherwise as non-tonic cells. To understand how the loss of BTBD9 affects the function of PCs, we firstly employed cell-attached recording to monitor the spontaneous activity of PCs in both Btdb9 KO and WT mice (Fig. 2A). There was a significant increase in the percentage of non-tonic PCs in the Btbd9 KO mice (Fig. 2A, table at the bottom, p = 0.002, GENMOD with a binomial distribution). Analysis of passive membrane properties revealed that Btbd9 KO PCs had no changes in the membrane potential (Supplementary Fig. 1A, p = 0.27, ANOVA) and resistance (Supplementary Fig. 1C, p = 0.13, ANOVA), but showed decreased capacitance (Supplementary Fig. 1B, p = 0.049, ANOVA) compared with WT PCs. Membrane capacitance is proportional to the membrane surface area (Golowasch et al., 2009). Membrane resistance is a function of the number of open ion channels (Holmes et al., 1992). Our results indicate that KO PCs were smaller in size. When comparing the firing activity of both tonic and non-tonic cells together, we did not find significant differences in the frequency (Fig. 2B, left panel, p = 0.28, GENMOD with a gamma distribution) nor the coefficients of variation (CV; Fig. 2B, right panel, p = 0.34, GENMOD with a gamma distribution) of the spontaneous firing between the Btbd9 KO and WT groups. However, the spontaneous firing frequency of the tonic cells was significantly increased (Fig. 2C, left panel, p = 0.04, GENMOD with a gamma distribution) but CV was unchanged in Btbd9 KO mice (Fig. 2C, right panel, p = 0.71, GENMOD with a gamma distribution). Both firing frequency (Fig. 2D, left panel, p = 0.79, GENMOD with a gamma distribution) and CV (Fig. 2D, right panel, p = 0.91, GENMOD with a gamma distribution) of non-tonic cells remained unchanged between the two groups.
Figure 2.
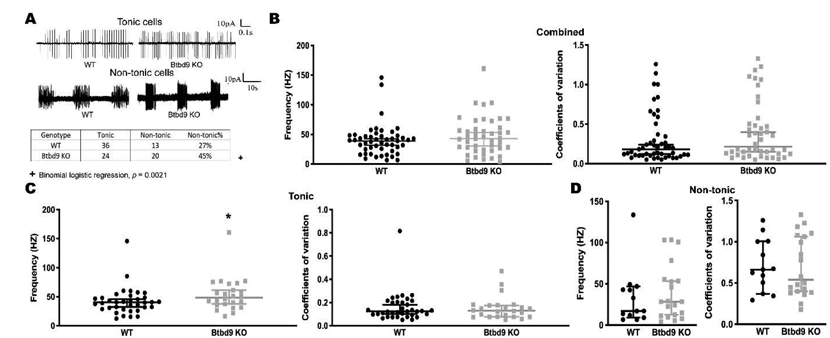
Cell-attached recording of PCs of the systematic Btbd9 KO mice (n=6) and their WT littermates (n=6). (A) Representative spontaneous activity traces of WT and Btbd9 KO in acute brain slides. The percentage of non-tonic cells showed a significant increase with Btbd9 knockout. (B) Both spontaneous firing frequency and coefficients of variation were not changed between Btbd9 KO (n=49) and WT (n=44) PCs. (C) The spontaneous firing frequency was significantly higher in Btbd9 KO tonic cells (n=24) compared with the WTs (n=36), while the coefficient of variation was not changed in Btbd9 KO tonic cells. (D) There was no change in either spontaneous firing frequency or regularity between Btbd9 KO non-tonic PCs (n=30) and the WT non-tonic PCs (n=13). The data in B-D are presented as the median with the 95% confidence intervals (CIs). *, p ≤ 0.05.
Increased intrinsic excitability in tonic PCs of the systematic Btbd9 KO mice
Next, we performed the whole-cell current-clamp recordings of identified tonic and non-tonic cells in both Btbd9 KO and WT mice (Fig. 3A). By stimulating with depolarizing current steps and measuring firing frequency as a function of current step amplitude, we found that PCs of Btbd9 KO mice, overall, fired at a similar frequency in response to the applied step currents (Fig. 3B, p = 0.33, GENMOD with a negative binomial distribution) compared with WT PCs. When separately analyzed, tonic PCs of Btbd9 KO mice exhibited a significantly higher intrinsic excitability (Fig. 3C, p = 0.04, GENMOD with a negative binomial distribution) compared with WT tonic PCs. In contrast, non-tonic PCs of Btbd9 KO mice did not differ from those of WT PCs (Fig. 3D, p = 0.70, GENMOD with a negative binomial distribution). The results indicate that the loss of BTBD9 increased the intrinsic excitability of the tonic PCs.
Figure 3.
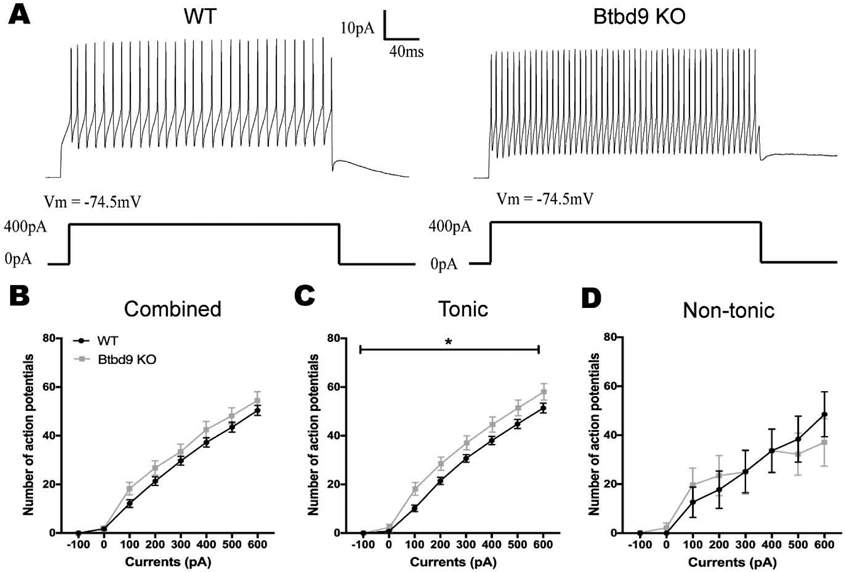
Whole-cell recording of PCs of the systematic Btbd9 KO mice (n=6) and their WT littermates (n=6). (A) Representative traces with stimulation at 400pA. (B) PCs of Btbd9 KO mice (n=31) fired at a similar level of frequency as that of the WTs (n=37) in response to the stimulation. (C) Tonic PCs of Btbd9 KO mice (n=22) had a significantly higher simulative firing frequency than that of the WTs (n=29). (D) Non-tonic PCs of Btbd9 KO mice (n=9) did not show a difference in response to the introduced step currents compared with that of the WTs (n=8). Data at each current step represent means plus SEMs. *, p ≤ 0.05.
Finally, Btbd9 mRNA expression was assessed in both Btbd9 KO and WT mice. Btbd9 cDNA was not detectable in the cerebellum of the KO mice (Fig. 4A).
Generation and behavioral analysis of Btbd9 pKO mice
A principal feature of RLS is the desire to move. Previous phenotypic mouse or fruit fly models of RLS have shown altered activity levels and sleep disruption (DeAndrade et al., 2012a; Freeman et al., 2012). Therefore, to test if PC-specific Btbd9 KO contributes to these phenotypes, we generated Btbd9 pKO mice using the Cre-loxP system (Fig. 4B). To confirm the tissue specificity of the knockout, we dissected out different brain regions from the Btbd9 pKO mice and their controls. DNAs were extracted from different brain regions, and PCR reactions were conducted. Only the DNA extracted from the cerebellum of Btbd9 pKO mice showed the recombined band (Fig. 4C), indicating the knockout was restricted to the cerebellum.
Next, we assessed the voluntary activity level of the strain by the wheel running test. The activity level of Btbd9 pKO mice showed a significant increase during the light phase (Fig. 5A, light phase, p = 0.04, GENMOD with a negative binomial distribution), when the animals are normally sleeping or resting, but no change during the dark phase, when the animals are usually active (Fig. 5B, dark phase, p = 0.92, GENMOD with a negative binomial distribution). Hourly analysis indicated that the wheel running activity of Btbd9 pKO mice was especially high at 9:00 AM (Fig. 5A) and especially low during the 1st half of the active phase (Fig. 5B). With a continuous open field, we examined the total activity of the mice. Similarly, the activity level of Btbd9 pKO mice showed a significant increase during the rest phase (Fig. 6A, light phase, p < 0.0001, GENMOD with a gamma distribution), and during the active phase (Fig. 6A, dark phase, p < 0.0001, GENMOD with a gamma distribution). Different from the wheel running study, continuous open field tests showed that Btbd9 pKO mice were more active throughout the time during both day and night (Fig. 6A). In addition, analysis of sleep-like behaviors indicates an increased probability of waking of the Btbd9 pKO mice in the rest phase (Fig. 6B, left panel, p < 0.0001, GENMOD with a binomial distribution), especially at 7:00 AM, 8:00 AM, and the 2nd half of the rest phase, but not in the active phase (Fig. 6B, right panel, p = 0.10, GENMOD with a binomial distribution). The results suggest that there is a significant increase in day-time activity in the Btbd9 pKO mice. Loss of the BTBD9 protein only in PCs can lead to a circadian components-dependent motor restlessness.
RLS patients usually have uncomfortable sensations in the legs that are associated with the urge to move. Therefore, we tested the Btbd9 pKO mice for abnormalities in the sensory system using the tail-flick test. There was no significant difference between the Btbd9 pKO mice and their control littermates in the latency to withdraw from the heat stimuli (Fig. 6C, p = 0.35, GENMOD with a gamma distribution). Hence Btbd9 pKO mice did not have increased thermal sensation as reported in the systematic Btbd9 KO mice.
Discussion
The function of Btbd9 and how the mutations lead to the symptoms of the RLS patients are not fully understood. The cerebellum is widely known to participate in movement control and receives increasing attention for its role in sleep regulation (Canto et al., 2017). In addition, brain imaging studies indicate that RLS patients have structural and functional abnormalities in their cerebella (Bucher et al., 1997; Chang et al., 2015; Margariti et al., 2012; Spiegelhalder et al., 2008; Winkelman et al., 2014). Here, we utilized a previously generated systematic Btbd9 KO mice, which exhibit several symptoms observed in RLS patients (DeAndrade et al., 2012a), and a newly-created PC-specific Btbd9 KO mouse model to test the role of the cerebellum in sleep disorders, especially RLS. Our results demonstrated that systematic Btbd9 KO had decreased neural activity in the cerebellum, more non-tonic PCs, and increased excitability of tonic PCs. Sole BTBD9 deficiency in PCs can cause increased activity during the rest phase. However, specifically knocking out Btbd9 in PCs is not sufficient for the development of sensory deficit. The results presented here highlight the importance of the cerebellum, especially the PCs, in the motor restlessness and sleep disruption observed in the Btbd9 KO mice. Although earlier studies from other groups have validated the use of continuous monitoring as a noninvasive alternative for sleep estimation for rodents (Davies et al., 2017; Singh et al., 2019), the limitation of the current study is the lack of sleep analysis by polysomnography.
PCs send inhibitory output to the DCN (Han et al., 2014). Therefore, the increased excitability of PCs revealed by electrophysiological recording (Fig. 2 and 3) is consistent with decreased neural activity in the DCN that we observed in our brain imaging experiment (Fig. 1). Additionally, it has been found that Cav1.2, a subunit of the voltage-gated Ca2+ channel, is highly involved in neuronal Mn2+ influx after systemic injections (Bedenk et al., 2018). Reduced MEMRI signal in the DCN indicates a lower activity level of Cav1.2, which may result from increased PC firing. The DCN inhibits the activity of thalamus, which excites the cerebral cortex. It can be postulated that decreased neural activity in the DCN will lead to altered activity in the thalamus and cerebral cortex, both of which have been shown to have structural or functional alterations in RLS patients (Rizzo et al., 2017). Moreover, the dentate nucleus of the cerebellum has a disynaptic projection to the striatum (Chen et al., 2014; Hoshi et al., 2005; Ichinohe et al., 2000). The striatal dopaminergic system has also been shown to have functional alterations in RLS patients (Cervenka et al., 2006; Connor et al., 2009; Earley et al., 2014; Earley et al., 2011; Earley et al., 2013; Kim et al., 2012; Michaud et al., 2002; Montplaisir et al., 1991; Okun et al., 2005; Ruottinen et al., 2000; Turjanski et al., 1999). Taken together, our results suggest that hyperactive PCs may alter the sensorimotor integration through multi-synaptic loops existing among the cerebellum, striatum, and cerebral cortex.
Btbd9 pKO mice showed circadian rhythm-dependent hyperactivity similar to the systematic Btbd9 KO mice and RLS patients. Previously, extensive studies have linked RLS to the spinal cord (Clemens et al., 2006), A11 dopaminergic neurons (Qu et al., 2007), the thalamus (Allen et al., 2013; Rizzo et al., 2012), cortical excitability (Lanza et al., 2017), corticostriatal pathways (Yepes et al., 2017), the ventral tegmentum (Connor et al., 2009) and the striatum (DeAndrade et al., 2012a; Lai et al., 2017; Lyu et al., 2019b). Here, we emphasized the role of the cerebellum in the generation of motor and sleep symptoms of RLS. The cerebellum is known to be essential for maintaining kinetic movement mechanisms (Heiney et al., 2014). It has been suggested that dysregulated PC firing may cause an irregularity in DCN activity (De Schutter and Steuber, 2009), which contributes to the generation of movement disorders (Goodkin and Thach, 2003; Sarnaik and Raman, 2018; White and Sillitoe, 2017). It is interesting that continuous open field mimics RLS-like behaviors better than the wheel-running experiment, possibly because wheel running assesses the voluntary activities of mice, which are influenced by motivation and reward systems (Novak et al., 2012). Interestingly, Btbd9 pKO mice did not show a sensory deficit. It is possible that the motor restlessness of RLS is independent of sensory abnormalities, which is consistent with the fact that not all RLS patients have sensory deficits (Garcia Borreguero et al., 2017). The cerebellum is wellconnected to the thalamus, which is critically involved in both arousal regulation and sensory function. Thalamus of RLS patients has been found to have a higher level of glutamatergic activity (Allen et al., 2013) and a lower level of endogenous opioids (Walters et al., 2009). Lack of sensory deficit observed in pKO mice may be caused by compensatory effects from other parts of the multi-synaptic loops existing among the cerebellum, striatum, and cerebral cortex. Hence, abnormal neural activity or circuit architecture in the cerebellum may serve as a key for the pathogenesis of RLS.
Our work is consistent with the role of BTBD9 and cerebellum in sleep regulation. GWAS studies have identified the cerebellum as a top hit for sleep-wake regulation (Dashti et al., 2019; Jones et al., 2019a). In addition, BTBD9 has also been implied to be associated with sleep duration, sleep timing and daytime sleepiness (Jones et al., 2019b; Wang et al., 2019). Previously, systematic Btbd9 KO mice showed increased awake time and increased number of wake bouts per hour during the rest phase in the polysomnographic study (DeAndrade et al., 2012a). Here, by the noninvasive continuous open field monitoring, we observed that specific knockout of Btbd9 in the cerebellum led to an increased probability of waking during the rest phase, especially the first 2 hours. The result indicates that pKO mice seem to have a shorter sleep duration, immobility, or both. Btbd9 mutation targeted to the cerebellum may be sufficient to cause abnormal sleep-like behaviors.
Supplementary Material
Highlights:
The systematic Btbd9 KO mice had decreased neural activity in the cerebellum.
Btbd9 KO mice had more non-tonic Purkinje cells.
Tonic Purkinje cells in Btbd9 KO mice had increased spontaneous firing and intrinsic excitability.
Purkinje cell-specific Btbd9 KO mice were restless at rest but had no sensory deficit.
Purkinje cell-specific Btbd9 KO mice had an increased probability of waking at rest.
Acknowledgments:
We thank Drs. Tom Otis, Indira Raman, and Bruce Bean for teaching the Purkinje cell patch-clamp recording in brain slices, and Dr. Jinbin Tian from Dr. Michael Zhu’s lab for the recording of PCs. We acknowledge the support from the National High Magnetic Field Laboratory’s Advanced Magnetic Resonance Imaging & Spectroscopy (AMRIS) Facility (National Science Foundation Cooperative Agreement No. DMR-1157490 and the State of Florida).
Funding: This work was supported by the National Institute of Health (NS082244, NS065273), and the Restless Legs Syndrome Foundation.
Abbreviations:
- 12-LD
normal twelve hours light and twelve hours dark condition
- Btbd9 pKO
the PC-specific Btbd9 knockout mice
- CI
confidence interval
- CV
coefficients of variation
- DCN
deep cerebellar nuclei
- EMG
electromyogram
- GWAS
genome-wide association studies
- MEMRI
manganese-enhanced MRI
- PCs
Purkinje cells
- PLM
periodic leg movements
- RLS
restless legs syndrome
- SLC
sensory leg discomfort
- WT
wildtype
Footnotes
Conflict of interest: None.
Publisher's Disclaimer: This is a PDF file of an unedited manuscript that has been accepted for publication. As a service to our customers we are providing this early version of the manuscript. The manuscript will undergo copyediting, typesetting, and review of the resulting proof before it is published in its final form. Please note that during the production process errors may be discovered which could affect the content, and all legal disclaimers that apply to the journal pertain.
References:
- Abetz L, et al. , 2004. Evaluating the quality of life of patients with restless legs syndrome. Clin Ther. 26, 925–35. [DOI] [PubMed] [Google Scholar]
- Acosta FM, et al. , 2019. Sleep duration and quality are not associated with brown adipose tissue volume or activity-as determined by 18F-FDG uptake, in young, sedentary adults. Sleep. 42. [DOI] [PMC free article] [PubMed] [Google Scholar]
- Allen RP, et al. , 2013. Thalamic glutamate/glutamine in restless legs syndrome: increased and related to disturbed sleep. Neurology. 80, 2028–34. [DOI] [PMC free article] [PubMed] [Google Scholar]
- Allen RP, et al. , 2017. Animal models of RLS phenotypes. Sleep Med. 31, 23–28. [DOI] [PMC free article] [PubMed] [Google Scholar]
- Allen RP, et al. , 2014. Restless legs syndrome/Willis-Ekbom disease diagnostic criteria: updated International Restless Legs Syndrome Study Group (IRLSSG) consensus criteria-- history, rationale, description, and significance. Sleep Med. 15, 860–73. [DOI] [PubMed] [Google Scholar]
- Bedenk BT, et al. , 2018. Mn(2+) dynamics in manganese-enhanced MRI (MEMRI): Cav1.2 channel-mediated uptake and preferential accumulation in projection terminals. Neuroimage. 169, 374–382. [DOI] [PubMed] [Google Scholar]
- Bucher SF, et al. , 1997. Cerebral generators involved in the pathogenesis of the restless legs syndrome. Ann Neurol. 41, 639–45. [DOI] [PubMed] [Google Scholar]
- Canto CB, et al. , 2017. The Sleeping Cerebellum. Trends Neurosci. 40, 309–323. [DOI] [PubMed] [Google Scholar]
- Cervenka S, et al. , 2006. Support for dopaminergic hypoactivity in restless legs syndrome: a PET study on D2-receptor binding. Brain. 129, 2017–28. [DOI] [PubMed] [Google Scholar]
- Chang Y, et al. , 2015. Gray matter alteration in patients with restless legs syndrome: a voxel-based morphometry study. Clin Imaging. 39, 20–5. [DOI] [PubMed] [Google Scholar]
- Chen CH, et al. , 2014. Short latency cerebellar modulation of the basal ganglia. Nat Neurosci. 17, 1767–75. [DOI] [PMC free article] [PubMed] [Google Scholar]
- Chen P, et al. , 2019. Caenorhabditis elegans and its applicability to studies on restless legs syndrome. Adv Pharmacol. 84, 147–174. [DOI] [PMC free article] [PubMed] [Google Scholar]
- Chiu CH, et al. , 2015. Effect of MDMA-Induced Axotomy on the Dorsal Raphe Forebrain Tract in Rats: An In Vivo Manganese-Enhanced Magnetic Resonance Imaging Study. PLoS One. 10, e0138431. [DOI] [PMC free article] [PubMed] [Google Scholar]
- Clemens S, et al. , 2006. Restless legs syndrome: revisiting the dopamine hypothesis from the spinal cord perspective. Neurology. 67, 125–30. [DOI] [PubMed] [Google Scholar]
- Connor JR, et al. , 2009. Altered dopaminergic profile in the putamen and substantia nigra in restless leg syndrome. Brain. 132, 2403–12. [DOI] [PMC free article] [PubMed] [Google Scholar]
- D’Mello AM, Stoodley CJ, 2015. Cerebro-cerebellar circuits in autism spectrum disorder. Front Neurosci. 9, 408. [DOI] [PMC free article] [PubMed] [Google Scholar]
- Dashti HS, et al. , 2019. Genome-wide association study identifies genetic loci for self-reported habitual sleep duration supported by accelerometer-derived estimates. Nat Commun. 10, 1100. [DOI] [PMC free article] [PubMed] [Google Scholar]
- Davies B, et al. , 2017. A point mutation in the ion conduction pore of AMPA receptor GRIA3 causes dramatically perturbed sleep patterns as well as intellectual disability. Hum Mol Genet. 26, 3869–3882. [DOI] [PMC free article] [PubMed] [Google Scholar]
- De Schutter E, Steuber V, 2009. Patterns and pauses in Purkinje cell simple spike trains: experiments, modeling and theory. Neuroscience. 162, 816–26. [DOI] [PubMed] [Google Scholar]
- DeAndrade MP, et al. , 2012a. Motor restlessness, sleep disturbances, thermal sensory alterations and elevated serum iron levels in Btbd9 mutant mice. Hum Mol Genet. 21, 3984–92. [DOI] [PMC free article] [PubMed] [Google Scholar]
- DeAndrade MP, Li Y, Chapter 80 - Btbd9 Knockout Mice as a Model of Restless Legs Syndrome In: LeDoux MS, (Ed.), Movement Disorders (Second Edition). Academic Press, Boston, 2015, pp. 1191–1205. [Google Scholar]
- DeAndrade MP, et al. , 2012b. Enhanced hippocampal long-term potentiation and fear memory in Btbd9 mutant mice. PLoS One. 7, e35518. [DOI] [PMC free article] [PubMed] [Google Scholar]
- Devine JK, et al. , 2019. Objective changes in activity levels following sleep extension as measured by wrist actigraphy. Sleep Med. 60, 173–177. [DOI] [PubMed] [Google Scholar]
- Dudek M, et al. , 2015. Brain activation induced by voluntary alcohol and saccharin drinking in rats assessed with manganese-enhanced magnetic resonance imaging. Addict Biol. 20, 1012–21. [DOI] [PubMed] [Google Scholar]
- Duong TQ, et al. , 2000. Functional MRI of calcium-dependent synaptic activity: cross correlation with CBF and BOLD measurements. Magn Reson Med. 43, 383–92. [DOI] [PubMed] [Google Scholar]
- Earley CJ, et al. , 2014. Altered brain iron homeostasis and dopaminergic function in Restless Legs Syndrome (Willis-Ekbom Disease). Sleep Med. 15, 1288–301. [DOI] [PubMed] [Google Scholar]
- Earley CJ, et al. , 2011. The dopamine transporter is decreased in the striatum of subjects with restless legs syndrome. Sleep. 34, 341–7. [DOI] [PMC free article] [PubMed] [Google Scholar]
- Earley CJ, et al. , 2013. Increased synaptic dopamine in the putamen in restless legs syndrome. Sleep. 36, 51–7. [DOI] [PMC free article] [PubMed] [Google Scholar]
- Engbers JD, et al. , 2013. Bistability in Purkinje neurons: ups and downs in cerebellar research. Neural Netw. 47, 18–31. [DOI] [PubMed] [Google Scholar]
- Ettore E, et al. , 2019. Relationships between objectives sleep parameters and brain amyloid load in subjects at risk to Alzheimer's disease: the INSIGHT-preAD Study. Sleep. [DOI] [PubMed] [Google Scholar]
- Ferre S, et al. , 2019. New Insights into the Neurobiology of Restless Legs Syndrome. Neuroscientist. 25, 113–125. [DOI] [PMC free article] [PubMed] [Google Scholar]
- Freeman A, et al. , 2012. Sleep fragmentation and motor restlessness in a Drosophila model of Restless Legs Syndrome. Curr Biol. 22, 1142–8. [DOI] [PMC free article] [PubMed] [Google Scholar]
- Fremont R, et al. , 2017. A role for cerebellum in the hereditary dystonia DYT1. Elife. 6. [DOI] [PMC free article] [PubMed] [Google Scholar]
- Fukuda J, Kawa K, 1977. Permeation of manganese, cadmium, zinc, and beryllium through calcium channels of an insect muscle membrane. Science. 196, 309–11. [DOI] [PubMed] [Google Scholar]
- Garcia Borreguero D, et al. , 2017. Introduction: Towards a better understanding of the science of RLS/WED. Sleep Med. 31, 1–2. [DOI] [PubMed] [Google Scholar]
- Giannaki CD, et al. , 2017. Restless legs syndrome is contributing to fatigue and low quality of life levels in hemodialysis patients. World J Nephrol. 6, 236–242. [DOI] [PMC free article] [PubMed] [Google Scholar]
- Golowasch J, et al. , 2009. Membrane capacitance measurements revisited: dependence of capacitance value on measurement method in nonisopotential neurons. J Neurophysiol. 102, 2161–75. [DOI] [PMC free article] [PubMed] [Google Scholar]
- Goodkin HP, Thach WT, 2003. Cerebellar control of constrained and unconstrained movements. I. Nuclear inactivation. J Neurophysiol. 89, 884–95. [DOI] [PubMed] [Google Scholar]
- Han VZ, et al. , 2014. Bidirectional modulation of deep cerebellar nuclear cells revealed by optogenetic manipulation of inhibitory inputs from Purkinje cells. Neuroscience. 277, 250–66. [DOI] [PMC free article] [PubMed] [Google Scholar]
- Heiney SA, et al. , 2014. Precise control of movement kinematics by optogenetic inhibition of Purkinje cell activity. J Neurosci. 34, 2321–30. [DOI] [PMC free article] [PubMed] [Google Scholar]
- Holmes WR, et al. , 1992. Interpretation of time constant and electrotonic length estimates in multicylinder or branched neuronal structures. J Neurophysiol. 68, 1401–20. [DOI] [PubMed] [Google Scholar]
- Hoshi E, et al. , 2005. The cerebellum communicates with the basal ganglia. Nat Neurosci. 8, 1491–3. [DOI] [PubMed] [Google Scholar]
- Hsu YH, et al. , 2008. Neuronal dysfunction of a long projecting multisynaptic pathway in response to methamphetamine using manganese-enhanced MRI. Psychopharmacology (Berl). 196, 543–53. [DOI] [PubMed] [Google Scholar]
- Ichinohe N, et al. , 2000. A di-synaptic projection from the lateral cerebellar nucleus to the laterodorsal part of the striatum via the central lateral nucleus of the thalamus in the rat. Brain Res. 880, 191–7. [DOI] [PubMed] [Google Scholar]
- Jellen LC, et al. , 2012. Systems genetic analysis of the effects of iron deficiency in mouse brain. Neurogenetics. 13, 147–57. [DOI] [PMC free article] [PubMed] [Google Scholar]
- Ji Y, et al. , 2018. Genetic factors associated with iron storage in Australian blood donors. Blood Transfus. 16, 123–129. [DOI] [PMC free article] [PubMed] [Google Scholar]
- Jones BC, et al. , 2003. Quantitative genetic analysis of ventral midbrain and liver iron in BXD recombinant inbred mice. Nutr Neurosci. 6, 369–77. [DOI] [PubMed] [Google Scholar]
- Jones SE, et al. , 2019a. Genome-wide association analyses of chronotype in 697,828 individuals provides insights into circadian rhythms. Nat Commun. 10, 343. [DOI] [PMC free article] [PubMed] [Google Scholar]
- Jones SE, et al. , 2019b. Genetic studies of accelerometer-based sleep measures yield new insights into human sleep behaviour. Nat Commun. 10, 1585. [DOI] [PMC free article] [PubMed] [Google Scholar]
- Kessler R, et al. , 2019. Sleep and activity patterns in older patients discharged from the hospital. Sleep. 42. [DOI] [PMC free article] [PubMed] [Google Scholar]
- Kim KW, et al. , 2012. Increased striatal dopamine transporter density in moderately severe old restless legs syndrome patients. Eur J Neurol. 19, 1213–8. [DOI] [PubMed] [Google Scholar]
- Kuula L, et al. , 2019. Using big data to explore worldwide trends in objective sleep in the transition to adulthood. Sleep Med. 62, 69–76. [DOI] [PubMed] [Google Scholar]
- Laezza F, et al. , 2007. KRIP6: a novel BTB/kelch protein regulating function of kainate receptors. Mol Cell Neurosci. 34, 539–50. [DOI] [PMC free article] [PubMed] [Google Scholar]
- Lai YY, et al. , 2017. Motor hyperactivity of the iron-deficient rat - an animal model of restless legs syndrome. Mov Disord. 32, 1687–1693. [DOI] [PMC free article] [PubMed] [Google Scholar]
- Lane JM, et al. , 2019. Biological and clinical insights from genetics of insomnia symptoms. Nat Genet. 51, 387–393. [DOI] [PMC free article] [PubMed] [Google Scholar]
- Lanza G, et al. , 2017. Central and peripheral nervous system excitability in restless legs syndrome. Sleep Med. 31, 49–60. [DOI] [PubMed] [Google Scholar]
- Loewenstein Y, et al. , 2005. Bistability of cerebellar Purkinje cells modulated by sensory stimulation. Nat Neurosci. 8, 202–11. [DOI] [PubMed] [Google Scholar]
- Lu H, et al. , 2007. Cocaine-induced brain activation detected by dynamic manganese-enhanced magnetic resonance imaging (MEMRI). Proc Natl Acad Sci U S A. 104, 2489–94. [DOI] [PMC free article] [PubMed] [Google Scholar]
- Lyu S, et al. , 2019a. Hyperactivity, dopaminergic abnormalities, iron deficiency and anemia in an in vivo opioid receptors knockout mouse: Implications for the Restless Legs Syndrome. Behav Brain Res. [DOI] [PMC free article] [PubMed] [Google Scholar]
- Lyu S, et al. , 2019b. The role of BTBD9 in striatum and restless legs syndrome. eNeuro. [DOI] [PMC free article] [PubMed] [Google Scholar]
- Lyu S, et al. , 2020. The role of BTBD9 in the cerebral cortex and the pathogenesis of restless legs syndrome. Exp Neurol. 323, 113111. [DOI] [PMC free article] [PubMed] [Google Scholar]
- Margariti PN, et al. , 2012. Investigation of unmedicated early onset restless legs syndrome by voxel-based morphometry, T2 relaxometry, and functional MR imaging during the nighttime hours. AJNR Am J Neuroradiol. 33, 667–72. [DOI] [PMC free article] [PubMed] [Google Scholar]
- Meneely S, et al. , 2018. Differential dopamine D1 and D3 receptor modulation and expression in the spinal cord of two mouse models of Restless Legs Syndrome. Frontiers in Behavioral Neuroscience. 12. [DOI] [PMC free article] [PubMed] [Google Scholar]
- Michaud M, et al. , 2002. SPECT imaging of striatal pre- and postsynaptic dopaminergic status in restless legs syndrome with periodic leg movements in sleep. J Neurol. 249, 164–70. [DOI] [PubMed] [Google Scholar]
- Montplaisir J, et al. , 1991. Restless legs syndrome and periodic leg movements in sleep: the primary role of dopaminergic mechanism. Eur Neurol. 31, 41–3. [DOI] [PubMed] [Google Scholar]
- Murayama Y, et al. , 2006. Tracing neural circuits in vivo with Mn-enhanced MRI. Magn Reson Imaging. 24, 349–58. [DOI] [PubMed] [Google Scholar]
- Narita K, et al. , 1990. Mn and Mg influxes through Ca channels of motor nerve terminals are prevented by verapamil in frogs. Brain Res. 510, 289–95. [DOI] [PubMed] [Google Scholar]
- Novak CM, et al. , 2012. The use of a running wheel to measure activity in rodents: relationship to energy balance, general activity, and reward. Neurosci Biobehav Rev. 36, 1001–1014. [DOI] [PMC free article] [PubMed] [Google Scholar]
- Okun MS, et al. , 2005. Deep brain stimulation of the GPi treats restless legs syndrome associated with dystonia. Mov Disord. 20, 500–1. [DOI] [PubMed] [Google Scholar]
- Papandreou C, et al. , 2019. Circulating metabolites associated with objectively measured sleep duration and sleep variability in overweight/obese participants: a metabolomics approach within the SATIN study. Sleep. 42. [DOI] [PubMed] [Google Scholar]
- Pautler RG, et al. , 1998. In vivo neuronal tract tracing using manganese-enhanced magnetic resonance imaging. Magn Reson Med. 40, 740–8. [DOI] [PubMed] [Google Scholar]
- Perez PD, et al. , 2013. In vivo functional brain mapping in a conditional mouse model of human tauopathy (tauP301L) reveals reduced neural activity in memory formation structures. Mol Neurodegener. 8, 9. [DOI] [PMC free article] [PubMed] [Google Scholar]
- Perrine SA, et al. , 2015. Cocaine-induced locomotor sensitization in rats correlates with nucleus accumbens activity on manganese-enhanced MRI. NMR Biomed. 28, 1480–8. [DOI] [PMC free article] [PubMed] [Google Scholar]
- Qu S, et al. , 2007. Locomotion is increased in a11-lesioned mice with iron deprivation: a possible animal model for restless legs syndrome. J Neuropathol Exp Neurol. 66, 383–8. [DOI] [PubMed] [Google Scholar]
- Rizzo G, et al. , 2017. Brain imaging and networks in restless legs syndrome. Sleep Med. 31, 39–48. [DOI] [PMC free article] [PubMed] [Google Scholar]
- Rizzo G, et al. , 2012. Abnormal medial thalamic metabolism in patients with idiopathic restless legs syndrome. Brain. 135, 3712–20. [DOI] [PubMed] [Google Scholar]
- Rondou P, et al. , 2008. BTB Protein KLHL12 targets the dopamine D4 receptor for ubiquitination by a Cul3-based E3 ligase. J Biol Chem. 283, 11083–96. [DOI] [PMC free article] [PubMed] [Google Scholar]
- Ruottinen HM, et al. , 2000. An FDOPA PET study in patients with periodic limb movement disorder and restless legs syndrome. Neurology. 54, 502–4. [DOI] [PubMed] [Google Scholar]
- Saleem KS, et al. , 2002. Magnetic resonance imaging of neuronal connections in the macaque monkey. Neuron. 34, 685–700. [DOI] [PubMed] [Google Scholar]
- Salinas GD, et al. , 2006. Actinfilin is a Cul3 substrate adaptor, linking GluR6 kainate receptor subunits to the ubiquitin-proteasome pathway. J Biol Chem. 281, 40164–73. [DOI] [PubMed] [Google Scholar]
- Sarnaik R, Raman IM, 2018. Control of voluntary and optogenetically perturbed locomotion by spike rate and timing of neurons of the mouse cerebellar nuclei. Elife. 7. [DOI] [PMC free article] [PubMed] [Google Scholar]
- Schaefer H, Rongo C, 2006. KEL-8 is a substrate receptor for CUL3-dependent ubiquitin ligase that regulates synaptic glutamate receptor turnover. Mol Biol Cell. 17, 1250–60. [DOI] [PMC free article] [PubMed] [Google Scholar]
- Schormair B, et al. , 2017. Identification of novel risk loci for restless legs syndrome in genome-wide association studies in individuals of European ancestry: a meta-analysis. Lancet Neurol. 16, 898–907. [DOI] [PMC free article] [PubMed] [Google Scholar]
- Singh S, et al. , 2019. Low-cost solution for rodent home-cage behaviour monitoring. PLoS One. 14, e0220751. [DOI] [PMC free article] [PubMed] [Google Scholar]
- Sloot WN, Gramsbergen JB, 1994. Axonal transport of manganese and its relevance to selective neurotoxicity in the rat basal ganglia. Brain Res. 657, 124–32. [DOI] [PubMed] [Google Scholar]
- Sorensen E, et al. , 2012. A genetic risk factor for low serum ferritin levels in Danish blood donors. Transfusion. 52, 2585–9. [DOI] [PubMed] [Google Scholar]
- Spiegelhalder K, et al. , 2008. Cerebral correlates of muscle tone fluctuations in restless legs syndrome: a pilot study with combined functional magnetic resonance imaging and anterior tibial muscle electromyography. Sleep Med. 9, 177–83. [DOI] [PubMed] [Google Scholar]
- Spijker S, 2011. Dissection of Rodent Brain Regions. Neuroproteomics. 57, 13–26. [Google Scholar]
- Stefansson H, et al. , 2007. A genetic risk factor for periodic limb movements in sleep. N Engl J Med. 357, 639–47. [DOI] [PubMed] [Google Scholar]
- Stogios PJ, et al. , 2005. Sequence and structural analysis of BTB domain proteins. Genome Biol. 6, R82. [DOI] [PMC free article] [PubMed] [Google Scholar]
- Stogios PJ, Prive GG, 2004. The BACK domain in BTB-kelch proteins. Trends Biochem Sci. 29, 634–7. [DOI] [PubMed] [Google Scholar]
- Takeda A, et al. , 1998a. In vivo stimulation-induced release of manganese in rat amygdala. Brain Res. 811, 147–51. [DOI] [PubMed] [Google Scholar]
- Takeda A, et al. , 1998b. Manganese transport in the neural circuit of rat CNS. Brain Res Bull. 45, 149–52. [DOI] [PubMed] [Google Scholar]
- Tian J, et al. , 2013. Changes in Spontaneous firing patterns of cerebellar Purkinje cells in p75 knockout mice. Cerebellum. 12, 300–3. [DOI] [PMC free article] [PubMed] [Google Scholar]
- Trenkwalder C, Paulus W, 2010. Restless legs syndrome: pathophysiology, clinical presentation and management. Nat Rev Neurol. 6, 337–46. [DOI] [PubMed] [Google Scholar]
- Turjanski N, et al. , 1999. Striatal dopaminergic function in restless legs syndrome: 18F-dopa and 11C-raclopride PET studies. Neurology. 52, 932–7. [DOI] [PubMed] [Google Scholar]
- Walters AS, et al. , 2009. Does the endogenous opiate system play a role in the Restless Legs Syndrome? A pilot post-mortem study. J Neurol Sci. 279, 62–5. [DOI] [PubMed] [Google Scholar]
- Wang H, et al. , 2019. Genome-wide association analysis of self-reported daytime sleepiness identifies 42 loci that suggest biological subtypes. Nat Commun. 10, 3503. [DOI] [PMC free article] [PubMed] [Google Scholar]
- Wendt A, et al. , 2020. Sleep parameters measured by accelerometry: descriptive analyses from the 22-year follow-up of the Pelotas 1993 birth cohort. Sleep Med. 67, 83–90. [DOI] [PubMed] [Google Scholar]
- White JJ, Sillitoe RV, 2017. Genetic silencing of olivocerebellar synapses causes dystonialike behaviour in mice. Nat Commun. 8, 14912. [DOI] [PMC free article] [PubMed] [Google Scholar]
- Winkelman JW, et al. , 2014. Restless legs syndrome and central nervous system gammaaminobutyric acid: preliminary associations with periodic limb movements in sleep and restless leg syndrome symptom severity. Sleep Med. 15, 1225–30. [DOI] [PubMed] [Google Scholar]
- Winkelmann J, et al. , 2007. Genome-wide association study of restless legs syndrome identifies common variants in three genomic regions. Nat Genet. 39, 1000–6. [DOI] [PubMed] [Google Scholar]
- Womack M, Khodakhah K, 2002. Active contribution of dendrites to the tonic and trimodal patterns of activity in cerebellar Purkinje neurons. J Neurosci. 22, 10603–12. [DOI] [PMC free article] [PubMed] [Google Scholar]
- Yartsev MM, et al. , 2009. Pausing purkinje cells in the cerebellum of the awake cat. Front Syst Neurosci. 3, 2. [DOI] [PMC free article] [PubMed] [Google Scholar]
- Yepes G, et al. , 2017. Targeting hypersensitive corticostriatal terminals in restless legs syndrome. Ann Neurol. 82, 951–960. [DOI] [PMC free article] [PubMed] [Google Scholar]
- Yokoi F, et al. , 2012a. Improved motor performance in Dyt1 DeltaGAG heterozygous knock-in mice by cerebellar Purkinje-cell specific Dyt1 conditional knocking-out. Behav Brain Res. 230, 389–98. [DOI] [PMC free article] [PubMed] [Google Scholar]
- Yokoi F, et al. , 2012b. Abnormal nuclear envelope in the cerebellar Purkinje cells and impaired motor learning in DYT11 myoclonus-dystonia mouse models. Behav Brain Res. 227, 12–20. [DOI] [PMC free article] [PubMed] [Google Scholar]
- Zhang L, et al. , 2011. Altered dendritic morphology of Purkinje cells in Dyt1 DeltaGAG knock-in and purkinje cell-specific Dyt1 conditional knockout mice. PLoS One. 6, e18357. [DOI] [PMC free article] [PubMed] [Google Scholar]
- Zhang XM, et al. , 2004. Highly restricted expression of Cre recombinase in cerebellar Purkinje cells. Genesis. 40, 45–51. [DOI] [PubMed] [Google Scholar]
Associated Data
This section collects any data citations, data availability statements, or supplementary materials included in this article.