

SUMMARY
FTO, an RNA N6-methyladenosine (m6A) demethylase, plays oncogenic roles in various cancers, presenting an opportunity for the development of effective targeted therapeutics. Here we report two potent small-molecule FTO inhibitors that exhibit strong anti-tumor effects in multiple types of cancers. We show that genetic depletion and pharmacological inhibition of FTO dramatically attenuate leukemia stem/initiating cell self-renewal and reprogram immune response by suppressing expression of immune checkpoint genes, especially LILRB4. FTO inhibition sensitizes leukemia cells to T cell cytotoxicity and overcomes hypomethylating agent-induced immune evasion. Our study demonstrates that FTO plays critical roles in cancer stem cell self-renewal and immune evasion, and highlights the broad potential of targeting FTO for cancer therapy.
Graphical Abstract

INTRODUCTION
Among the >170 modified RNA nucleotides, N6-methyladenosine (m6A) represents the most abundant and prevalent internal modification in eukaryotic mRNA (Boccaletto et al., 2018; Frye et al., 2018). Fat mass and obesity-associated protein (FTO) was identified as the first RNA demethylase that can remove m6A from RNA through an α-Ketoglutarate (α-KG) and Fe(II)-dependent mechanism (Jia et al., 2011), suggesting that m6A is a type of reversible and dynamic RNA modification (Jia et al., 2013). Recently, we reported that FTO is overexpressed and plays a critical role in leukemia as an m6A demethylase (Li et al., 2017). Subsequently, we showed that FTO is a target of R-2-hydroxyglutarate (R-2HG) and by suppression of FTO activity, R-2HG displays intrinsic anti-leukemia effects (Su et al., 2018). In addition, the aberrant overexpression and potential oncogenic roles of FTO have also been reported in multiple solid tumors (Niu et al., 2019; Tang et al., 2019; Yang et al., 2019). Thus, those data suggest that FTO is a promising therapeutic target. Better understanding of the mechanisms underlying FTO’s functions in cancers and development of effective targeted therapeutics against FTO are warranted.
A set of specific or non-specific FTO inhibitors, such as rhein, meclofenamic acid (MA), MO-I-500, fluorescein, and R-2HG, have been identified (Chen et al., 2012; He et al., 2015; Huang et al., 2015; Padariya and Kalathiya, 2016; Singh et al., 2016; Su et al., 2018; Toh et al., 2015; Wang et al., 2015; Zheng et al., 2014). However, all these small molecules are limited in clinical potential due to mild biological function, and low sensitivity and/or specificity (Huang et al., 2019). More recently, two derivatives of MA, termed FB23 and FB23–2, have been developed, which showed improved efficacy in inhibiting FTO activity and viability of human AML cells. Nonetheless, their IC50 values in inhibiting AML cell viability are still >1 μM (FB23–2) or even >20 μM (FB23) (Huang et al., 2019). While FB23–2 showed a statistically significant effect on inhibiting progression of human primary AML in mice, which provides proof-of-concept evidence indicating the therapeutic potential of pharmacological targeting FTO in treating AML, the inhibitory degree was not satisfying. Thus, there is still an urgent and unmet need to develop efficacious inhibitors against FTO to treat AML and other cancers. Here, through a series of screening and validation assays, we identified two potent small-molecule FTO inhibitors. Our further studies revealed the significant effects and the underlying mechanisms of targeting FTO on suppressing cancer stem cell self-renewal and immune evasion, highlighting the broad potential of targeting FTO for cancer therapy.
RESULTS
Identification of effective FTO inhibitors
To identify potential FTO inhibitors, we conducted a structure-based virtual screening of the 260,000 compounds from NCI DTP library (see STAR Methods for the details). We requested for the top 370 candidate compounds that showed the highest scores based on their docking to FTO’s catalytic pocket (Figures 1A–1C) from NCI, but only 213 compounds were available. We then assessed their anti-leukemic efficacy in human MONOMAC 6 AML cell line (carrying t(9;11)/MLL-AF9) via MTT cell proliferation/viability assays (Figure S1A). The top 20 compounds showing the most robust inhibitory effects on MONOMAC 6 cell viability (Figure 1D) were selected and further validated in two additional AML cell lines (NOMO-1 and U937; Figure S1B). We also assessed their efficacy on inhibition of FTO’s m6A demethylase activity through cell-free m6A demethylase assays (Figure 1E). We identified three compounds (CS1, CS2, and NSC 48890) that display consistently robust effects on inhibition of AML cell viability and FTO’s demethylase activity. Due to NSC 48890’s overly simplistic structure (unlikely a selective inhibitor) (Figure S1C), we decided to focus on CS1 and CS2 (Figure 1F) for further studies.
Figure 1. Identification of FTO inhibitors through structure-based virtual screening and validation assays.

(A) Pyramid flowchart of the pipeline to identify FTO inhibitors from the NCI Developmental Therapeutics Program (DTP) library.
(B) Docking models were developed based on FTO crystal structure and the 260,000 compounds from the NCI DTP library.
(C) Docking pose of the top 370 hits within the catalytic center of FTO protein.
(D) The effects of top 20 compounds on cell viability in MONOMAC 6.
(E) The effects of top 20 compounds on the enzymatic activity of FTO.
(F) The two-dimensional (2D) structure (upper panel) and three-dimensional (3D) conformer (lower panel) of CS1 and CS2.
(G) The binding model of CS1 in FTO catalytic pocket.
(H) The CS1/FTO and CS2/FTO binding models.
(I and J) The 2D ligand interaction diagrams for CS1/FTO (I) and CS2/FTO (J). Data are represented as mean ± SEM from 3 independent experiments. ***, p < 0.001. See also Figure S1.
Our docking models suggest that both CS1 and CS2 bind tightly to FTO protein and block its catalytic pocket (Figures 1G–1J, S1D, and S1E). Additionally, based on the crystal structure of FTO-oligonucleotide complex (Zhang et al., 2019), we found that CS1/2 interact with FTO residues that were known to be involved in the binding of FTO with m6A modified ssDNA (Zhang et al., 2019), such as HIS231 and GLU234 by CS1, and LYS216, SER229 and HIS231 by CS2 (Figures 1H–1J, and S1F–S1H). These data suggest that CS1 and CS2 selectively bind to and occupy the catalytic pocket of FTO, and thereby block m6A-modified oligos from entering into FTO’s catalytic pocket, which in turn inhibits FTO’s demethylase activity and its binding with the target RNA transcripts.
CS1 and CS2 are highly efficacious FTO inhibitors with potent anti-leukemic efficacy in vitro
Compared to two previously reported FTO inhibitors (FB23–2 and MO-I-500) (Huang et al., 2019; Zheng et al., 2014), CS1 and CS2 displayed a much higher efficacy in inhibiting AML cell viability, with 10- to 30-times lower IC50 values in AML cells (Figures S2A and S2B), indicating their greatly improved efficacy. We then determined their IC50 values in a panel of leukemia cell lines with high or low levels of FTO expression (Li et al., 2017; Su et al., 2018). As expected, the FTO-High leukemia lines showed lower IC50 values than the FTO-Low cell lines (Figures 2A and 2B). Knockdown (KD) of FTO in FTO-High AML cells reduced their sensitivity to CS1 and CS2 (Figures S2C and S2D). These results suggest that the anti-leukemia effects of CS1 and CS2 are FTO-abundance dependent. Both CS1 and CS2 significantly inhibited viability of human primary AML cells, but largely spared the healthy control cells (Figures 2C and 2D), highlighting their therapeutic potential in treating leukemia patients.
Figure 2. The anti-leukemic efficacy of CS1 and CS2 is FTO dependent.
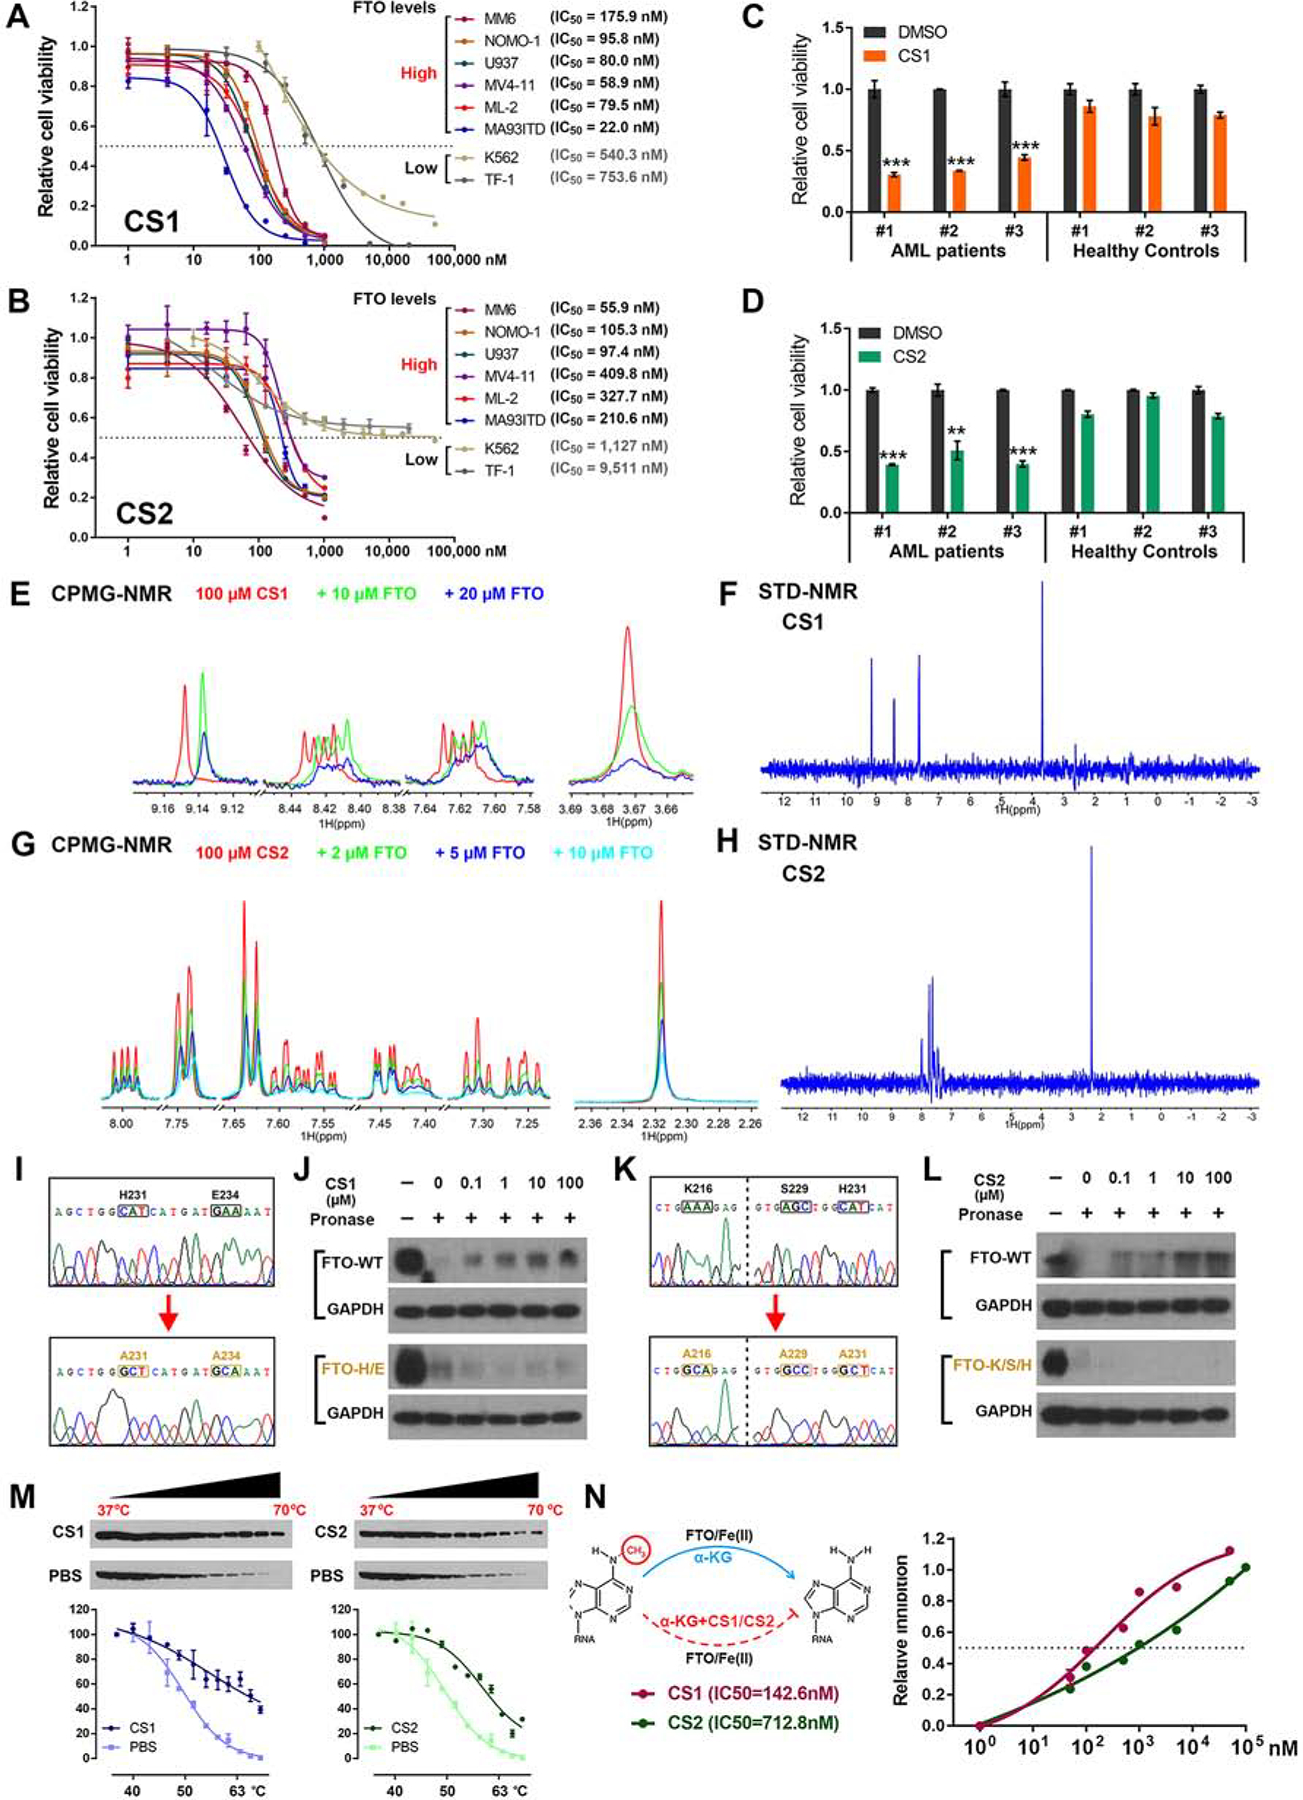
(A and B) IC50 values of CS1 (A) and CS2 (B) on inhibiting cell viability in AML cell lines. The cells were treated for 72 h.
(C and D) The effects of CS1 (100 nM, 48 h; C) and CS2 (200 nM, 48 h; D) on cell viability in CD34+ cells of AML patients and healthy donors.
(E) The CPMG spectra for CS1 (red), CS1 in the presence of 10 μM FTO (green), and 20 μM FTO (blue).
(F) The STD spectrum for CS1 in the presence of 5 μM FTO protein.
(G) The CPMG spectra for CS2 (red), CS1 in the presence of 2 μM FTO (green), 5 μM FTO (blue), and 10 μM FTO (cayn).
(H) The STD spectrum for CS2 in the presence of 5 μM FTO protein. (I) Confirming FTOH231A/E234A mutation via Sanger sequencing.
(J) Western blot analysis of FTO WT (upper panel) and FTOH231A/E234A (lower panel) from DARTS with CS1 in MONOMAC 6 cells.
(K) Confirming FTOK216A/S229A/H231A mutation via Sanger sequencing.
(L) Western blot analysis of FTO WT (upper panel) and FTOK216A/S229A/H231A (lower panel) from DARTS with CS2 in MONOMAC 6 cells.
(M) Western blot analysis (upper panel) and thermal shift curves (lower panel) of FTO from CETSA in MONOMAC 6 pretreated with 200 nM CS1 or CS2.
(N) Inhibitory effects of CS1 and CS2 on FTO demethylase activity via in vitro (cell-free) m6A demethylation assays.
Data are represented as mean ± SEM from 3 independent experiments. **, p < 0.01; ***, p < 0.001.
The direct interactions between CS1/2 and FTO protein were confirmed by a biophysical method, nuclear magnetic resonance (NMR). CS1 and CS2-induced dose-dependent attenuation of signals were observed in Carr-Purcell-Meiboom-Gill (CPMG) NMR titration, and positive saturation transfer signals (STD) were also detected (Figures 2E–2H), demonstrating their direct binding with FTO in vitro (i.e., in a cell-free system). Drug affinity responsive target stability (DARTS) (Lomenick et al., 2009) assay and cellular thermal shift assay (CETSA) (Jafari et al., 2014) were conducted to confirm their direct interactions in AML cells. According to the docking poses of CS1/2 and FTO protein (see Figures 1I and 1J), residues H231 and E234 are essential for the binding of FTO with CS1, while K216, S229, and H231 are crucial for its binding with CS2. CS1 and CS2 could block pronase-induced proteolysis of wild-type (WT) FTO, but not that of mutant FTOH231A/E234A or FTOK216A/S229A/H231A (Figures 2I–2L). Such data confirmed that FTO bind directly with CS1 and CS2 in cellulo, and the mutated amino acids are essential for their interactions. In addition, both CS1 and CS2 treatment led to substantial shifts of the thermal stability of FTO protein (Figure 2M), which further confirmed their direct interactions. Through cell-free m6A demethylase assays, we showed both CS1 and CS2 efficiently suppressed m6A demethylase activity of FTO, with IC50 values in nanomolar range (Figures 2N and S2E).
Since the residues K216, S229, H231, and E234 of FTO are essential for the bindings of FTO with both CS1/2 (Figures 2I–2L) and m6A-modified oligonucleotides (Zhang et al., 2019), we presumed that CS1 and CS2 could disrupt the binding of FTO with its target RNAs. Indeed, our CLIP-qPCR data confirmed that CS1 and CS2 block the binding of FTO with its known target mRNAs, such as MYC, CEBPA, and RARA (Li et al., 2017; Su et al., 2018) (Figure S2F–S2H). In addition, CS1 and CS2 treatment notably increased global m6A abundance in AML cells (Figure S2I), but had no noticeable effect on FTO protein level (Figure S2J). Neither CS1 nor CS2 treatment suppressed the enzymatic activity of ALKBH5, another major m6A demethylase (Zheng et al., 2013), or TET1, another α-KG-dependent dioxygenase (Figures S2K and S2L), highlighting the selectivity of CS1 and CS2 against FTO.
Effects of FTO KD and inhibition on AML cell viability and differentiation and on leukemia stem/initiating cell (LSC/LIC) self-renewal
Consistent with the effects of FTO KD (Li et al., 2017), we showed that pharmacological inhibition of FTO by CS1 or CS2 resulted in substantially increased apoptosis and cell cycle arrest (at the G0 phase) in human AML cells (Figures 3A–3D, S3A–S3D). Both inhibitors, alone or together with all-trans retinoic acid (ATRA), also significantly promoted myeloid differentiation in human AML cells (Figures S3E and S3F).
Figure 3. Effects of CS1 and CS2 on apoptosis, cell cycle, and LSCs/LICs frequency in AMLs (A and B) Effect of CS1 (A) and CS2 (B) treatment on early apoptosis (left panel) and late apoptosis (right panel) in NOMO-1 AML cells upon 48 h treatment.

(C and D) Effects of CS1 and CS2 treatment on cell cycle distribution in NOMO-1 cells as detected by PI staining (C) and Hoechst 33342/Pyronin Y staining (D).
(E) FTO abundance in the bone marrow-derived mononuclear cells (BMMNCs) of AML patients and healthy donors.
(F) FTO abundance in the CD34+ and CD34− cells of BMMNCs from AML patients.
(G) FTO levels in CD34+ cells vs. CD34− cells of individual BMMNC samples.
(H) The LSC/LIC frequency changes in MA9 primary murine AML cells upon Fto KD as estimated by in vitro limiting dilution assays (LDAs).
(I and J) The LSC/LIC frequency changes in MA9 (I) and FLT3ITD/NPM1mut (J) primary murine AML cells upon CS1 (20 nM) treatment.
(K) Diagram for the in vivo LDAs.
(L) LSC/LIC frequency changes in the MA9 AML mouse models upon CS1 or CS2 treatment.
Data are represented as mean ± SEM, n = 3. *, p < 0.05; **, p < 0.01; ***, p < 0.001. See also Figure S3 and Table S1.
LSCs/LICs, characterized by their unlimited self-renewal potential, are considered to be the root cause for the treatment failure and relapse of AML; thus eradication of LSCs/LICs is necessary to achieve a cure (Krause and Van Etten, 2007; Pollyea and Jordan, 2017). Via flow cytometry, we found that FTO is overexpressed in human primary AML patient cells relative to healthy control cells (Figures 3E and S3G). Moreover, in primary AML patient samples, FTO level is even higher in CD34+ immature AML cells than in CD34− AML bulk cells (Figures 3F and 3G). Consistent with their higher FTO levels, AML patient samples have a lower m6A abundance compared with healthy controls (Figure S3H), and so do CD34+ AML cells compared with CD34− AML cells (Figure S3I). FTO KD substantially promoted apoptosis and myeloid differentiation, and suppressed colony-forming capability of human primary AML CD34+ cells (Figures S3J–S3L), implying that FTO may play a role in self-renewal/repopulation of LSCs/LICs. To test this, we conducted in vitro and in vivo limiting dilution assays (Krivtsov et al., 2006; Li et al., 2015; Weng et al., 2018). Either KD of FTO or pharmacological inhibition of FTO resulted in a remarkable decrease in the frequency of LSCs/LICs in murine AML models (Figures 3H–3L). Notably, 50 nM CS1 could almost completely inhibit repopulating capacity of AML cells (Figure S3M), further highlighting the potent effect of our FTO inhibitors in suppressing self-renewal of LSCs/LICs.
CS1 and CS2 treatments modulate the signaling pathways of FTO
RNA-seq was carried out to understand the molecular mechanisms underlying effects of CS1 and CS2 (Figure S4A). Cluster analysis revealed that CS1, shFTO, and CS2 treated samples can be grouped together, separate from the two control groups (Figure 4A). The dysregulated genes induced by CS1, CS2, and FTO KD overlapped well with each other (Figures 4B and 4C). Our RNA-seq and qPCR data showed that CS1 or CS2 treatment substantially decreased MYC and CEBPA expression, while increasing RARA and ASB2 expression (Figures 4D, S4B, and S4C), which are positive and negative targets of FTO, respectively (Li et al., 2017; Su et al., 2018). By targeting FTO, CS1 and CS2 treatment also increased m6A abundance on FTO target RNAs, such as MYC and CEBPA mRNA (Su et al., 2018), and snRNAs (Mauer et al., 2019) (Figure S4D–S4F). Through global gene set enrichment analysis (GSEA) (Subramanian et al., 2005), we identified a set of up-regulated or down-regulated pathways upon CS1 or CS2 treatment, or FTO KD. Notably, among the up-regulated pathways, CS1, CS2, and shFTO groups shared the majority of their enriched signaling pathways and core-enriched genes (Figures 4E left panel, 4F and Table S2). Among the down-regulated pathways, all the pathways suppressed by CS1 or CS2 also exist in the pathways suppressed by FTO KD (Figures 4E right panel, 4G and Table S2). FTO inhibition or KD mediated cell apoptosis and cell cycle arrest likely attributed to the activation of the ‘Apoptosis’ signaling, and suppression of the ‘MYC targets V1’ and ‘MYC targets V2’ pathways (Figure 4H). We also compared the key biological pathways effects by CS1, CS2, and other FTO inhibitors, FB23 and FB23–2 (Huang et al., 2019), and found the distinct inhibitors shared these crucial signaling pathways and core-enriched gene (Figure S4G and Table S2). Thus, our mechanistic study data suggest that CS1 and CS2 exert their anti-leukemic effects through modulation of the essential signaling pathways of FTO.
Figure 4. Identify signal pathways affected by FTO inhibition and KD via RNA-seq.
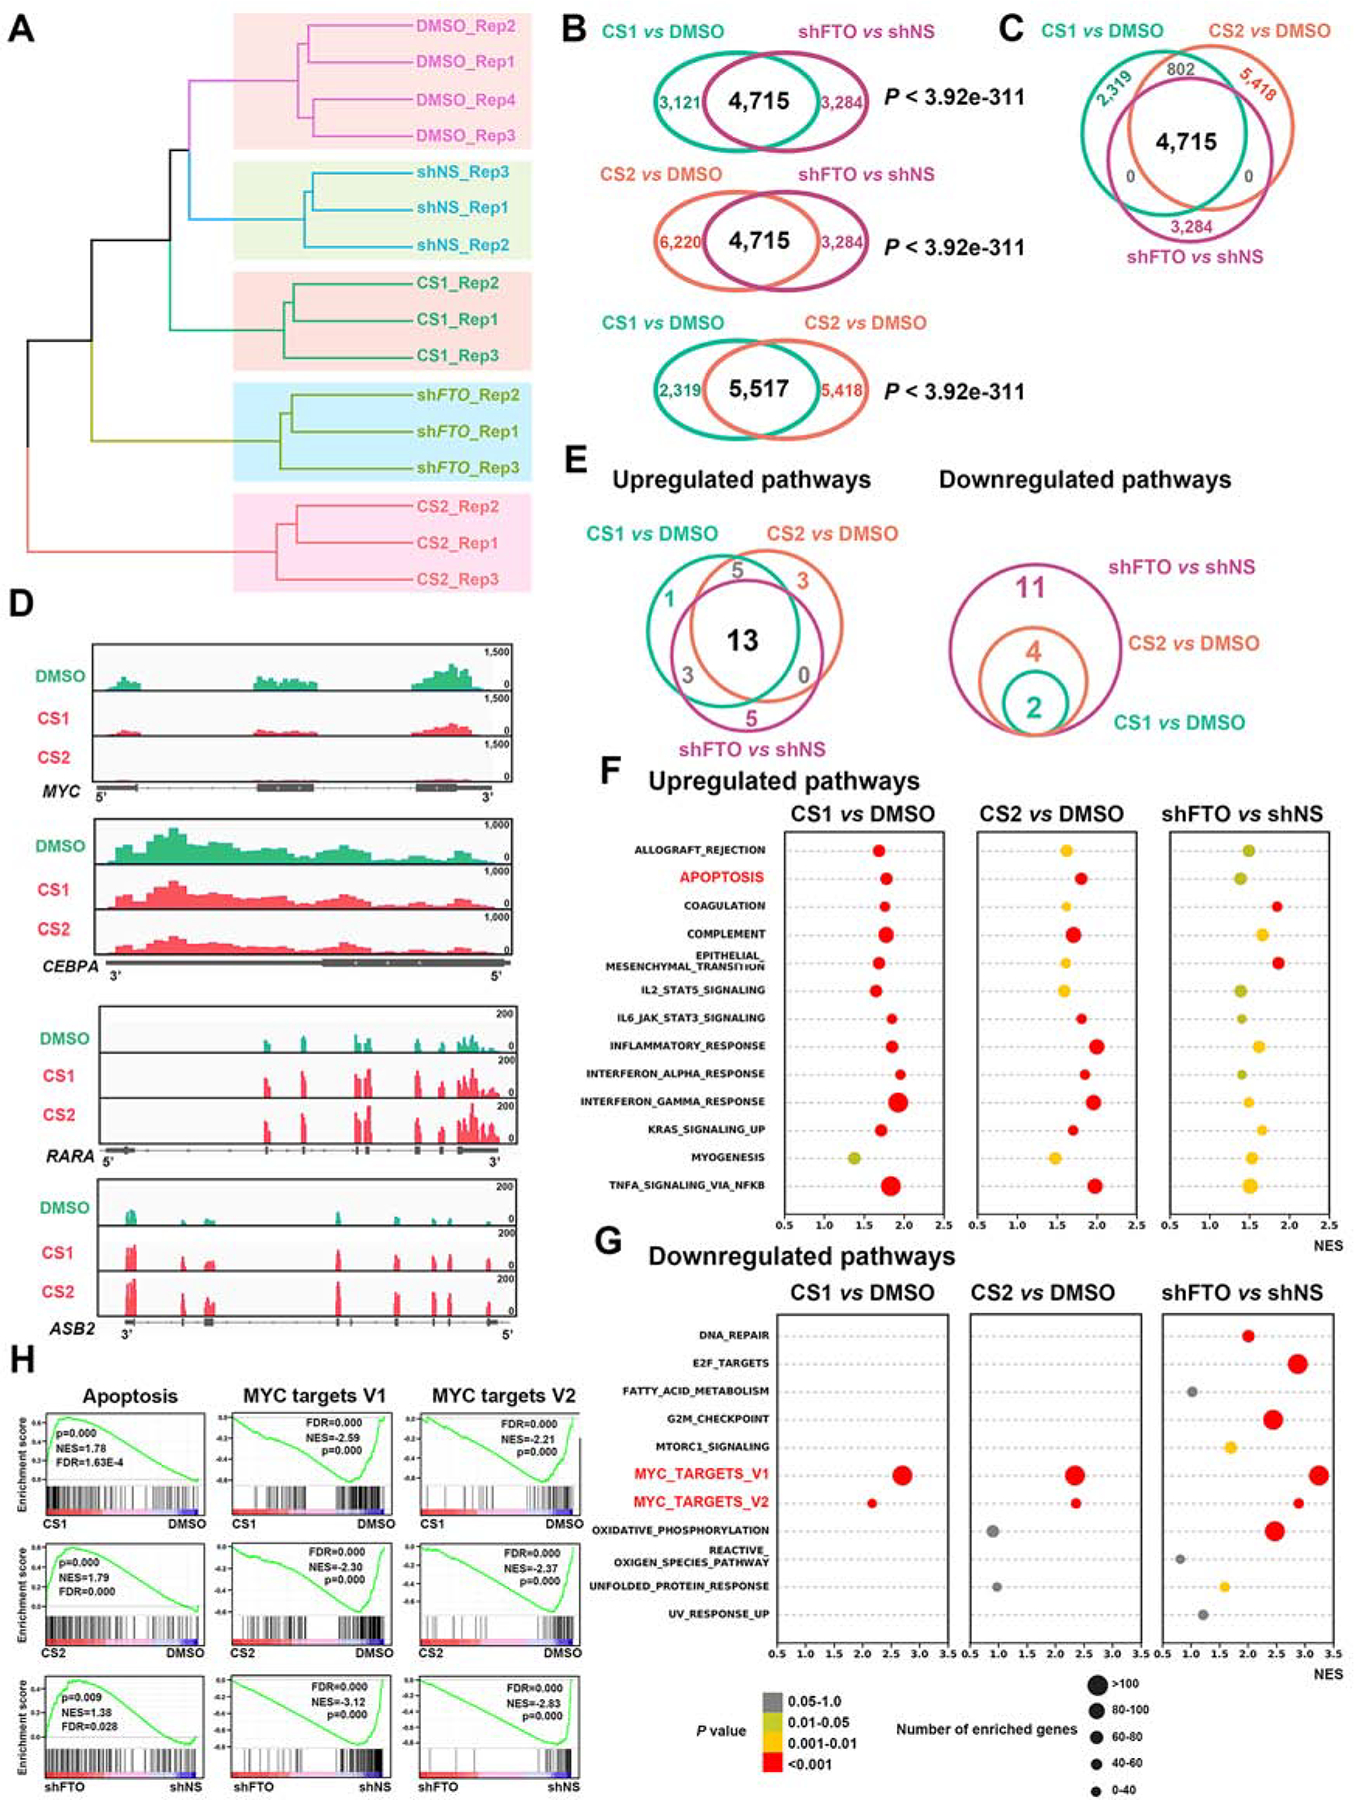
(A) Hierarchical clustering dendrogram of RNA-seq data from NOMO-1 cells upon CS1, CS2, DMSO, shNS or shFTO (shFTO-1) treatment.
(B) The overlapped dysregulated genes between CS1 treatment and FTO KD (upper panel), CS2 treatment and FTO KD (middle panel), and CS1 and CS2 treatments (lower panel).
(C) The overlapped dysregulated genes among CS1 treatment, CS2 treatment, and FTO KD groups.
(D) Distribution of RNA-seq reads in MYC, CEBPA, RARA, and ASB2 mRNA.
(E) The overlap of ‘Upregulated pathways’ (left panel) or ‘Downregulated pathways’ (right panel) induced by FTO KD, CS1 and CS2 based on the GSEA analysis.
(F and G) Scattergrams of the ‘Upregulated pathways’ (F) and ‘Downregulated pathways’ (G) based on the GSEA analysis.
(H) GSEA analysis of shared ‘Up-regulated’ apoptosis, and ‘Down-regulated’ MYC pathways by inhibition of FTO (CS1 or CS2) and KD of FTO (shFTO).
All RNA-seq experiments were conducted with at least three independent biological replicates.
CS1 and CS2 display potent anti-leukemic efficacy in vivo
We next assessed the therapeutic efficacy of CS1 and CS2 in vivo. In a patient-derived xenotransplantation (PDX) AML model (with a relapsed AML patient sample, 2017–38), we showed that CS2 treatment dramatically reduced leukemia infiltration (Figure S5A) and doubled the overall survival (Figure 5A). Surprisingly, however, CS1 treatment did not show any significant effects, although CS1 exhibited an equal or even stronger anti-leukemic activity compared to CS2 in vitro (see Figures 2A, 2B, and 3A–3D). Further analysis revealed that the poor solubility and uptake of CS1 likely caused its weak effect in vivo. To increase bioavailability, we employed mPEG-b-PLA micelles or β-cyclodextrin, both widely used in the clinic (Cho et al., 2016; Hirayama and Uekama, 1999), to deliver hydrophobic CS1 (Figure 5B). We then repeated the treatment with the same PDX AML model by use of Micelles packaged CS1 (Micelle_CS1), and demonstrated that delivery of CS1 with micelles markedly improved its anti-leukemia activity in vivo (Figure 5C). Similarly, Micelle_CS1 displayed a much more potent anti-leukemic activity than free CS1 in treating mice bearing transplanted murine MLL-AF9 AML, where free CS2 still showed robust anti-leukemic activity (Figures 5D, S5B, and S5C). Both Micelle_CS1 and free CS2 also displayed potent anti-AML efficacy in another PDX AML model (AML 3448), significantly more effective than FB23–2 (Figures S5D–S5F). Similarly, β-cyclodextrin packaged CS1 (β-CD_CS1) and CS2 substantially delayed AML progression and prolonged survival in an additional PDX model (AML 2016–9) (Figures 5E, 5F, and S5G), accompanied with a significant impact on expression of FTO targets, including MYC, RARA, and ASB2 (Figure S5H). Via bioluminescence imaging, we observed that pharmacological inhibition or KD of FTO remarkably inhibited leukemia progression, constantly reduced leukemia burden, and dramatically prolonged survival (Figures 5G, 5H, and S5I–S5K). Thus, our preclinical animal model studies demonstrated the potent therapeutic efficacy of CS1 (packaged by Micelles or β-cyclodextrin) or CS2 alone in treating AML, including relapsed AML. As we just tested relatively low dosages of CS1 and CS2 (merely 5 mg/kg once every other day for 10 times), higher dosages may result in more robust therapeutic effects.
Figure 5. FTO inhibition substantially delayed AML progression and improved survival in vivo.

(A) Kaplan-Meier survival curves of AML PDX mouse model (AML 2017–38) treated with free CS1 or CS2.
(B) Polymeric Micelles of mPEG-b-PLA (upper panel) and β-cyclodextrin (lower panel) were utilized to deliver CS1.
(C) Kaplan-Meier survival curves of AML PDX mouse model (AML 2017–38) treated with free CS1 or Micelle_CS1.
(D) Kaplan-Meier survival curves of mice transplanted with primary murine MA9 AML cells treated with free CS1, Micelle_CS1, or CS2.
(E and F) Kaplan-Meier survival curves of AML PDX mouse models (AML 2016–9) treated with β-CD_CS1 (E) or CS2 (F).
(G and H) In vivo bioluminescence imaging (G) and Kaplan-Meier survival curves (H) of xenograft mouse models with human MA9.3ITD cells treated with β-CD_CS1 or CS2.
ns, not significant; p values are derived from log-rank test.
The FTO/m6A axis regulates immune checkpoint gene expression
We previously reported that R-2HG-mediated FTO inhibition displayed synergistic effects with hypomethylating agents (HMAs; e.g., Azacitidine (AZA) and Decitabine (DAC)) in treating AML (Su et al., 2018). HMAs are wildly used for the treatment of patients with AML or myelodysplastic syndrome (MDS), especially in elderly patients and in those who are not eligible for allogeneic stem cell transplantation (Dombret et al., 2015; Issa et al., 2004; Yun et al., 2016). However, the vast majority of AML or MDS patients treated with HMA eventually developed drug resistance (Yun et al., 2016). The upregulation of immune checkpoint genes, such as PD-1, PD-L1, and PD-L2, and subsequent immune evasion have been assumed to contribute to HMA-induced drug resistance in the treated patients with myeloid malignancies (Orskov et al., 2015; Stahl and Goldberg, 2019; Yang et al., 2014). Since inhibition of FTO by R-2HG could sensitize AML cells to HMA (Su et al., 2018), here we sought to reveal the mechanism(s) underlying their synergistic effect and determine whether FTO signaling contributes to HMA-mediated up-regulation of immune checkpoint genes and subsequent immune evasion.
We confirmed the increased expression of PD-L1, PD-L2 and PD-1 upon DAC treatment in human AML or T cells (Figure S6A). Strikingly, DAC treatment also resulted in globally decreased m6A abundance in AML cells (Figure 6A). The reduced m6A level is likely owing to the increased expression of m6A eraser FTO, as no significant expression changes observed in ALKBH5, METTL3 or METTL14 (Figures 6B and S6B). We thus presumed that DAC-induced FTO overexpression may contribute to the increased expression of immune checkpoint genes via an m6A-dependent mechanism. Indeed, FTO KD or inhibition significantly inhibited expression of PD-L1 and PD-L2 in human AML cells with or without DAC treatment (Figures S6C–S6F). Nonetheless, we found that the endogenous expression levels of such immune checkpoint genes in most of human AML cell lines are very low (Figures S6G–S6I). Consistently, it was reported that due to their limited expression in AML patients, targeting those immune checkpoint proteins by inhibitors alone showed only limited clinical efficacy in treating AML patients (Berger et al., 2008; Daver et al., 2019).
Figure 6. The FTO/m6A axis contributes to HMA-mediated up-regulation of immune checkpoint genes.

(A) Global m6A abundance upon DAC or PBS treatment for 48 h in MONOMAC 6 cells.
(B) qPCR analysis of FTO level changes in MONOMAC 6 cells upon DAC treatment (48 h).
(C) qPCR analysis of LILRB4 level changes in NOMO-1 cells upon DAC treatment (48 h).
(D) qPCR analysis of LILRB4 in CD3 T cells, healthy MNCs, and AML cell lines.
(E) Expression levels of PD-L1, PD-L2, and LILRB4 in the TCGA AML dataset.
(F) qPCR analysis of LILRB4 level changes upon CS1 or CS2 treatment in MONOMAC 6 cells.
(G and H) qPCR analysis of LILRB4 level changes upon FTO overexpression (G) in NOMO1 cells or FTO KD (H) in MONOMAC 6 cells.
(I and J) Flow cytometry analysis of LILRB4 level changes upon FTO overexpression (I) or KD (J) in THP1 cells.
(K and L) Western blot analysis of LILRB4 level changes in MONOMAC 6 cells upon FTO KD (K) or inhibition (L).
(M) Protein levels of LILRB4 in MONOMAC 6 cells with CS1 or CS1+DAC treatment (left panel), and CS2 or CS2+DAC treatment (right panel).
(N and O) m6A abundance changes in LILRB4 mRNA upon FTO inhibition (N) or KD (O) in MONOMAC 6 cells.
(P-R) LILRB4 mRNA stability changes in AML cells upon FTO overexpression (P), FTO KD (Q), or YTHDF2 KD (R).
Mean ± SEM from 3 independent experiments. *, p < 0.05; **, p < 0.01; ***, p < 0.001.
See also Figure S6.
Besides PD-L1/PD-L2, leukocyte immunoglobulin-like receptor subfamily B (LILRB), including LILRB1, 2, 3, 4, and 5, have also been recognized as immune checkpoint proteins in AML (Chen et al., 2018; Deng et al., 2018a; Kang et al., 2016). We observed that DAC treatment remarkably promoted expression of LILRB family members, including LILRB3, LILRB4 and LILRB5 (Figure S6J). In particular, LILRB4 level was increased over 100 fold upon DAC treatment (Figure 6C), which is 6–20 times greater than the fold changes for PD-L1 and PD-L2 (see Figure S6A). Interestingly, amongst the LILRB genes, only expression of LILRB4 could be significantly down-regulated by FTO KD (Figure S6K), implying LILRB4 might be a target of FTO in AML cells. Notably, LILRB4 is overexpressed in human AML cell lines, relative to normal BM mononuclear cells (MNCs) and T cells (Figures 6D and S6L), with a much higher level than those of PD-1, PD-L1 and PD-L2 in AML lines (Figure S6M). Similarly, when analyzing the TCGA AML dataset (Ley et al., 2013), we found that the median expression level of LILRB4 is 40–50 times higher than those of PD-L1 and PD-L2 in human primary AML samples (Figure 6E).
Consistent with the effect of FTO KD, CS1 or CS2 treatment also significantly decreased LILRB4 expression at both RNA and protein levels; conversely, forced expression of FTO WT (but not the catalytically inactive mutant) significantly increased expression of LILRB4 (Figures 6F–6L). DAC treatment could partially rescue the suppressed expression of LILRB4 induced by FTO inhibition (Figure 6M). Notably, CS1 and CS2 treatment did not obviously affect LILRB4 level in normal dendritic cells or macrophages (Figures S6N and S6O), likely due to the low level of FTO in such cells. FTO inhibition or KD increased m6A abundance on LILRB4 mRNA transcript (Figures 6N and 6O). Moreover, we demonstrated that FTO WT, but not mutant, could significantly increase the stability of LILRB4 mRNA in AML cells; the opposite is true when FTO was knocked down (Figures 6P and 6Q). KD of m6A reader YTHDF2, which was reported to promote decay of m6A-modified transcripts (Wang et al., 2014), also increased the half-life of LILRB4 mRNA (Figure 6R). Together, FTO positively regulates LILRB4 expression in AML by suppressing YTHDF2-mediated decay of m6A-modified LILRB4 mRNA.
Targeting FTO sensitizes AML cells to T cell cytotoxicity and overcomes HMA-induced immune evasion
To determine if pharmacological inhibition of the FTO/m6A/LILRB4 axis can reprogram immune response, we pretreated AML cells with CS1 or CS2, then co-cultured them with activated T cells. We found that FTO inhibition sensitized human AML cells to T cells, accompanied with decreased expression of LILRB4 in AML cells (Figures 7A–7E). To generate a comprehensive molecular profiling of FTO inhibition in immune competent setting, we utilized the MLL-AF9 AML mouse model for RNA-seq. Among the immune checkpoint genes, Lilrb4 is highly expressed in AML cells and significantly suppressed by FTO inhibitor therapy (Figures 7F, 7G, and S7A). Further flow cytometry studies validated the downregulation of Lilrb4 by CS1 and CS2 treatment in vivo (Figures 7H–7K). LILRB4 knockout (KO) or KD also significantly inhibited human AML cell growth (Figures 7L and 7M). Consistent with its role in immune surveillance, forced expression of LILRB4 suppressed T-cell killing of human AML cells with or without FTO inhibitor pretreatment (Figures 7N, 7O, S7B, and S7C).
Figure 7. FTO inhibition suppressed immune evasion via targeting LILRB4.

(A) Schematic of the co-culture assays with T cells and GFP-labeled human AML cells.
(B-E) Effect of CS1 (B) and CS2 (D) on the sensitivity of human AML cells to the cytotoxicity of T cells in vitro. MONOMAC 6 cells were pretreated with CS1 or CS2 for 48 h and LILRB4 levels were validated via qPCR (C and E).
(F) Scatter plot of normalized expression for all genes from RNA-seq with the spleen MNCs of MA9 mice with PBS or CS1 treatment.
(G) Distribution of RNA-seq reads in Lilrb4 transcript.
(H) Schematic showing the method to assess the effect of FTO inhibition on Lilrb4 expression in vivo.
(I) Flow cytometry analysis of Lilrb4 expression in vivo.
(J and K) Representative (J) and statistical summary (K) of Lilrb4 abundance changes in AML blast cells of MA9 mice upon β-CD_CS1 or CS2 treatment.
(L and M) Effects of LILRB4 KO (L) and KD (M) on cell proliferation in MONOMAC 6 cells.
(N and O) Effect of LILRB4 overexpression (N) on T-cell toxicity (O) in NOMO-1 cells.
Mean ± SEM for B, C, D, E and O; while mean ± SD for K, L, and M, n = 3. *, p < 0.05; **, p < 0.01; ***, p < 0.001.
See also Figure S7.
To assess the effect of targeting the FTO/m6A/LILRB4 axis on AML progression and immune evasion in vivo, we employed AML xenograft models with FTO inhibition and T cell treatment. We found that FTO inhibition (by CS1 or CS2) synergized with T cell treatment and substantially suppressed AML progression, resulted in remarkably prolonged survival in the combinational treatment groups (Figures 8A and 8B). Consistent with the role of FTO in mediating HMA-induced upregulation of immune checkpoint genes and subsequent immune evasion, FTO inhibition also synergized with HMAs (e.g. DAC) in inhibiting AML progression in immune-competent BMT recipient mice, and the combinations showed much improved therapeutic efficacy than either treatment alone (Figures 8C, S7D and S7E). Collectively, FTO inhibition could suppress immune checkpoint gene expression and thereby sensitize AML cells to T cell cytotoxicity and overcome HMA-induced immune evasion.
Figure 8. The in vivo effects of FTO inhibitors on immunotherapy and solid tumors.

(A and B) Bioluminescence images (A) and Kaplan-Meier survival curves (B) of NRGS mice with MA9.3ITD AML subjected to treatment with FTO inhibitors and/or activated human T-cells.
(C) Kaplan-Meier survival curves of MA9 AML mouse models upon treatments as indicated.
(D) Tumor growth curves of NSG mice bearing human breast cancer upon treatment with vehicle control, β-CD_CS1 or CS2. Dots represent the mean tumor volume in cubic millimeters ± SD (n = 10).
(E) Representative bioluminescence images of NSG mice at their endpoints.
For survival curves, the p values were calculated using the log-rank test. *, p < 0.05; **, p < 0.01; ***, p < 0.001; ****, p < 0.0001; NS: not significant. For the tumor growth curve, ***, p < 0.001 as assayed by one-way ANOVA.
The minimal drug toxicity, structure-activity-relationships (SAR), and broad anti-cancer efficacy of FTO inhibitors
To evaluate the potential drug toxicity of CS1 and CS2 in vivo, we injected two doses for each compound (5 mg/kg/day (i.e., the does used for AML mouse treatment) and 20 mg/kg/day) into C57BL/6 mice once every other day for 20 days, and euthanized all the mice 10 days post the final treatment. We observed no significant difference between the drug-treated groups and control group on whole body or organ weight (Figures S7F–S7K and Table S3). Complete blood count (CBC) data collected from peripheral blood didn’t show any significant difference between the treated groups and control group (Table S3). Haemotoxylin and Eosin (H&E) staining also showed no difference between the groups (Figure S7L). These data suggest that the drug toxicity of CS1 or CS2 is minimal.
To explore the SAR of CS1 and CS2 chemical scaffolds, we designed and synthesized 6 analog compounds for CS1 and 4 analogs for CS2, based on their structures and their binding poses with FTO protein. Among the 6 CS1 analogs, only CS1–3 and CS1–7 showed a similar anti-leukemic efficacy to CS1 (Figure S8A). As shown in the docking models, both CS1–3 and CS1–7 display tight binding with FTO protein (Figure S8A). According to the structures of CS1 and its analogs, we conjecture that the planar 3-ring structure may be important for their efficacy. Among CS2 analogs, only CS2–2, with the highest similarity to CS2, exhibited a similar anti-leukemia effect to CS2 (Figure S8B). Further systematic studies are warranted to develop more effective CS1 and CS2 analogs.
In addition to hematopoietic malignancies, FTO has also been reported to play oncogenic roles in many types of solid tumors (Huang et al., 2020a; Niu et al., 2019; Tang et al., 2019; Yang et al., 2019). To test the therapeutic potential of targeting FTO in treating solid tumors, we chose glioblastoma (GBM), breast cancer, and pancreatic cancer as representative models, in which FTO expression are comparable to that in AML (Figure S8C). FTO KD or inhibition significantly suppressed proliferation of these cancer cells (Figure S8D–G). Further in vivo studies confirmed the potent anti-tumor efficacy of FTO inhibitors in treating breast cancer (Figures 8D and 8E). Together, our results demonstrate the broad therapeutic potential of FTO inhibitors in treating various types of cancers.
DISCUSSION
While m6A modification and the machinery have been implicated in the initiation, progression, maintenance and drug resistance of various types of cancers (Deng et al., 2018b; Deng et al., 2018c; Huang et al., 2020b), the development of effective inhibitors to target m6A regulators for cancer therapy is still in its infancy (Huang et al., 2020a). In the present study, by in silico virtual screening and subsequent validation assays, we have identified two effective small-molecule compounds (CS1 and CS2) that specifically target FTO and efficiently suppress its m6A demethylase activity by occupying the catalytic pocket and interfering with the binding of FTO with m6A-modified RNAs. CS1 and CS2 treatment significantly inhibited the viability/growth of human AML cells with IC50 values at low nanomolar levels, which are at least 10 times more effective than previously reported FTO inhibitors (e.g., FB23–2 and MO-I-500) (Huang et al., 2019; Zheng et al., 2014). Mechanistically, CS1 and CS2 exert anti-leukemic effects by suppression of FTO activity and signaling, leading to the activation of apoptosis signaling and inhibition of MYC pathways, etc. Notably, CS1 (NSC337766, also named Bisantrene) has been introduced into clinical trials since 1980s as a anthracene compound for various types of cancer therapy, and part of patients responded to the treatment (Cowan et al., 1986; Miller et al., 1986; Myers et al., 1984; Pratt et al., 1986; Rothman, 2017; Yap et al., 1983). This agent was originally thought to be similar to doxorubicin in activity (Yap et al., 1983); however, unlike doxorubicin, Bisantrene does not exhibit anthracycline-associated cardiotoxicity, and it was generally well tolerated by most patients (Rothman, 2017; Yap et al., 1983). Indeed, aside from functioning as a DNA-reactive agent, its immune-activating and telomerase-inhibiting activities have also been reported (Rothman, 2017), suggesting that the mechanisms of its action have yet to be fully investigated. CS2 (NSC368390, also named Brequinar) was previously reported to inhibit the enzyme dihydoorotate dehydrogenase (DHODH) and thereby block de novo pyrimidine biosynthesis (Peters et al., 1992). Brequinar has also been tested in clinical trials for cancer therapy (Burris et al., 1998; de Forni et al., 1993; Noe et al., 1990; Schwartsmann et al., 1990). In the present study, we demonstrated that CS1 and CS2 bind directly to FTO protein as detected by NMR, DARTS and CETSA assays, and our mutagenesis assays also confirmed the essential amino acids for their bindings. In addition, we showed that FTO-high AML samples are more sensitive to CS1 and CS2, and FTO depletion reduced their sensitivity. Collectively, although further systematic studies are warranted to evaluate whether other reported mechanisms of their actions also contribute to the overall anti-cancer efficacy of CS1 and CS2, we have provided compelling evidence that FTO is a direct and essential drug target of both CS1 and CS2. Thus, future clinical trials of these two compounds should focus on cancer patients with high level of FTO.
Moreover, we showed that FTO is particularly overexpressed in LSCs/LICs, and pharmacological inhibition or KD of FTO significantly suppressed LSC/LIC self-renewal. Thus, pharmacologically targeting FTO hold potent therapeutic potential as it can eradicate LSCs/LICs. FTO’s contribution to LSC/LIC self-renewal is likely through its positive regulation of MYC and CEBPA (Su et al., 2018), two genes that play important roles in the maintenance of LSCs/LICs (Li et al., 2014; Ohlsson et al., 2014; Ye et al., 2015; Zhang et al., 2015). FTO KD or inhibition also increased the m6A abundance in snRNAs, hinting a role of FTO in RNA alternative splicing (Mauer et al., 2019; Wei et al., 2018). Similar to FTO, m6A writers (METTL3/14) also target MYC and play oncogenic roles in AML (Barbieri et al., 2017; Vu et al., 2017; Weng et al., 2018), likely through distinct mechanisms (Deng et al., 2018c). Thus, it is interesting to test whether targeting both FTO and an m6A writer exhibits a synergy in treating AML.
Evidence is emerging that tumor cells utilize ‘immune checkpoints’ as a major mechanism of immune evasion (Beatty and Gladney, 2015; Dong et al., 2002). Monoclonal antibodies targeting the PD-1/PD-L1/PD-L2 axis have achieved encouraging effects in clinical practice in treating multiple types of solid tumors (Gopalakrishnan et al., 2018; Patnaik et al., 2015; Topalian et al., 2012), but demonstrated only limited effects in AML (Berger et al., 2008). Here we show that the expression levels of these genes are very low in human AML cells. In contrast, LILRB4, whose activation can promote tumor infiltration and suppress T cell activity (Deng et al., 2018a), is highly expressed in primary AML. Since the endogenous LILRB4 levels in human primary AML samples (as well as in AML cell lines) are 40–50 times higher than those of PD-L1 and PD-L2, LILRB4 appears to be the major factor that mediates the immune evasion of AML. Interestingly, FTO directly up-regulates LILRB4 expression via an m6A-dependent mechanism. CS1/CS2 treatment decreased expression of immune checkpoint genes (especially LILRB4) in AML cells, substantially increasing the sensitivity of AML cells to the cytotoxicity of activated T cells. Different from previous studies showing the role of YTHDF1 (a m6A reader) in the cross-presentation of tumor antigens and the cross-priming of CD8+ T cells (Han et al., 2019) as well as the role of FTO in promoting melanoma tumorigenesis and anti-PD-1 resistance (Yang et al., 2019), here we demonstrate that by suppressing expression of intrinsic immune checkpoint genes (especially LILRB4) in AML cells, targeting FTO/m6A axis substantially suppressed immune evasion and sensitized AML cells to T cell cytotoxicity.
In addition, consistent with previous reports (Orskov et al., 2015; Yang et al., 2014), we confirmed that HMA treatment resulted in global upregulation of immune checkpoint genes. Notably, the ascending tendency of LILRB4 is much more significant than PD-L1 and PD-L2 upon DAC treatment. Since the observations that HMA treatment induces up-regulation of PD-1/PD-L1/PD-L2 (Orskov et al., 2015; Yang et al., 2014), multiple clinical trials are ongoing now to test therapeutic potential of the combinations of HMA with anti-PD-1, PD-L1, or PD-L2 antibodies for AML and MDS treatment (Alfayez and Borthakur, 2018; Daver et al., 2019; Stahl and Goldberg, 2019). However, as LILRB4 is likely a more critical immune checkpoint gene than the others in AML/MDS, the combinations of FTO inhibitors (or anti-LILRB4 antibody) plus HMAs might be better therapeutic strategies for AML/MDS treatment. Indeed, we have shown that FTO inhibitors exhibit strong synergistic effects with HMAs in treating AML in vivo, highlighting the therapeutic potential of this combination in treating myeloid malignancies.
Finally, the potent anti-tumor efficacy and minimal side effects of CS1 and CS2 suggest that they are highly feasible for clinical application. Further studies are warranted to optimize the compounds to improve their bioavailability, inhibitory effect, and therapeutic efficacy.
Overall, we have identified two potent FTO inhibitors, and demonstrated that targeting the FTO/m6A axis could significantly suppress cancer stem cell self-renewal and immune evasion, highlighting the broad potential of targeting FTO signaling by effective inhibitors (alone or in combination with other therapeutic agents) for cancer therapy. Moreover, our FTO inhibitors can also be used as tool compounds for basic and translational research of FTO and m6A modification.
STAR METHODS
RESOURCE AVAILABILITY
LEAD CONTACT
Further information and requests for resources and reagents may be directed to and will be fulfilled by the Lead Contact, Jianjun Chen (jianchen@coh.org).
MATERIALS AVAILABILITY
All cell lines, plasmids and other stable reagents generated in this study are available from the Lead Contact with a completed Materials Transfer Agreement.
DATA AND CODE AVAILABILITY
The RNA-Seq data generated in this study are available at NCBI GEO DataSets under accession number GSE136204 (https://www.ncbi.nlm.nih.gov/geo/query/acc.cgi?acc=GSE136204) and GSE145363 (https://www.ncbi.nlm.nih.gov/geo/query/acc.cgi?acc=GSE145363).
EXPERIMENTAL MODEL AND SUBJECT DETAILS
Leukemia Patients and Healthy Donors Samples
The leukemia patient samples were obtained at the time of newly diagnosis, after treatment, or relapsed, and with informed consent at City of Hope Hospital, Cincinnati Children’s Hospital, or Dana-Farber/Harvard Cancer Center in congruence with the protocol approved by the institutional review board (IRB). Characteristics of AML patients were outlined in Table S1. The samples from healthy donors were collected from the healthy donor center in City of Hope Hospital under the IRB protocol approved by the institute. The samples were performed with erythrocytes lysis and the mononuclear cells (MNCs) were cryopreserved in −150° waiting for further study.
Cell Culture
The leukemia cells, U937, THP1, and MV4–11 were obtained from American Type Culture Collection (ATCC) and cultured in endotoxin-free RPMI1640 supplemented with 10% fetal bovine serum (FBS) (Gemini Bio-Products); K562 (ATCC) was cultured in IMDM with 10% FBS; NOMO-1, ML-2, NB4 were obtained from DSMZ and kept in RPMI1640 with 10% FBS; MONOMAC 6 (DSMZ) was cultured in 90% RPMI 1640 with 10% FBS plus 2 mM L-glutamine, 1×non-essential amino acids, 1mM sodium pyruvate, and 10μg/ml human insulin;TF-1 (ATCC) was maintained in RPMI1640 with 10% FBS and 2ng/ml GM-CSF; MA9.3ITD (MLL-AF9 plus FLT3-ITD-transformed human CD34+ cord blood) and MA9.3RAS (MLL-AF9 plus NRasG12D-transformed human CD34+ cord blood), established by Dr. James Mulloy (Wunderlich et al., 2013), were maintained in IMDM supplemented with 20% FBS. AML patient-derived primary cells were kept in IDMD supplemented with 20% FBS, 10 ng/ml human cytokines SCF, TPO, FLT3 ligand, IL-3, and IL-6. The glioblastoma cell lines, including 8MGBA and A172 were originally maintained by Dr. David Plas from University of Cincinnati, and cultured in RPMI1640 with 10% FBS. Breast tumor cell lines, including ZR-75-1 and MDA-MB-231, were purchased from ATCC, and cultivated in RPMI1640 with 10% FBS. The cell lines from pancreatic cancer cells Capan-1 and MIA PaCa-2 were maintained in RPMI1640 with 10% FBS. All the cells are not among commonly misidentified cells lines, and were tested for mycoplasma contamination annually using a PCR Mycoplasma Detection Kit (G238, Applied Biological Materials Inc.). In order to prevent potential contamination, all the media were supplemented with Penicillin-Streptomycin (15-140-122, Thermo Fisher Scientific) and Plasmocin prophylactic (ant-mpp, InvivoGen) according to the manufacturer’s instructions.
Animal Procedures
Human Leukemia Cell Line-Derived Xenograft and PDX models
NRG-SGM3 (NRGS, RRID: IMSR_JAX:024099) mice were used for both ‘human-in-mouse’ xeno-transplanation models and PDX models. The mice were originally purchased from the Jackson Laboratory, and bred at the specific-pathogen-free core facilities of City of Hope and Cincinnati Children’s Hospital according to standard procedures. All animal studies listed below were conducted in accordance with federal and state government guidelines and IACUC protocols approved by City of Hope and Cincinnati Children’s Hospital. For each experiment, 6- to 8-week-old mice were used and randomly allocated to each group. For xenograft mouse, 0.1 × 10⁶ MA9.3ITD cells were transplanted into NRGS recipient mice intravenously. Drug treatment was started from 10 days after transplantation. CS2 was administered through intraperitoneal (i.p.) injection at 5mg/kg/day, every other day. CS1 dissolved in saturated β-cyclodextrin (C0926, Sigma-Aldrich) solution was delivered by intravenous injection (i.v.). Successful engraftment was observed following 4 weeks post inoculation displaying a level of about 5% human CD33+ cells in peripheral. To generate PDX mouse models, 1 × 10⁶ AML patient derived BMMNCs were transplanted into NRGS recipient mice intravenously, and drug treatment was started from 7 days later. CS2, FB23–2, and free CS1 were administered through i.p. injection at 5 mg/kg/day, while Micelle (900661, Sigma-Aldrich) packaged CS1 was delivered by i.v. injection at 5mg/kg/day. Both CS1 and CS2 were injected every other day for a total of ten times.
Allogeneic BMT in Immunocompetent Mice
The MA9 cells utilized for secondary BMT were isolated from primary BMT. For primary BMT assay, mouse bone marrow progenitor cells (herein is lineage negative; Lin−) cells were enriched from 6- to 8-week-old C57BL/6J CD45.2 (B6) mice upon 5-fluorouracil (5-FU) treatment for 5 days with Lineage Cell Depletion Kit (130-090-858, Miltenyi Biotec). The Lin− progenitor cells were retrovirally transduced with MSCV-Neo-MA9 construct through two rounds of ‘spinoculation’ as described previously (Li et al., 2015). After 7 days of selection with 0.5mg/ml G418 Sulfate (10131027, Thermo Fisher Scientific) in ColonyGEL (1201, ReachBio Research Lab), the cells were collected and injected into lethally irradiated (960 rads) 8- to 10-week-old B6.SJL (CD45.1, RRID: IMSR_CRL:564) recipient mice with 0.5 × 10⁶ donor cells plus 1 × 10⁶ ‘helper’ cells (freshly isolated from the bone marrow of B6.SJL mice without irradiation) for each recipient mouse. For secondary BMT assays, primary leukemic mouse bone marrow cells (CD45.2+) were collected and sorted by flow cytometry when the mice developed full-blown AML. The cells were injected into sub-lethally irradiated (570 rads) secondary recipient mice with 0.1×10⁶ donor cells per mouse via tail vein injection. One week after BMT, the mice were randomly grouped into CS1, CS2, and control groups. The recipient mice were injected with PBS, 5 mg/kg free CS1, 5 mg/ml Micelle_CS1, and 5 mg/kg CS2, i.p., every other day, for 20 days. As drug combination study in Figure 8C, DAC (0.2 mg/kg/day, A3656, Sigma-Aldrich) was administrated six times (3 times/week for two continuous weeks) through i.p. injection. For the studies related to immune checkpoint, the recipient mice were not irradiated.
Human Breast Cancer Cell Line-Derived Subcutaneous Xenograft Model
ZR75-1 breast cancer cell line-derived xenograft experiment were performed in 6–8 week old female NSG mice purchased from the Jackson Laboratory (RRID: IMSR_JAX:005557). More information about the generation of the subcutaneous xenograft model is listed below in method details.
METHOD DETAILS
Cell Viability and Proliferation Assay
Cell viability and proliferation were determined with CellTiter 96 Non-Radioactive Cell Proliferation Assay (MTT, G4100, Promega). To validate the function of top 213 compounds enriched from the structure-based virtual screening pipeline, MONOMAC 6 cells were seeded into 96-well plate in the concentration of 10,000 cells/well and treated with 1 μM and 5 μM in triplicates. Per the manufacture’s recommendation, 15 μl dye solution was added into the well at indicated time point. After incubation at 37°C for 2–4 hours, 100 μl solubilization/Stop Solution was added to quench the reaction. Finally, the absorbance was recorded at 570 nm on the next day. For the cell proliferation with FTO KD stable cells, the indicated AML cells were first infected with pLKO.1-shFTO lentivirus, selected the positive cells with 1 μg/ml puromycin (P8833, Sigma-Aldrich) for one week, and then seed into 96-well plate upon CS1 and CS2 treatment.
Structure-based (or Docking-based) Virtual Screening Pipeline
Briefly, the three-dimensional structure of FTO protein was downloaded from RCSB Protein Data Bank (PDB id 4zs2 (Wang et al., 2015)), and then our in-house developed LiVS (Ligand Virtual Screening Pipeline) (Liu et al., 2016) was employed to screen the NCI Developmental Therapeutics Program (DTP) compound library (containing about 260,000 compounds) in silico to identify FTO inhibitor hits (Figures 1A–1C). LiVS method is a multiple-stage and full-coverage pipeline for virtual ligand screening that utilizes the three precision modes (i.e., HTVS, high-throughput virtual screening; SP, standard precision; and XP, extra precision) of Schrödinger Glide software (Friesner et al., 2004) for docking. First, the HTVS precision mode, which is fast but less accurate, was implemented to dock the entire NCI DTP library. The 10,000 top-ranked compounds were next docked and scored by the SP mode. Then the 1,000 top-ranked compounds from SP precision docking were re-docked and re-scored by the XP mode. The 1,000 compounds were further analyzed and filtered by Lipinski’s rule of five (Lipinski, 2004), HTS frequent hitter (PAINS) (Baell and Holloway, 2010), protein reactive chemicals such as oxidizer or alkylator (ALARM) (Huth et al., 2005), and maximized the molecule diversity by using UDScore (Universal Diversity Score, developed by us to measure library diversity which is independent of library size). Based on the virtual screening pipeline, we requested the top 370 compounds from NCI DTP and 213 of them are available for experimental study.
Cell Cycle and Apoptosis Assays
In this study, Propidium iodide (PI, P4170, Sigma-Aldrich) DNA staining was chosen to assess the cells located at G0/G1, S, and G2/M stages; while Hoechst 33342 (B2261, Sigma-Aldrich and Pyronin Y (P9172, Sigma-Aldrich) was selected to evaluate cells at G0, G1, and S/G2/M phases. For PI staining, 1 × 10⁶ cells were collected, washed once with PBS, and suspended in 1 ml Krishan’s buffer supplemented with 0.05 mg/ml PI, 0.1% trisodium citrate, 0.02 mg/ml ribonuclease A, and 0.3% NP-40, incubated at 37°C for 30 minutes, and then applied to flow cytometer directly. For Hoechst 33342/Pyronin Y staining, the cells were collected, washed, and re-suspended in 1 ml cell culture medium, stained with 10 μg/ml Hoechst 33342 at 37°C for 45 minutes, and further stained with 0.5 μg/ml Pyronin Y for additional 15 minutes at 37°C. The samples were transferred onto ice before subjected to flow cytometry. Cell apoptosis was validated with PE Annexin V Apoptosis Detection Kit I (559763, BD Biosciences) according to the manufacturers’ protocol. Cells were washed twice with cold PBS, and then resuspended in 100 μl 1×10⁶ cells/ml. Add 5 μl of PE Annexin V and 5 μl 7-AAD to the suspension, gently vortexed the cells and incubated for 15 min at room tempreture in the dark. After that, apply 400 μl of 1X Binding Buffer to each sample and analyzed by flow cytometry within one hour. Flow cytometry was performed with a BD Fortessa X20 and the results were analyzed with FlowJo V10 software.
In vivo Bioluminescence Imaging
Prior to in vivo bioluminescence imaging, 3rd generation luciferase expression lentivirus was generated by co-transfection of 1.5 μg pLenti CMV Puro LUC plasmid (17477, Addgene) (Campeau et al., 2009), 0.5 μg pMD2.G (12259, Addgene), 0.3 μg pMDLg/PRRE (12251, Addgene), 0.7 μg pRSV-Rev (12253, Addgene) into HEK293T cells in 60 mm cell culture dish with Effectene Transfection Reagent (301427, QIAGEN), and then the leukemia cells or the tumor cells were infected with lentivirus and selected with 1 μg/ml puromycin to stably express luciferase. For in vivo bioluminescence imaging, the mice were weighed, injected intraperitoneally with 150 mg/kg D-luciferin (LUCK-2G, Goldbio) in PBS solution, and then anesthetized with isoflurane. The mice were imaged 10 minutes after D-luciferin injection with Lago X (Spectral Instruments Imaging). The bioluminescent signals were quantified using Aura imaging software (Spectral Instruments Imaging). Total flux values were determined by drawing regions of interest, which are identical among the mice in different group, and are presented in photons/second/cm2/steradian.
Treatment of AML Xenografts with FTO Inhibitors and/or T cells
NRG-SGM3 (NRGS) mice were used as recipient mice for human MA9.3ITD AML xenografts subjected to the treatment with FTO inhibitors and/or T cells (Figures 8A–8C). In brief, 0.1×10⁶ MA9.3ITD AML cells were resuspended in 200 μl PBS for each mouse and delivered through intravenous injections. All the mice were randomly divided into 6 groups, PBS, T cell, β-CD_CS1, β-CD_CS1 plus T cell, CS2, and CS2 plus T cell. One week post transplantation, the mice were administrated every other day with 5 mg/kg/day β-CD_CS1 or CS2 for 5 times in total. For T cell tretament, each mouse was injected with 5 × 10⁶ activated human CD3+ T cells twice after one and two weeks, respectively, post transplantation. Leukemia development and progression were monitored over time by bioluminescence imaging.
In vivo Solid Tumor Models
Adult NSG mice were utilized for in vivo breast cancer subcutaneous xenograft models (Figures 8D–8E). In this study, 2 × 10⁶ ZR75-1 breast cancer cells were collected, resuspended in 100μl 50% matrigel membrane matrix (CB-40234A, Thermo Fisher Scientific) diluted in PBS, and implanted subcutaneously into the flanks of NSG recipient mice on both sides. Tumor was measured for the short and long diameter using a caliper, and the volume was calculated using the formula (short × short × large)/2. Drug treatment began when the tumor size was larger than 100 mm3. β-cyclodextrin_CS1 (5 mg/kg), CS2 (5 mg/kg) or control vehicle were administrated every other day by i.v. and i.p. injection respectively. Mice receiving CS1 were treated 10 times, while CS2 treated mice were treated 12 times. In vivo bioluminescence imaging was performed at the end point. All the mice were euthanized at day 53 after implantation, when the tumors in the control group are around 1,000 mm3.
Preparation of CS1 mPEG-b-PLA Micell
Methoxy poly(ethylene glycol)-b-poly(D,L-lactide) (mPEG-b-PLA) was purchased from Sigma-Aldrich (900661). The film hydration method was employed to prepare the CS1 loaded polymeric micelle as described previously with some modification (Gao et al., 2017). In brief, CS1 and mPEG-b-PLA were dispersed in chloroform accompanying with sonication, respectively. Then, the two chloroform solutions were well-mixed together via vortex and sonication. After making sure that the mixture was completely dissolved by chloroform, a vacuum-rotary evaporator was employed to evaporate the chloroform and to obtain a CS1-loaded polymer film. The thin film was then hydrated with deionized water, followed by vortex for 2 minutes and sonication for 5 minutes. Finally, the hydrated system was processed by centrifugation for 15 minutes at 5000 rpm to remove the un-encapsulated, free CS1. The supernatant was used the purified CS1 loaded mPEG-b-PLA micelle.
Serial Colony-Forming Assay
The assay was performed as described previously with some modification (Li et al., 2015). Briefly, the primary murine leukemic cells isolated from bone marrow of AML mice, including MA9 and FLT3ITD/NPM1, were seeded into 35 mm culture dishes (20,000 cells/dish or 10,000 cells/dish) with ColonyGEL plus murine cytokines, including 10 ng/ml IL-3, IL-6, GM-CSF, and 50 ng/ml SCF (Figure S3M). For the colony-forming assay of CD34+ blast cells derived from AML patients (Figure S3L), 20,000 cells were seeded in 1.5 ml ColonyGEL-Human Base Medium (1101, ReachBio Research Lab) in 35 mm culture dish, supplemented with human recombinant 10 ng/ml IL-3, IL-6, GM-CSF and 100 ng/ml SCF. The dishes were incubated at 37°C in a humidified atmosphere of 5% CO2 for 7 days. Then, colony cells were collected and replated every 7 days for 3 passages. Colony numbers were counted and compared for each passage.
Limiting dilution assays
For in vitro limiting dilution assays (LDAs), the murine MA9 or FLT3ITD/NPM1Mut AML cells with or without Fto knockdown or CS1 treatment were suspended in ColonyGEL medium and plated in 48-well plates at a limiting dilution manner, e.g. 100 cells/well, 50 cells/well, 20 cells/well, 10 cells/well, 5 cells/well, and 1 cell/well. For each dose, 12 wells were included. The number of wells containing spherical colonies was counted after 7 days to estimate stem cell frequency. For in vivo LDA, the bone marrow mononuclear cells isolated from MA9 AML mice subjected to PBS, 5 mg/kg β-CD_CS1, or 5 mg/kg CS2 treatment, were injected into sublethally irradiated 8- to 10-week-old B6.SJL (CD45.1) recipient mice via tail vein at a limiting dilution manner, i.e., 1 × 10⁶, 1 × 10⁵, 1 × 10⁴, 1 × 10³, and 1 × 10² donor cells per mouse. The number of recipient mice developed full-blown leukemia within two month post transplantation was counted from each group. ELDA software (Hu and Smyth, 2009) was utilized to evaluate the frequency of LSC/LICs.
Retrovirus and Lentivirus Production
Retrovirus infection of murine progenitor cells were employed as described previously (Li et al., 2015). The retrovirus vectors were transfected into HEK-293T cells using Effectene Transfection Reagent (301427, Qiagen) together with packaging vector pCL-ECO. The retrovirus was collected at 48 and 72 hours post transfection, and transduced into mouse progenitor cells in the presence of 4–8 μg/ml polybrene (H9268, Sigma-Aldrich) for ‘spinoculation’. Lentivirus used for overexpression and KD of a specific gene were packaged with pMD2.G, pMDLg/pRRE and pRSV-Rev (purchased from Addgene) (Dull et al., 1998; Stewart et al., 2003). Briefly, 1.5 μg pMD2.G, 0.9 μg pMDLg/pRRE, 2.1 μg pRSV-Rev and 5.4 μg constructs were co-transfected into HEK-293T cells in 100 mm cell culture dish with Effectene Transfection Reagent. The lentivirus particles were harvested at 48 and 72 hours after transfection, concentrated with PEG-it Virus Precipitation Solution (LV810A-1, SBI), and used to infect leukemic cells in the presence of polybrene.
CRISPR-Cas9-based Knockout of LILRB4 in MONOMAC 6 AML Cells
The MONOMAC 6 cells were infected with Cas9-expressing lentivirus (lentiCas9-Blast) (Sanjana et al., 2014) and single clones were selected with 10 μg/ml blasticidin (ant-bl-1, Invivogen). Then the single clones were infected with sgRNA-expressing lentivirus (lentiGuide-Puro-sgLILRB4) and the sgRNA-infected cells were selected with 1 μg/ml puromycin. Both the Cas9- and sgRNA expressing lentivirus were generated using the second generation package system. In brief, 3 μg expression plasmid, 0.75 μg pMD2.G and 2.25 μg psPAX2 (psPAX2 was gift from Dr. Didier Trono) were mixed well and co-transfected into HEK-293T cells in 60 mm cell culture dish with Effectene Transfection Reagent (Salmon and Trono, 2007).
RNA Extraction, cDNA Synthesis and qPCR
Total RNA samples were isolated with miRNeasy Mini Kit (217004, Qiagen) following the manufacturer’s guidelines. The CD34+ and CD34- cells were isolated from mononuclear cells with CD34 MicroBeads (130-046-702, Miltenyi Biotec). For cDNA synthesis, 200–1,000 ng total RNA or immunoprecipitated RNA samples were used for reverse transcription in 10 μl reaction volume using the QuantiTect Rev. Transcription Kit (205314, Qiagen). Quantitative PCR (qPCR) was performed with Maxima SYBR Green qPCR Master Mix (2X) (K0253, Thermo Fisher) in an AB 7900HT Fast Real-Time PCR system (Applied Biosystem). GAPDH, ACTIN, and/or 28S rRNA were used as endogenous control and each reaction was run in triplicates. All the primers are listed in Table S4.
m6A Dot Blot Assay and Gene-specific m6A Immunoprecipitation
To determine global m6A abundance, m6A dot blot assay were employed with total RNA and/or poly(A)+ RNA as described previously (Su et al., 2018). In brief, 50 μl equal amount of RNA samples mixed with 150 μl sample volumes of RNA incubation buffer, followed by denatured at 65°C for 5 minutes. Then 200μl of chilled 20 × SSC buffer was added and mixed well before samples were loaded onto the Amersham Hybond-N+ membrane (RPN303B, GE Healthcare) with a Bio-Dot Apparatus (Bio-Rad). After crosslinking under 254nm UV for 5 minutes, the membrane was stained with methyl blue and image was captured. The membrane was then washed with 1 × PBST buffer (PBST01–02, Bioland Scientific LLC), blocked with 5% non-fat milk and incubated with rabbit anti-m6A antibody (1:2000, 202003, Synaptic Systems) overnight at 4°C. After wash three times with PBST, the membrane was incubated with HRP-conjugated goat anti-rabbit IgG (ab6721, Abcam) for 1 hour at room temperature and the membrane was developed with Amersham ECL Prime Western Blotting Detection Reagent (45-010-090, Fisher Scientific). Poly(A)+ RNA was enriched from total RNA with polyATract mRNA isolation system IV (Z5310, Promega). Nuclei were isolated from cells with nuclear isolation buffer (1.28 M sucrose, 40 mM Tris-HCl pH 7.5, 20 mM MgCl2, and 4% Triton X-100) and the nuclear RNA was extracted from nuclei with miRNeasy Mini Kit to evaluate m6A modification on snRNA. Gene-specific m6A immunoprecipitation (IP) was employed with Megna MeRIP m6A kit (17–10499, Millipore) and the RNA was recovered with RNeasy Mini Kit according to the manufacturer’s instruction.
Protein Extraction and Western Blot Assay
Total protein was extracted from PBS washed cell pellet, lysed with RIPA buffer (R0278, Sigma-Aldrich) containing 5mM EDTA, 1 × Halt phosphatase inhibitor cocktail (78420, Thermo Fisher Scientific) and 1 × Halt protease inhibitor cocktail (78429, Thermo Fisher Scientific) on ice for 20 minutes, follow by centrifuge at 15,000 rpm at 4° for 15 minutes. Then the supernatant was collected and the protein concentration was quantified by BCA method. Western blot assay was performed as described previously (Su et al., 2018). Antibodies used for Western blot were as follows unless otherwise specified: FTO (ab124892, Abcam), GAPDH (sc-47724, Santa Cruz Biotechnology), β-Actin (3700S, Cell Signal Technology), LILRB4 (ab229747, Abcam), Goat anti-rabbit IgG H&L (HRP) (ab6721, Abcam), and Goat anti-mouse IgG H&L (HRP) (ab6789, Abcam).
Flow Cytometry Analysis
Flow cytometry analysis with surface markers was conducted as described previously with some modifications (Su et al., 2018). Retinoic acid (R2625, Sigma-Aldrich) was utilized to induced myeloid differentiation in NB4 cells. Antibodies used included anti-mouse CD45.1 APC (17-0453-82, eBioscience), anti-mouse CD45.2-PE (12-0454-83, Thermo Fisher Scientific), anti-mouse CD117 (c-Kit) FITC (17-1171-82, eBioscience), anti-Human CD33 PE (12-0339-42, Thermo Fisher Scientific), anti-Human CD45 BV786 (563716, BD Horizon), PE anti-mouse/human CD11b antibody (12-0118-42, eBioscience), anti-Human CD15 APC (17-0158-42, eBioscience), anti-Human CD14 APC (17-0149-42, eBioscience), anti-Human LILRB4 PE (333008, BioLegend), anti-Human LILRB4 APC (17-5139-42, eBioscience), anti-human CD209 FITC (330103, BioLegend), anti-human CD86 PE (374205, BioLegend), anti-Mouse Lilrb4 Alexa Fluor 647 (144906, BioLegend), and anti-Human CD34 FITC (11-0349-42, eBioscience).
Intracellular Staining
For intracellular staining with FTO, we first labeled the human primary cells with CD34 surface marker. Then the cells were washed with chilled PBS, re-suspended in 4% paraformaldehyde (158127, Sigma-Aldrich) at a density of 2 × 10⁶ cells/ml, and incubated at 4°C for 20 minutes with rotation. After fixation, the cells were gently re-suspended in 5 × Permeabilization buffer (00-8333-56, eBioscience), and stained with rabbit anti- human FTO (1:100) for 1 hour on ice. Finally, the cells were washed twice with 1× Permeabilization buffer, incubated with goat anti-rabbit IgG (H+L) (Alexa Fluor 555 Conjugate, 4413S, Cell Signaling Technology) in 5× Permeabilization buffer for 30 minutes at room temperature protected from dark, washed with FACS buffer and resuspended in 200 μl of FACS buffer for analysis.
Nuclear Magnetic Resonance (NMR) Titration
The N-terminal 31 residues truncated FTO protein was purified with modified methods as previously reported (Huang et al., 2015). Briefly, the FTOΔN31 protein was purified by Nickle-affinity chromatography, followed by a gel filtration (Superdex 200) with the phosphate buffer (20 mM sodium phosphate (pH 7.4), 100 mM NaCl). Fractions were collected and concentrated for further analysis. For CS1, samples were composed of 100 μM compound with 10 % DMSO in addition of 0, 10 μM and 20 μM FTO, respectively; and for CS2, samples were composed of 200 μM compound with 2 % DMSO in addition of 0, 2 μM, 5 μM and 10 μM FTO, respectively (Figures 2E–2H). NMR data acquisition was performed on a Bruker Avance III-600 MHz spectrometer equipped with a cryogenically cooled probe (Bruker biospin, Germany) at 25°C.
Drug Affinity Responsive Targets Stability (DARTS)
To determine the direct binding between small molecule compounds and FTO protein in cellulo, DARTS was conducted in MONOMAC 6 AML cells following the published protocol (Lomenick et al., 2009) (Figures 2I–2L). Empty pCDH vector was linearized by XbaI (FD0684, Thermo Fisher Scientific) and BamHI (FD0054, Thermo Fisher Scientific). The ORF of wild-type FTO with 3 × Falg at C-terminal was cloned from pmiRNA1-FTO and then transferred to linearized pCDH vector with In-Fusion HD Cloning. FTOH231A/E234A and FTOK216A/S229A/H231A were generated from pCDH-3 × Falg-FTO with In-Fusion HD Cloning (638916, Takara). The primers used in In-Fusion cloning were listed in Table S4. The plasmids were extracted with QIAGEN Plasmid Mini Kit and validated by Sanger sequencing. The MONOMAC 6 cells were infected with pCDH-3×Flag-FTO, FTOH231A/E234A and FTOK216A/S229A/H231A and positive cells were selected with 1μg/ml puromycin. Then, ~3×10⁷ stable cells were collected, washed with chilled PBS, and lysed in 600 μl M-PER buffer (78501, Thermo Fisher Scientific) for 10 minutes on ice before subjected to centrifugation. 600 μl of supernatant was transferred into a fresh tube and mixed with one tenth volume of 10×TNC buffer (500 mM Tris-HCl (pH 8.0), 500 mM NaCl, 100 mM CaCl2). The lysates were split into 6 samples by transferring 100 μl into 1.5 ml Eppendorf tubes, incubated with DMSO, CS1 or CS2 at indicated concentrations for 1 hour at room temperature, and then digested with Pronase (1:3000, 10165921001, Roche) for an additional 30 minutes at room temperature. The reaction was quenched by protein inhibitor cocktail and the samples were immediately placed on ice. Finally, Western blotting was performed to determine whether FTO is a direct target of CS1 and CS2. GAPDH was used as a negative control.
Cellular Thermal Shift Assay (CETSA)
To determine whether CS1 or CS2 act as a direct ligand of FTO protein, CETSA was conducted with intact MONOMAC 6 as published previously (Jafari et al., 2014). Briefly, ~10 × 106 MONOMAC 6 cells in 100 mm dishes were pretreated with 200 nM CS1 or CS2 for 18 hours before subjected to CETSA protocol. The cells from each group were collected, washed once with iced PBS, and re-suspended in 1.5 ml PBS supplemented with protease inhibitor cocktail. The cell suspension was distributed into 12 different 0.2 ml PCR tubes with 100 μl in each tube. The cells were heat shocked in the Bio-Rad T100 Thermal Cycler at indicated temperatures for 3 minutes to denature proteins, and immediately cooled down to room temperature for another 3 minutes. Finally, the samples were subjected to three freeze-thaw cycles with dry ice and a Thermal Cycler set at 25°C to lyse cells, and centrifuged at 20,000 g for 20 min at 4°C to pellet cell debris together with precipitated and aggregated proteins. The supernatant was boiled with 4× Laemmli Sample Buffer (1610747, Bio-Rad) for Western blot. The bands were quantified using Gel-Pro analyzer software and plotted from three biological replicates.
RNA m6A Demethylation Assay in Cell Free System
To determine whether CS1 and CS2 could directly disturb the m6A demethylation activity of FTO protein, m6A demethylase assay was conducted with m6A demethylase assay kit (ab233489, Abcam) following the manufacturer’s protocol with minor modifications. Recombinant FTO protein was purchased from Active Motif (31572). To assess the effects of top 20 compounds on the enzymatic activity of FTO, 1 μM compound (less than 1% volume) and 0.4 μg FTO protein were utilized for each reaction. While, for the enzymatic reaction of CS1 and CS2, we added 44 μl of final demethylase buffer, 1 μl (0.3 μg) of purified FTO protein, and 5 μl of inhibitor solution with indicated concentration. The strip plates were incubated at 37°C for 90 minutes. For the final signal detection, we added 100 μl of developer solution to each well and incubated at room temperature for 3 minutes away from light before adding 100 μl of stop solution. The absorbance was recorded at 450 nm immediately.
The FTO demethylase activity (OD/h/mg) in each well was determined by the following formula:
The relative inhibition on FTO demethylase was calculated by the following equation:
To test the effect of FTO inhibitors on the demethylase activity of the other m6A eraser protein, ALKBH5, m6A demethylase assay and m6A dot blot were performed. The single-stranded RNA with internal m6A modification (5’-AUUGUCA(m6A)CAGCAGC-3’) were synthesized by GE health, and ALKBH5 protein was purchased from Active Motif (31589). The m6A demethylase activity assays were conducted as described previously (Su et al., 2018). In brief, a 20 μl reaction mixture containing the indicated concentration of CS1 or CS2, 0.1 nmol ssRNA, 200 nM ALKBH5 protein, 283 μM of (NH4)2(SO4)2·6H2O (203505, Sigma-Aldrich), 75 μM of α-KG (K1128, Sigma-Aldrich), 2 mM of L-ascorbic acid (A0278, Sigma-Aldrich), 50 μg/ml of bovine serum albumin (BSA A2058, Sigma-Aldrich), and 50 mM of HEPES buffer, pH 7.0 was incubated at 37°C for 3 hours and quenched by 5 mM EDTA followed by thermal inactivation of ALKBH5 for 5 min at 95°C. The ssRNA was precipitated with the addition of one-tenth volumes of 3 M sodium acetate (pH 5.2), glycogen (500 μg/ml, final concentration) and 2.5 volumes of 100% ethanol, and incubated at −80°C overnight. The RNA pellet was resuspended in 10 μl of RNase-free water and then applied to m6A dot blot assay to detect m6A levels. To avoid the effects of solvent, the volume of compound occupied to less than 1% of the total volume.
DNA 5mC Demethylation Assay and 5hmC Dot Blot in Cell Free System
To assess the effect of FTO inhibitors on the enzymatic activity of methylcytosine dioxygenase, we employed the DNA 5mC demethylation assay with TET1 protein followed by 5hmC dot blot. The DNA oligo with internal 5mC modification (5’-CAG TAA CTG TGG TC/iMe-dC/GGT AAC TGA CTT GCA-3’) was synthesized from Integrated DNA Technologies (IDT) and TET1 protein was purchased from Active Motif (31417). For this assay, 100 μM DNA oligo was incubated with 200 ng/μl TET1 protein in reaction buffer (1 M HEPES PH 8.0, 5 mM Fe(NH4)2(SO4)2, 3 mM 2-oxoglutarate (203505, Sigma-Aldrich), 200 nM L-ascorbic, 10 mM ATP, and 1 M DTT) with the compounds at 37°C for 2 hours. The DNA oligos were purified and 5hmC dot blot assay was conducted to determine the 5hmC levels with 5hmC antibody (39769, Active Motif) as described previously (Su et al., 2018).
Cross-Linking Immunoprecipitation and qPCR (CLIP-qPCR)
CLIP-qPCR was utilized to validate the interactions between FTO and its targets mRNAs. Briefly, cells in 150 mm culture plates at 80% confluence were washed once with ice-cold PBS, cross-linked by UV with 150 mJ/cm2 (254 nm), and harvested by trypsinization. The nuclear fraction was isolated with freshly prepared nuclear isolation buffer (1.28 M sucrose, 40 mM Tris-HCl pH 7.5, 20 mM MgCl2, 4% Triton X-100), lysed in RNA immunoprecipitation (RIP) buffer (150 mM KCl, 25 mM Tris pH 7.4, 5 mM EDTA, 0.5 mM DTT, 0.5% NP40) with freshly added 100 U/ml RNAase inhibitor (10777019, Thermo Fisher Scientific) and 1 × protease inhibitors for sonication. For each reaction, 50 μl Protein A/G magnetic beads (88803, Thermo Fisher Scientific) were added to pre-clear nuclear lysates. In the meantime, Flag (F3165, Sigma-Aldrich) antibody and negative control IgG antibody (12–371, Millipore) were conjugated to Protein A/G magnetic Beads by incubation for 4 hours at 4°C. The conjugated beads were washed three times with RIP buffer, incubated with pre-cleared nuclear extract at 4 °C overnight. After three washes with RIP buffer, the beads were incubated with RNase-free DNase I for 15 minutes at 37°C, and Proteinase K for 15 minutes at 37°C before quenched by QIAzol lysis reagent (79306, Qiagen). The input RNA and immunoprecipitated RNA were recovered by QIAzol extraction, and dissolved in 12 μl RNase-free water. 4 μl purified RNA from each group was used for reverse transcription and qPCR.
Co-culture Assay with AML Cells and T cells
For the co-culture assays, peripheral blood mononuclear cells (PBMNCs) were isolated from healthy donor peripheral blood samples through Ficoll separation (Ficoll Paque Plus, GE17-1440-02, GE Health), and CD3 T cells were enriched from PBMNCs with CD3 MicroBeads (130-050-101, Miltenyi Biotec). The CD3 T cells were kept in RPMI 1640 with CD3/CD28 Dynabeads (11161D, Thermo Fisher Scientific) and 50 U/ml recombinant Human IL-2. In the meantime, AML cells were infected with pmiRNA1 lentivirus and GFP+ cells were selected. After treated with indicated concentration of CS1, CS2, and DMSO for 48 hours, the GFP+ cells were collected and resuspended in fresh medium. The pretreated AML cells (40,000 cells/well) were mixed with CD3 T cells at indicated ratios and co-cultured in 48-well plates for 12–16 hours. After that, the cells were collected and mixed with absolute counting beads (C36950, Thermo Fisher Scientific). The number of GFP+ cells was determined through flow cytometry analysis FlowJo V10 Software.
Generation of Human Dendritic Cells and Macrophages
Both human dendritic cells and macrophages are derived from CD14+ PBMNCs. In brief, the PBMNCs were enriched from peripheral blood samples of healthy donors and CD14+ cells were separated from PBMNCs via magnetic beads sorting with CD14 microbeads accordingly (130-118-906, Miltenyi Biotec). The CD14+ cells were differentiated into dendritic cells with 50 ng/ml GM-CSF and 500 U/ml IL-4 for 7 days; while the cells were differentiated into macrophages with 50 ng/ml M-CSF and 25 ng/ml IL-10 for 7 days. All the cells were maintained in RPMI 1640 with 10% FBS. The dendritic cells and macrophages were confirmed by CD209 and CD86, respectively. Then the dendritic cells and macrophages were treated with CS1 and CS2 for 48 hours.
Isolation of Spleen MNCs from PBS and CS1 Treated MLL-AF9 (MA9) Mice
MA9 primary leukemic mouse bone marrow cells (CD45.2+) were collected and sorted by flow cytometry when the mice developed full-blown AML. The cells were injected into sub-lethally irradiated (320 rads) secondary recipient mice with 5 × 10⁴ donor cells per mouse via tail vein injection. One week after BMT, the mice were randomly divided into CS1 and control groups. The recipient mice were injected with PBS control and 5mg/kg CS1 i.p. every other day for 20 days. Spleens were removed from mice at the end point, and homogenized into a single-cell suspension using RPMI 1640 supplemented with 2% FBS. Red blood cells were lysed using ammonium chloride (07850, STEMCELL Technologies), washed with cold PBS. Cell pellet were then resuspended in 45 μl pre-cold MACS buffer (0.5% BSA and 2mM EDTA in PBS) per 1 × 10⁷ total cells. Biotin-labeled CD45.2 (130-101-903, Miltenyi Biotec) were added to the cells and incubated for 10 minutes in the refrigerator (2–8 °C). Cells were subsequently washed with MACS buffer and resuspended in MACS buffer (1 × 10⁸ cells/mL). Streptavidin microbeads (MSPB-6003–71, Thermo Fisher Scientific) were added and the cell mixture was incubated at room temperature for 10 minutes. Cells were washed again and resuspended in 500 μl MACS buffer and then isolated with the MACS separation Columns. After collecting the CD45.2+ cells, total RNA was extracted using miRNeasy Mini Kit and polyA RNA were enriched for RNA sequencing.
RNA Sequencing and Data Analysis
Total RNA samples were isolated from cells upon CS1, C2 treatment and FTO KD with miRNeasy Mini Kit for sequencing. RNA concentration was measured by NanoDrop 1000 (Thermo Fisher Scientific, Waltham Massachusetts, US) and RNA integrity was determined using Bioanalyzer (Agilent). Each RNA sample was spiked in with an appropriate amount of either Mix1 or Mix2 according to Life Technologies’ guidelines which would lead to about 1% of the total number of RNA-Seq reads mapping to the 92 ERCC control sequences, assuming the mRNA fraction in the total RNA is 2%. Library construction of 300 ng total RNA for each sample was made using KAPA Stranded mRNA-Seq Kit (Illumina Platforms) (Kapa Biosystems, Wilmington, USA) with 10 cycles of PCR amplification. Libraries were purified using AxyPrep Mag PCR Clean-up kit (Thermo Fisher Scientific). Each library was quantified using a Qubit fluorometer (Life Technologies) and the size distribution assessed using the 2100 Bioanalyzer (Agilent Technologies, Santa Clara, USA). Sequencing was performed on an Illumina® Hiseq 2500 (Illumina, San Diego, CA, USA) instrument using the TruSeq SR Cluster Kit V4-cBot-HS (Illumina®) to generate 51 bp single-end reads sequencing with v4 chemistry. Quality control of RNA-Seq reads was performed using FastQC. Each group contains 3–4 replicates. Reads were trimmed for adaptor sequence, masked for low-complexity or low-quality sequence by Cutadapt, and then aligned to reference genome GRCh38 by STAR (Dobin et al., 2013). The expressions of the genes were calculated using RSEM (Li and Dewey, 2011), p < 0.05 was set as the threshold of the differential expressions. The reads distributed in a specific transcript were displayed by IGV (Thorvaldsdottir et al., 2013). Hierarchical cluster analysis was generated by R package cluster. Gene Set Enrichment Analysis (GSEA) and hallmark gene sets in Molecular Signatures Database (MSigDB) (Subramanian et al., 2005) were hired to calculate enriched pathways.
QUANTIFICATION AND STATISTICAL ANALYSIS
Data were analyzed with GrapPad Prism 7 and were presented as mean ± SEM or mean ± SD as indicated. Two-tailed Student’s t test was used to compare the means between groups as indicated; p < 0.05 was considered significant. Kaplan-Meier survival curves were plotted with GraphPad Prism 7 and the p values were calculated using the log-rank test. For Western blot results, representative figures from three biological replicates were shown. Densitometry analysis of the bands from Western blot was performed with GelAnalyzer.
Supplementary Material
KEY RESOURCES TABLE
| REAGENT or RESOURCE | SOURCE | IDENTIFIER |
|---|---|---|
| Antibodies | ||
| 5-Hydroxymethylcytosine (5-hmC) antibody (pAb) | Active Motif | Cat # 39769; RRID: AB_10013602 |
| m6A (N6-methyladenosine) antibody | Synaptic Systems | Cat# 202003; RRID: AB_2279214 |
| Anti-FTO antibody [EPR6895] | Abcam | Cat# ab124892; RRID: AB_10972698 |
| Anti-ILT-3 antibody | Abcam | Cat# ab229747 |
| GAPDH antibody (0411) | Santa Cruz | Cat# sc-47724; RRID: AB_627678 |
| Goat anti-rabbit IgG H&L (HRP) | Abcam | Cat# ab6721; RRID: AB_955447 |
| Goat anti-mouse IgG H&L (HRP) | Abcam | Cat# ab6789; RRID: AB_955439 |
| β-Actin (8H10D10) Mouse mAb | Cell Signaling Technology | Cat# 3700S; RRID: AB_2242334 |
| Anti-Flag M2 antibody | Sigma-Aldrich | Cat# F3165; RRID: AB_259529 |
| Normal Mouse IgG control antibody | Millipore | Cat# 12-371; RRID: AB_145840 |
| Anti-Human CD33 PE | eBioscience | Cat# 12-0339-42; RRID: AB_10855031 |
| Anti-Human CD45 BV786 | BD Horizon | Cat# 563716; RRID: AB_2716864 |
| Anti-Human CD34 FITC | eBioscience | Cat# 11-0349-42; RRID: AB_1518732 |
| Anti-rabbit IgG (H+L), F(ab’)2 Fragment (Alexa Fluor 555 Conjugate) | Cell Signaling Technology | Cat# 4413S; RRID: AB_10694110 |
| Anti-Human CD11b PE | eBioscience | Cat# 12-0118-42; RRID: AB_2043799 |
| Anti-Human CD14 APC | eBioscience | Cat# 17-0149-42; RRID: AB_10669167 |
| Anti-Human CD15 APC | eBioscience | Cat# 17-0158-42; RRID: AB_2573137 |
| Anti-Mouse CD45.1 APC | eBioscience | Cat# 17-0453-82; RRID: AB_469398 |
| Anti-Human CD85k (ILT3) APC | eBioscience | Cat# 17-5139-42; RRID: AB_2043854 |
| CD45.2 Monoclonal Antibody (104), PE | eBioscience | Cat# 12-0454-83; RRID:AB_465679 |
| FITC anti-human CD209 antibody | BioLegend | Cat# 330103; RRID: AB_1134057 |
| PE anti-human CD86 antibody | BioLegend | Cat# 374205; RRID: AB_2721632 |
| PE anti-human CD85k (ILT3) antibody | BioLegend | Cat# 333008; RRID:AB_2136645 |
| CD117 (c-Kit) Monoclonal Antibody (2B8), FITC | eBioscience | Cat# 11-1171-82; RRID:AB_465186 |
| Alexa Fluor 647 anti-mouse CD85k (gp49 Receptor) antibody | BioLegend | Cat# 144906; RRID:AB_2562044 |
| CD45.2-Biotin antibody, mouse | Miltenyi Biotec | Cat# 130-101-903; RRID: AB_2660733 |
| Chemicals, Peptides, and Recombinant Proteins | ||
| Recombinant Human FTO protein | Active Motif | Cat# 31572 |
| Recombinant Human ALKBH5 protein | Active Motif | Cat# 31589 |
| Recombinant Tet1 (1418-2136) protein | Active Motif | Cat# 31417 |
| Puromycin dihydrochloride | Sigma-Aldrich | Cat# P8833; CAS: 58-58-2 |
| (2-Hydroxypropyl)-β-cyclodextrin | Sigma-Aldrich | Cat# C0926; CAS: 128446-35-5 |
| Methoxy poly (ethylene glycol)-b-poly (D,L-lactide) | Sigma-Aldrich | Cat# 900661 |
| Hexadimethrine bromide | Sigma-Aldrich | Cat# H9268; CAS: 28728-55-4 |
| Propidium iodide | Sigma-Aldrich | Cat# P4170; CAS: 25535-16-4 |
| bisBenzimide H 33342 trihydrochloride | Sigma-Aldrich | Cat# B2261; CAS: 875756-97-1 |
| Pyronin Y | Sigma-Aldrich | Cat# P9172; CAS: 92-32-0 |
| Pronase from Streptomyces griseus | Roche | Cat# 10165921001 |
| Ammonium iron(II) sulfate hexahydrate | Sigma-Aldrich | Cat# 203505; CAS: 7783-85-9 |
| α-Ketoglutaric acid | Sigma-Aldrich | Cat# K1128; CAS: 328-50-7 |
| L-Ascorbic acid | Sigma-Aldrich | Cat# A0278; CAS: 50-81-7 |
| Bovine Serum Albumin | Sigma-Aldrich | Cat# A2058; CAS: 9048-46-8 |
| Retinoic acid | Sigma-Aldrich | Cat# R2625; CAS: 302-79-4 |
| 5-Aza-2’-deoxycytidine | Sigma-Aldrich | Cat# A3656; CAS: 2353-33-5 |
| Recombinant Human M-CSF | PeproTech | Cat# 300-25 |
| Recombinant Human GM-CSF | PeproTech | Cat# 300-03 |
| Recombinant Human IL-6 | PeproTech | Cat# 200-06 |
| Recombinant Human IL-3 | PeproTech | Cat# 200-03 |
| Recombinant Human IL-10 | PeproTech | Cat# 200-10 |
| Recombinant Human IL-4 | PeproTech | Cat# 200-04 |
| Recombinant Human SCF | PeproTech | Cat# 300-07 |
| Recombinant Human TPO | PeproTech | Cat# 300-18 |
| Recombinant Human Flt3-Ligand | PeproTech | Cat# 300-19 |
| DNase I, RNase-free | Thermo Fisher Scientific | Cat# EN0521 |
| D-Luciferin Firefly, potassium salt | Goldbio | Cat# LUCK; CAS: 115144-35-9 |
| G418 Sulfate (50 mg/mL) | Thermo Fisher Scientific | Cat# 10131027; CAS: 108321-42-2 |
| Blasticidin | Invivogen | Cat# ant-bl-1 |
| L-Glutamine (200mM) | Thermo Fisher Scientific | Cat# 25030-081 |
| Ammonium Chloride Solution | STEMCELL Technologies | Cat# 07850 |
| MEM Non Essential Amino Acids Solution (100×) | Thermo Fisher Scientific | Cat# 11-140-050 |
| Sodium Pyruvate (100mM) | Thermo Fisher Scientific | Cat# 11360-070 |
| Insulin, human recombinant zinc solution | Thermo Fisher Scientific | Cat# 12585014 |
| Penicillin Streptomycin | Thermo Fisher Scientific | Cat# 15-140-122 |
| Plasmocin prophylactic | InvivoGene | Cat# ant-mpp |
| Corning Matrigel Membrane Matrix | Thermo Fisher Scientific | Cat# CB-40234A |
| ColonyGEL-Mouse Base Medium | Reachbio | Cat# 1201 |
| ColonyGEL - Human Base Medium | Reachbio | Cat# 1101 |
| RIPA Buffer | Sigma-Aldrich | Cat# R0278 |
| Halt Phosphatase Inhibitor Cocktail | Thermo Fisher Scientific | Cat# 78420 |
| Halt Protease Inhibitor Cocktail | Thermo Fisher Scientific | Cat# 78429 |
| Paraformaldehyde powder | Sigma-Aldrich | Cat# 158127 |
| Permeabilization Buffer (10×) | eBioscience | Cat# 00-8333-56 |
| 4× Laemmli Sample Buffer | Bio-Rad | Cat# 1610747 |
| RNaseOUT Recombinant Ribonuclease Inhibitor | Thermo Fisher Scientific | Cat# 10777019 |
| Pierce Protein A/G Magnetic Beads | Thermo Fisher Scientific | Cat# 88803 |
| Ficoll Paque Plus | GE Healthcare | Cat# 17-1440-02 |
| CD3 MicroBeads, human | Miltenyi Biotec | Cat# 130-050-101 |
| CD34 MicroBead Kit, human | Miltenyi Biotec | Cat# 130-046-702 |
| CD14 MicroBeads UltraPure, human | Miltenyi Biotec | Cat# 130-118-906 |
| MagniSort Streptavidin Positive Selection Beads | Thermo Fisher Scientific | Cat# MSPB-6003-71 |
| FastDigest BamHI | Thermo Fisher Scientific | Cat# FD0054 |
| FastDigest XbaI | Thermo Fisher Scientific | Cat# FD0684 |
| Dynabeads Human T-Activator CD3/CD28 | Thermo Fisher Scientific | Cat# 11161D |
| Recombinant Human IL-2 Protein | R&D Systems | Cat# 202-IL-010 |
| Absolute Counting Beads | Thermo Fisher Scientific | Cat# C36950 |
| Critical Commercial Assays | ||
| miRNeasy Mini Kit | Qiagen | Cat# 217004 |
| RNeasy Mini Kit | Qiagen | Cat# 74104 |
| Magna MeRIP m6A Kit | Millipore | Cat# 17-10499 |
| CellTiter 96 Non-Radioactive Cell Proliferation Assay | Promega | Cat# G4100 |
| PE Annexin V apoptosis Detection Kit | BD Biosciences | Cat# 559763 |
| PolyATract mRNA isolation system IV | Promega | Cat# Z5310 |
| QuantiTect Reverse Transcription Kit | Qiagen | Cat# 205314 |
| Maxima SYBR Green qPCR Master Mix | Thermo Fisher Scientific | Cat# K0253 |
| QIAGEN Plasmid Mini Kit | Qiagen | Cat# 12125 |
| Effectene Transfection Reagent | Qiagen | Cat# 301427 |
| PCR Mycoplasma Detection Kit | Applied Biological Materials | Cat# G238 |
| m6A Demethylase Assay Kit | Abcam | Cat# ab233489 |
| In-Fusion HD Cloning Plus CE | Takara | Cat# 638916 |
| Deposited Data | ||
| RNA-seq with human AML cells (Raw and analyzed data) | This paper | GEO: GSE136204 |
| RNA-seq with murine AML cells (Raw and analyzed data) | This paper | GEO: GSE145363 |
| Experimental Models: Cell Lines | ||
| 293T | ATCC | (CRL-3216); RRID:CVCL_0063 |
| U937 | ATCC | (CRL-1593.2); RRID:CVCL_0007 |
| THP-1 | ATCC | (TIB-202); RRID:CVCL_0006 |
| MV4-11 | ATCC | (CRL-9591); RRID:CVCL_0064 |
| Kasumi-1 | ATCC | (CRL-2724); RRID:CVCL_0589 |
| TF-1 | ATCC | (CRL-2003); RRID:CVCL_0559 |
| K562 | ATCC | (CCL-243); RRID:CVCL_0004 |
| NOMO-1 | DSMZ | (ACC-542); RRID:CVCL_1609 |
| MONOMAC 6 | DSMZ | (ACC-124); RRID:CVCL_1426 |
| ML-2 | DSMZ | (ACC-15); RRID:CVCL_1418 |
| NB4 | DSMZ | (ACC-207); RRID:CVCL_0005 |
| ZR75-1 | ATCC | (CRL-1500); RRID:CVCL_0588 |
| MDA-MB-231 | ATCC | (HTB-26); RRID:CVCL_0062 |
| MA9.3ITD | Dr. James C. Mulloy (CCHMC, Cincinnati, OH) | N/A |
| MA9.3RAS | Dr. James C. Mulloy (CCHMC, Cincinnati, OH) | N/A |
| 8MGBA | Dr. Ravi Salgia (City of Hope, Duarte, CA) | N/A |
| A172 | Dr. Ravi Salgia (City of Hope, Duarte, CA) | N/A |
| Capan-1 | Dr. Ravi Salgia (City of Hope, Duarte, CA) | N/A |
| MIAPACA-2 | Dr. Ravi Salgia (City of Hope, Duarte, CA) | N/A |
| Experimental Models: Organisms/Strains | ||
| NRGS mouse | The Jackson Laboratory | Cat# JAX:024099; RRID: IMSR_JAX:024099 |
| NSG mouse | The Jackson Laboratory | Cat# JAX:005557; RRID: IMSR_JAX:005557 |
| NCI B6-Ly5.1/Cr mouse | Charles river | Cat# CRL:564; RRID: IMSR_CRL:564 |
| Oligonucleotides | ||
| ssRNA with internal m6A modifiaction 5′-AUUGUCA(m6A)CAGCAGC-3′ |
Dharmacon | N/A |
| DNA oligo with internal 5mC modification 5′-CAG TAA CTG TGG TC/iMe-dC/ GGT AAC TGA CTT GCA-3′ |
Integrated DNA Technologies (IDT) | N/A |
| DNA Oligos listed in Table S4 | Integrated DNA Technologies (IDT) | N/A |
| Recombinant DNA | ||
| pMIRNA1-FTO | This paper | N/A |
| pMIRNA1-FTO-Mut | This paper | N/A |
| pCDH-3×Flag-FTO | This paper | N/A |
| pCDH-3×Flag-FTOH231A/E234A | This paper | N/A |
| pCDH-3×Flag-FTOK216A/S229A/H231A | This paper | N/A |
| pLenti CMV Puro LUC (w168-1) | Campeau et al., 2009 | Addgene plasmid # 17477; RRID: Addgene_17477 |
| pMD2.G | A gift from Dr. Didier Trono | Addgene plasmid # 12259; RRID: Addgene_12259 |
| pMDLg/pRRE | Dull et al., 1998 | Addgene plasmid # 12251; RRID: Addgene_12251 |
| pRSV-Rev | Dull et al., 1998 | Addgene plasmid # 12253; RRID: Addgene_12253 |
| psPAX2 | A gift from Didier Trono | Addgene plasmid # 12260; RRID: Addgene_12260 |
| pLKO.1-shFTO-1 | This paper | Table S4 |
| pLKO.1-shFTO-2 | Sigma-Aldrich | Cat# TRCN0000246249 |
| pLKO.1-shYTHDF2-1 | This paper | Table S4 |
| pLKO.1-shYTHDF2-2 | Sigma-Aldrich | Cat# TRCN0000265510 |
| pLKO.1-shLILRB4-2 | Sigma-Aldrich | Cat# TRCN0000056863 |
| pLKO.1-shLILRB4-3 | Sigma-Aldrich | Cat# TRCN0000056865 |
| pLKO.1 puro | Stewart et al., 2003 | Addgene plasmid # 8453 |
| lentiGuide-Puro-sgLILRB4 | This paper | Table S4 |
| lentiGuide-Puro | Sanjana et al., 2014 | Addgene plasmid # 52963 |
| lentiCas9-Blast | Sanjana et al., 2014 | Addgene plasmid # 52962 |
| pLVX-ZsGreen | A gift from Dr. Cheng Cheng Zhang | N/A |
| ZsGreen- hLILRB4 | A gift from Dr. Cheng Cheng Zhang | N/A |
| Software and Algorithms | ||
| GraphPad Prism | GraphPad | https://www.graphpad.com/scientific-software/prism/ |
| GelAnalyzer | GelAnalyzer | http://www.gelanalyzer.com/ |
| RSEM-1.2.31 | Li and Dewey, 2011 | https://deweylab.github.io/RSEM/ |
| STAR 2.7 | Dobin et al., 2013 | https://github.com/alexdobin/STAR |
| igv-2.3.72g | Thorvaldsdottir et al., 2013 | http://software.broadinstitute.org/software/igv/ |
| GSEA-2.2.3 | Subramanian et al., 2005b | http://software.broadinstitute.org/gsea/index.jsp |
SIGNIFICANCE.
Targeting FTO suppresses cancer stem cell self-renewal and exhibits promising therapeutic effects against acute myeloid leukemia and various solid tumors. Pharmacological inhibition or genetic depletion of FTO reprograms immune response and augments T-cell toxicity via targeting LILRB4.
HIGHLIGHTS:
Development of two potent FTO inhibitors with IC50 values in the low nanomolar range
KD of FTO or pharmacological inhibition of FTO suppresses LSC/LIC self-renewal
Targeting FTO suppresses immune checkpoint gene expression and immune evasion
Targeting FTO by potent inhibitors holds therapeutic promise against various cancers
ACKNOWLEDGEMENTS
We thank Dr. Cai-Guang Yang from Shanghai Institute of Materia Medica, Chinese Academy of Sciences for providing FB23-2 and for his guidance in the NMR analysis. We thank Dr. Mi Deng and Dr. Cheng Cheng Zhang from University of Texas Medical Center for providing the pLVX-ZsGreen and ZsGreen-hLILRB4. We acknowledge the support of the Hematopoietic Tissue Biorepository core at City of Hope (COH) Comprehensive Cancer Center, which is supported by the National Cancer Institute (NCI) of the US National Institutes of Health (NIH) under award number P30CA33572. This work was supported in part by the National Institutes of Health (NIH) Grants R01 CA243386 (J.C.), R01 CA214965 (J.C.), R01 CA236399 (J.C.), R01 CA211614 (J.C.), R01 DK124116 (J.C.), The Margaret Early Medical Research Trust (R.Su), American Cancer Society (ACS) Research Scholar grant (Z.L.), NIH R50CA211404 (M.W.), R35CA197628 (M.M.), U10CA180827 (M.M.), R01CA137060 (M.M.), R01CA157644 (M.M.), R01CA172558 (M.M.), R01CA213138 (M.M.), and Cancer Center Support Grant (P30 CA33572). J.C. is a Leukemia & Lymphoma Society (LLS) Scholar. M.M. is a Howard Hughes Medical Institute (HHMI) Faculty Scholar.
Footnotes
Publisher's Disclaimer: This is a PDF file of an unedited manuscript that has been accepted for publication. As a service to our customers we are providing this early version of the manuscript. The manuscript will undergo copyediting, typesetting, and review of the resulting proof before it is published in its final form. Please note that during the production process errors may be discovered which could affect the content, and all legal disclaimers that apply to the journal pertain.
DECLARATION OF INTERESTS
A provisional patent was filed, with J.C., R.Su, D.H., X.D., H.L., and J.X. as inventors. J.C. is the scientific founder of Genovel Biotech Corp. and holds equities with the company. A.T.F. has done consulting for Celgene, Agios, Astellas, Daiichi Sankyo, and Abbvie, and Celgene and Agios are providing funding for two ongoing clinical trials that A.T.F. is running as investigator-initiated studies.
REFERENCES
- Alfayez M, and Borthakur G (2018). Checkpoint inhibitors and acute myelogenous leukemia: promises and challenges. Expert review of hematology 11, 373–389. [DOI] [PubMed] [Google Scholar]
- Baell JB, and Holloway GA (2010). New substructure filters for removal of pan assay interference compounds (PAINS) from screening libraries and for their exclusion in bioassays. J Med Chem 53, 2719–2740. [DOI] [PubMed] [Google Scholar]
- Barbieri I, Tzelepis K, Pandolfini L, Shi J, Millan-Zambrano G, Robson SC, Aspris D, Migliori V, Bannister AJ, Han N, et al. (2017). Promoter-bound METTL3 maintains myeloid leukaemia by m(6)A-dependent translation control. Nature 552, 126–131. [DOI] [PMC free article] [PubMed] [Google Scholar]
- Beatty GL, and Gladney WL (2015). Immune escape mechanisms as a guide for cancer immunotherapy. Clin Cancer Res 21, 687–692. [DOI] [PMC free article] [PubMed] [Google Scholar]
- Berger R, Rotem-Yehudar R, Slama G, Landes S, Kneller A, Leiba M, Koren-Michowitz M, Shimoni A, and Nagler A (2008). Phase I safety and pharmacokinetic study of CT-011, a humanized antibody interacting with PD-1, in patients with advanced hematologic malignancies. Clin Cancer Res 14, 3044–3051. [DOI] [PubMed] [Google Scholar]
- Boccaletto P, Machnicka MA, Purta E, Piatkowski P, Baginski B, Wirecki TK, de Crecy-Lagard V, Ross R, Limbach PA, Kotter A, et al. (2018). MODOMICS: a database of RNA modification pathways. 2017 update. Nucleic Acids Res 46, D303–D307. [DOI] [PMC free article] [PubMed] [Google Scholar]
- Burris HA 3rd, Raymond E, Awada A, Kuhn JG, O’Rourke TJ, Brentzel J, Lynch W, King SY, Brown TD, and Von Hoff DD (1998). Pharmacokinetic and phase I studies of brequinar (DUP 785; NSC 368390) in combination with cisplatin in patients with advanced malignancies. Invest New Drugs 16, 19–27. [DOI] [PubMed] [Google Scholar]
- Campeau E, Ruhl VE, Rodier F, Smith CL, Rahmberg BL, Fuss JO, Campisi J, Yaswen P, Cooper PK, and Kaufman PD (2009). A versatile viral system for expression and depletion of proteins in mammalian cells. PLoS One 4, e6529. [DOI] [PMC free article] [PubMed] [Google Scholar]
- Chen B, Ye F, Yu L, Jia G, Huang X, Zhang X, Peng S, Chen K, Wang M, Gong S, et al. (2012). Development of cell-active N6-methyladenosine RNA demethylase FTO inhibitor. J Am Chem Soc 134, 17963–17971. [DOI] [PubMed] [Google Scholar]
- Chen HM, van der Touw W, Wang YS, Kang K, Mai S, Zhang J, Alsina-Beauchamp D, Duty JA, Mungamuri SK, Zhang B, et al. (2018). Blocking immunoinhibitory receptor LILRB2 reprograms tumor-associated myeloid cells and promotes antitumor immunity. J Clin Invest 128, 5647–5662. [DOI] [PMC free article] [PubMed] [Google Scholar]
- Cho H, Gao J, and Kwon GS (2016). PEG-b-PLA micelles and PLGA-b-PEG-b-PLGA sol-gels for drug delivery. J Control Release 240, 191–201. [DOI] [PMC free article] [PubMed] [Google Scholar]
- Cowan JD, Gehan E, Rivkin SE, and Jones SE (1986). Phase II trial of bisantrene in patients with advanced sarcoma: a Southwest Oncology Group Study. Cancer Treat Rep 70, 685–686. [PubMed] [Google Scholar]
- Daver N, Garcia-Manero G, Basu S, Boddu PC, Alfayez M, Cortes JE, Konopleva M, Ravandi-Kashani F, Jabbour E, Kadia T, et al. (2019). Efficacy, Safety, and Biomarkers of Response to Azacitidine and Nivolumab in Relapsed/Refractory Acute Myeloid Leukemia: A Nonrandomized, Open-Label, Phase II Study. Cancer Discov 9, 370–383. [DOI] [PMC free article] [PubMed] [Google Scholar]
- de Forni M, Chabot GG, Armand JP, Fontana X, Recondo G, Domenge C, Carde P, Barbu M, and Gouyette A (1993). Phase I and pharmacokinetic study of brequinar (DUP 785; NSC 368390) in cancer patients. Eur J Cancer 29A, 983–988. [DOI] [PubMed] [Google Scholar]
- Deng M, Gui X, Kim J, Xie L, Chen W, Li Z, He L, Chen Y, Chen H, Luo W, et al. (2018a). LILRB4 signalling in leukaemia cells mediates T cell suppression and tumour infiltration. Nature 562, 605–609. [DOI] [PMC free article] [PubMed] [Google Scholar]
- Deng X, Su R, Feng X, Wei M, and Chen J (2018b). Role of N(6)-methyladenosine modification in cancer. Curr Opin Genet Dev 48, 1–7. [DOI] [PMC free article] [PubMed] [Google Scholar]
- Deng X, Su R, Weng H, Huang H, Li Z, and Chen J (2018c). RNA N(6)-methyladenosine modification in cancers: current status and perspectives. Cell Res 28, 507–517. [DOI] [PMC free article] [PubMed] [Google Scholar]
- Dobin A, Davis CA, Schlesinger F, Drenkow J, Zaleski C, Jha S, Batut P, Chaisson M, and Gingeras TR (2013). STAR: ultrafast universal RNA-seq aligner. Bioinformatics 29, 15–21. [DOI] [PMC free article] [PubMed] [Google Scholar]
- Dombret H, Seymour JF, Butrym A, Wierzbowska A, Selleslag D, Jang JH, Kumar R, Cavenagh J, Schuh AC, Candoni A, et al. (2015). International phase 3 study of azacitidine vs conventional care regimens in older patients with newly diagnosed AML with >30% blasts. Blood 126, 291–299. [DOI] [PMC free article] [PubMed] [Google Scholar]
- Dong H, Strome SE, Salomao DR, Tamura H, Hirano F, Flies DB, Roche PC, Lu J, Zhu G, Tamada K, et al. (2002). Tumor-associated B7-H1 promotes T-cell apoptosis: a potential mechanism of immune evasion. Nat Med 8, 793–800. [DOI] [PubMed] [Google Scholar]
- Dull T, Zufferey R, Kelly M, Mandel RJ, Nguyen M, Trono D, and Naldini L (1998). A third-generation lentivirus vector with a conditional packaging system. J Virol 72, 8463–8471. [DOI] [PMC free article] [PubMed] [Google Scholar]
- Friesner RA, Banks JL, Murphy RB, Halgren TA, Klicic JJ, Mainz DT, Repasky MP, Knoll EH, Shelley M, Perry JK, et al. (2004). Glide: a new approach for rapid, accurate docking and scoring. 1. Method and assessment of docking accuracy. J Med Chem 47, 1739–1749. [DOI] [PubMed] [Google Scholar]
- Frye M, Harada BT, Behm M, and He C (2018). RNA modifications modulate gene expression during development. Science 361, 1346–1349. [DOI] [PMC free article] [PubMed] [Google Scholar]
- Gao M, Deng J, Chu H, Tang Y, Wang Z, Zhao Y, and Li G (2017). Stereoselective Stabilization of Polymeric Vitamin E Conjugate Micelles. Biomacromolecules 18, 4349–4356. [DOI] [PubMed] [Google Scholar]
- Gopalakrishnan V, Spencer CN, Nezi L, Reuben A, Andrews MC, Karpinets TV, Prieto PA, Vicente D, Hoffman K, Wei SC, et al. (2018). Gut microbiome modulates response to anti-PD-1 immunotherapy in melanoma patients. Science 359, 97–103. [DOI] [PMC free article] [PubMed] [Google Scholar]
- Han D, Liu J, Chen C, Dong L, Liu Y, Chang R, Huang X, Liu Y, Wang J, Dougherty U, et al. (2019). Anti-tumour immunity controlled through mRNA m(6)A methylation and YTHDF1 in dendritic cells. Nature 566, 270–274. [DOI] [PMC free article] [PubMed] [Google Scholar]
- He W, Zhou B, Liu W, Zhang M, Shen Z, Han Z, Jiang Q, Yang Q, Song C, Wang R, et al. (2015). Identification of A Novel Small-Molecule Binding Site of the Fat Mass and Obesity Associated Protein (FTO). J Med Chem 58, 7341–7348. [DOI] [PubMed] [Google Scholar]
- Hirayama F, and Uekama K (1999). Cyclodextrin-based controlled drug release system. Adv Drug Deliv Rev 36, 125–141. [DOI] [PubMed] [Google Scholar]
- Hu Y, and Smyth GK (2009). ELDA: extreme limiting dilution analysis for comparing depleted and enriched populations in stem cell and other assays. J Immunol Methods 347, 70–78. [DOI] [PubMed] [Google Scholar]
- Huang H, Weng H, and Chen J (2020a). m(6)A Modification in Coding and Non-coding RNAs: Roles and Therapeutic Implications in Cancer. Cancer Cell 37, 270–288. [DOI] [PMC free article] [PubMed] [Google Scholar]
- Huang H, Weng H, Deng X, and Chen J (2020b). RNA modifications in cancer: functions, mechanisms, and therapeutic implications. Annual Review of Cancer Biology 4, 221–240. [Google Scholar]
- Huang Y, Su R, Sheng Y, Dong L, Dong Z, Xu H, Ni T, Zhang ZS, Zhang T, Li C, et al. (2019). Small-Molecule Targeting of Oncogenic FTO Demethylase in Acute Myeloid Leukemia. Cancer Cell 35, 677–691 e610. [DOI] [PMC free article] [PubMed] [Google Scholar]
- Huang Y, Yan J, Li Q, Li J, Gong S, Zhou H, Gan J, Jiang H, Jia GF, Luo C, and Yang CG (2015). Meclofenamic acid selectively inhibits FTO demethylation of m6A over ALKBH5. Nucleic Acids Res 43, 373–384. [DOI] [PMC free article] [PubMed] [Google Scholar]
- Huth JR, Mendoza R, Olejniczak ET, Johnson RW, Cothron DA, Liu Y, Lerner CG, Chen J, and Hajduk PJ (2005). ALARM NMR: a rapid and robust experimental method to detect reactive false positives in biochemical screens. J Am Chem Soc 127, 217–224. [DOI] [PubMed] [Google Scholar]
- Issa JP, Garcia-Manero G, Giles FJ, Mannari R, Thomas D, Faderl S, Bayar E, Lyons J, Rosenfeld CS, Cortes J, and Kantarjian HM (2004). Phase 1 study of low-dose prolonged exposure schedules of the hypomethylating agent 5-aza-2’-deoxycytidine (decitabine) in hematopoietic malignancies. Blood 103, 1635–1640. [DOI] [PubMed] [Google Scholar]
- Jafari R, Almqvist H, Axelsson H, Ignatushchenko M, Lundback T, Nordlund P, and Martinez Molina D (2014). The cellular thermal shift assay for evaluating drug target interactions in cells. Nat Protoc 9, 2100–2122. [DOI] [PubMed] [Google Scholar]
- Jia G, Fu Y, and He C (2013). Reversible RNA adenosine methylation in biological regulation. Trends Genet 29, 108–115. [DOI] [PMC free article] [PubMed] [Google Scholar]
- Jia G, Fu Y, Zhao X, Dai Q, Zheng G, Yang Y, Yi C, Lindahl T, Pan T, Yang YG, and He C (2011). N6-methyladenosine in nuclear RNA is a major substrate of the obesity-associated FTO. Nat Chem Biol 7, 885–887. [DOI] [PMC free article] [PubMed] [Google Scholar]
- Kang X, Kim J, Deng M, John S, Chen H, Wu G, Phan H, and Zhang CC (2016). Inhibitory leukocyte immunoglobulin-like receptors: Immune checkpoint proteins and tumor sustaining factors. Cell Cycle 15, 25–40. [DOI] [PMC free article] [PubMed] [Google Scholar]
- Krause DS, and Van Etten RA (2007). Right on target: eradicating leukemic stem cells. Trends Mol Med 13, 470–481. [DOI] [PMC free article] [PubMed] [Google Scholar]
- Krivtsov AV, Twomey D, Feng Z, Stubbs MC, Wang Y, Faber J, Levine JE, Wang J, Hahn WC, Gilliland DG, et al. (2006). Transformation from committed progenitor to leukaemia stem cell initiated by MLL-AF9. Nature 442, 818–822. [DOI] [PubMed] [Google Scholar]
- Ley TJ, Miller C, Ding L, Raphael BJ, Mungall AJ, Robertson A, Hoadley K, Triche TJ, Laird PW, Baty JD, et al. (2013). Genomic and epigenomic landscapes of adult de novo acute myeloid leukemia. N Engl J Med 368, 2059–2074. [DOI] [PMC free article] [PubMed] [Google Scholar]
- Li B, and Dewey CN (2011). RSEM: accurate transcript quantification from RNA-Seq data with or without a reference genome. BMC Bioinformatics 12, 323. [DOI] [PMC free article] [PubMed] [Google Scholar]
- Li L, Osdal T, Ho Y, Chun S, McDonald T, Agarwal P, Lin A, Chu S, Qi J, Li L, et al. (2014). SIRT1 activation by a c-MYC oncogenic network promotes the maintenance and drug resistance of human FLT3-ITD acute myeloid leukemia stem cells. Cell Stem Cell 15, 431–446. [DOI] [PMC free article] [PubMed] [Google Scholar]
- Li Z, Chen P, Su R, Li Y, Hu C, Wang Y, Arnovitz S, He M, Gurbuxani S, Zuo Z, et al. (2015). Overexpression and knockout of miR-126 both promote leukemogenesis. Blood 126, 2005–2015. [DOI] [PMC free article] [PubMed] [Google Scholar]
- Li Z, Weng H, Su R, Weng X, Zuo Z, Li C, Huang H, Nachtergaele S, Dong L, Hu C, et al. (2017). FTO Plays an Oncogenic Role in Acute Myeloid Leukemia as a N(6)-Methyladenosine RNA Demethylase. Cancer Cell 31, 127–141. [DOI] [PMC free article] [PubMed] [Google Scholar]
- Lipinski CA (2004). Lead- and drug-like compounds: the rule-of-five revolution. Drug Discov Today Technol 1, 337–341. [DOI] [PubMed] [Google Scholar]
- Liu W, Zhou M, Li Z, Li H, Polaczek P, Dai H, Wu Q, Liu C, Karanja KK, Popuri V, et al. (2016). A Selective Small Molecule DNA2 Inhibitor for Sensitization of Human Cancer Cells to Chemotherapy. EBioMedicine 6, 73–86. [DOI] [PMC free article] [PubMed] [Google Scholar]
- Lomenick B, Hao R, Jonai N, Chin RM, Aghajan M, Warburton S, Wang J, Wu RP, Gomez F, Loo JA, et al. (2009). Target identification using drug affinity responsive target stability (DARTS). Proc Natl Acad Sci U S A 106, 21984–21989. [DOI] [PMC free article] [PubMed] [Google Scholar]
- Mauer J, Sindelar M, Despic V, Guez T, Hawley BR, Vasseur JJ, Rentmeister A, Gross SS, Pellizzoni L, Debart F, et al. (2019). FTO controls reversible m(6)Am RNA methylation during snRNA biogenesis. Nat Chem Biol 15, 340–347. [DOI] [PMC free article] [PubMed] [Google Scholar]
- Miller TP, Cowan JD, Neilan BA, and Jones SE (1986). A phase II study of bisantrene in malignant lymphomas. A Southwest Oncology Group Study. Cancer Chemother Pharmacol 16, 67–69. [DOI] [PubMed] [Google Scholar]
- Myers JW, Von Hoff DD, Clark GM, and Coltman CA Jr. (1984). Phase II clinical trial with bisantrene in patients with advanced refractory small cell lung cancer. Cancer Treat Rep 68, 927–928. [PubMed] [Google Scholar]
- Niu Y, Lin Z, Wan A, Chen H, Liang H, Sun L, Wang Y, Li X, Xiong XF, Wei B, et al. (2019). RNA N6-methyladenosine demethylase FTO promotes breast tumor progression through inhibiting BNIP3. Mol Cancer 18, 46. [DOI] [PMC free article] [PubMed] [Google Scholar]
- Noe DA, Rowinsky EK, Shen HS, Clarke BV, Grochow LB, McGuire WB, Hantel A, Adams DB, Abeloff MD, Ettinger DS, and et al. (1990). Phase I and pharmacokinetic study of brequinar sodium (NSC 368390). Cancer Res 50, 4595–4599. [PubMed] [Google Scholar]
- Ohlsson E, Hasemann MS, Willer A, Lauridsen FK, Rapin N, Jendholm J, and Porse BT (2014). Initiation of MLL-rearranged AML is dependent on C/EBPalpha. J Exp Med 211, 5–13. [DOI] [PMC free article] [PubMed] [Google Scholar]
- Orskov AD, Treppendahl MB, Skovbo A, Holm MS, Friis LS, Hokland M, and Gronbaek K (2015). Hypomethylation and up-regulation of PD-1 in T cells by azacytidine in MDS/AML patients: A rationale for combined targeting of PD-1 and DNA methylation. Oncotarget 6, 9612–9626. [DOI] [PMC free article] [PubMed] [Google Scholar]
- Padariya M, and Kalathiya U (2016). Structure-based design and evaluation of novel N-phenyl-1H-indol-2-amine derivatives for fat mass and obesity-associated (FTO) protein inhibition. Comput Biol Chem 64, 414–425. [DOI] [PubMed] [Google Scholar]
- Patnaik A, Kang SP, Rasco D, Papadopoulos KP, Elassaiss-Schaap J, Beeram M, Drengler R, Chen C, Smith L, Espino G, et al. (2015). Phase I Study of Pembrolizumab (MK-3475; Anti-PD-1 Monoclonal Antibody) in Patients with Advanced Solid Tumors. Clin Cancer Res 21, 4286–4293. [DOI] [PubMed] [Google Scholar]
- Peters GJ, Kraal I, and Pinedo HM (1992). In vitro and in vivo studies on the combination of Brequinar sodium (DUP-785; NSC 368390) with 5-fluorouracil; effects of uridine. Br J Cancer 65, 229–233. [DOI] [PMC free article] [PubMed] [Google Scholar]
- Pollyea DA, and Jordan CT (2017). Therapeutic targeting of acute myeloid leukemia stem cells. Blood 129, 1627–1635. [DOI] [PubMed] [Google Scholar]
- Pratt CB, Sinkule JA, Etcubanas E, Douglass EC, Crom DB, Choi K, and Avery L (1986). Phase I clinical and pharmacokinetic study of bisantrene in refractory pediatric solid tumors. Invest New Drugs 4, 149–153. [DOI] [PubMed] [Google Scholar]
- Rothman J (2017). The Rediscovery of Bisantrene: A Review of the Literature. Int J Cancer Res Ther 2, 1–10. [Google Scholar]
- Salmon P, and Trono D (2007). Production and titration of lentiviral vectors. Curr Protoc Hum Genet Chapter 12, Unit 12 10. [DOI] [PubMed] [Google Scholar]
- Sanjana NE, Shalem O, and Zhang F (2014). Improved vectors and genome-wide libraries for CRISPR screening. Nat Methods 11, 783–784. [DOI] [PMC free article] [PubMed] [Google Scholar]
- Schwartsmann G, Dodion P, Vermorken JB, ten Bokkel Huinink WW, Joggi J, Winograd B, Gall H, Simonetti G, van der Vijgh WJ, van Hennik MB, and et al. (1990). Phase I study of Brequinar sodium (NSC 368390) in patients with solid malignancies. Cancer Chemother Pharmacol 25, 345–351. [DOI] [PubMed] [Google Scholar]
- Singh B, Kinne HE, Milligan RD, Washburn LJ, Olsen M, and Lucci A (2016). Important Role of FTO in the Survival of Rare Panresistant Triple-Negative Inflammatory Breast Cancer Cells Facing a Severe Metabolic Challenge. PLoS ONE 11, e0159072. [DOI] [PMC free article] [PubMed] [Google Scholar]
- Stahl M, and Goldberg AD (2019). Immune Checkpoint Inhibitors in Acute Myeloid Leukemia: Novel Combinations and Therapeutic Targets. Curr Oncol Rep 21, 37. [DOI] [PubMed] [Google Scholar]
- Stewart SA, Dykxhoorn DM, Palliser D, Mizuno H, Yu EY, An DS, Sabatini DM, Chen IS, Hahn WC, Sharp PA, et al. (2003). Lentivirus-delivered stable gene silencing by RNAi in primary cells. RNA 9, 493–501. [DOI] [PMC free article] [PubMed] [Google Scholar]
- Su R, Dong L, Li C, Nachtergaele S, Wunderlich M, Qing Y, Deng X, Wang Y, Weng X, Hu C, et al. (2018). R-2HG Exhibits Anti-tumor Activity by Targeting FTO/m(6)A/MYC/CEBPA Signaling. Cell 172, 90–105 e123. [DOI] [PMC free article] [PubMed] [Google Scholar]
- Subramanian A, Tamayo P, Mootha VK, Mukherjee S, Ebert BL, Gillette MA, Paulovich A, Pomeroy SL, Golub TR, Lander ES, and Mesirov JP (2005). Gene set enrichment analysis: a knowledge-based approach for interpreting genome-wide expression profiles. Proc Natl Acad Sci USA 102, 15545–15550. [DOI] [PMC free article] [PubMed] [Google Scholar]
- Tang X, Liu S, Chen D, Zhao Z, and Zhou J (2019). The role of the fat mass and obesity-associated protein in the proliferation of pancreatic cancer cells. Oncol Lett 17, 2473–2478. [DOI] [PMC free article] [PubMed] [Google Scholar]
- Thorvaldsdottir H, Robinson JT, and Mesirov JP (2013). Integrative Genomics Viewer (IGV): high-performance genomics data visualization and exploration. Brief Bioinform 14, 178–192. [DOI] [PMC free article] [PubMed] [Google Scholar]
- Toh JDW, Sun L, Lau LZM, Tan J, Low JJA, Tang CWQ, Cheong EJY, Tan MJH, Chen Y, Hong W, et al. (2015). A strategy based on nucleotide specificity leads to a subfamily-selective and cell-active inhibitor of N6-methyladenosine demethylase FTO. Chem Sci 6, 112–122. [DOI] [PMC free article] [PubMed] [Google Scholar]
- Topalian SL, Hodi FS, Brahmer JR, Gettinger SN, Smith DC, McDermott DF, Powderly JD, Carvajal RD, Sosman JA, Atkins MB, et al. (2012). Safety, activity, and immune correlates of anti-PD-1 antibody in cancer. N Engl J Med 366, 2443–2454. [DOI] [PMC free article] [PubMed] [Google Scholar]
- Vu LP, Pickering BF, Cheng Y, Zaccara S, Nguyen D, Minuesa G, Chou T, Chow A, Saletore Y, MacKay M, et al. (2017). The N6-methyladenosine (m6A)-forming enzyme METTL3 controls myeloid differentiation of normal hematopoietic and leukemia cells. Nat Med. [DOI] [PMC free article] [PubMed] [Google Scholar]
- Wang T, Hong T, Huang Y, Su H, Wu F, Chen Y, Wei L, Huang W, Hua X, Xia Y, et al. (2015). Fluorescein Derivatives as Bifunctional Molecules for the Simultaneous Inhibiting and Labeling of FTO Protein. J Am Chem Soc 137, 13736–13739. [DOI] [PubMed] [Google Scholar]
- Wang X, Lu Z, Gomez A, Hon GC, Yue Y, Han D, Fu Y, Parisien M, Dai Q, Jia G, et al. (2014). N6-methyladenosine-dependent regulation of messenger RNA stability. Nature 505, 117–120. [DOI] [PMC free article] [PubMed] [Google Scholar]
- Wei J, Liu F, Lu Z, Fei Q, Ai Y, He PC, Shi H, Cui X, Su R, Klungland A, et al. (2018). Differential m(6)A, m(6)Am, and m(1)A Demethylation Mediated by FTO in the Cell Nucleus and Cytoplasm. Mol Cell 71, 973–985 e975. [DOI] [PMC free article] [PubMed] [Google Scholar]
- Weng H, Huang H, Wu H, Qin X, Zhao BS, Dong L, Shi H, Skibbe J, Shen C, Hu C, et al. (2018). METTL14 Inhibits Hematopoietic Stem/Progenitor Differentiation and Promotes Leukemogenesis via mRNA m(6)A Modification. Cell Stem Cell 22, 191–205 e199. [DOI] [PMC free article] [PubMed] [Google Scholar]
- Wunderlich M, Mizukawa B, Chou FS, Sexton C, Shrestha M, Saunthararajah Y, and Mulloy JC (2013). AML cells are differentially sensitive to chemotherapy treatment in a human xenograft model. Blood 121, e90–97. [DOI] [PMC free article] [PubMed] [Google Scholar]
- Yang H, Bueso-Ramos C, DiNardo C, Estecio MR, Davanlou M, Geng QR, Fang Z, Nguyen M, Pierce S, Wei Y, et al. (2014). Expression of PD-L1, PD-L2, PD-1 and CTLA4 in myelodysplastic syndromes is enhanced by treatment with hypomethylating agents. Leukemia 28, 1280–1288. [DOI] [PMC free article] [PubMed] [Google Scholar]
- Yang S, Wei J, Cui YH, Park G, Shah P, Deng Y, Aplin AE, Lu Z, Hwang S, He C, and He YY (2019). m(6)A mRNA demethylase FTO regulates melanoma tumorigenicity and response to anti-PD-1 blockade. Nat Commun 10, 2782. [DOI] [PMC free article] [PubMed] [Google Scholar]
- Yap HY, Yap BS, Blumenschein GR, Barnes BC, Schell FC, and Bodey GP (1983). Bisantrene, an active new drug in the treatment of metastatic breast cancer. Cancer Res 43, 1402–1404. [PubMed] [Google Scholar]
- Ye M, Zhang H, Yang H, Koche R, Staber PB, Cusan M, Levantini E, Welner RS, Bach CS, Zhang J, et al. (2015). Hematopoietic Differentiation Is Required for Initiation of Acute Myeloid Leukemia. Cell Stem Cell 17, 611–623. [DOI] [PMC free article] [PubMed] [Google Scholar]
- Yun S, Vincelette ND, Abraham I, Robertson KD, Fernandez-Zapico ME, and Patnaik MM (2016). Targeting epigenetic pathways in acute myeloid leukemia and myelodysplastic syndrome: a systematic review of hypomethylating agents trials. Clinical epigenetics 8, 68. [DOI] [PMC free article] [PubMed] [Google Scholar]
- Zhang X, Wei LH, Wang Y, Xiao Y, Liu J, Zhang W, Yan N, Amu G, Tang X, Zhang L, and Jia G (2019). Structural insights into FTO’s catalytic mechanism for the demethylation of multiple RNA substrates. Proc Natl Acad Sci U S A 116, 2919–2924. [DOI] [PMC free article] [PubMed] [Google Scholar]
- Zhang Y, Chen HX, Zhou SY, Wang SX, Zheng K, Xu DD, Liu YT, Wang XY, Wang X, Yan HZ, et al. (2015). Sp1 and c-Myc modulate drug resistance of leukemia stem cells by regulating survivin expression through the ERK-MSK MAPK signaling pathway. Mol Cancer 14, 56. [DOI] [PMC free article] [PubMed] [Google Scholar]
- Zheng G, Cox T, Tribbey L, Wang GZ, Iacoban P, Booher ME, Gabriel GJ, Zhou L, Bae N, Rowles J, et al. (2014). Synthesis of a FTO inhibitor with anticonvulsant activity. ACS Chem Neurosci 5, 658–665. [DOI] [PMC free article] [PubMed] [Google Scholar]
- Zheng G, Dahl JA, Niu Y, Fedorcsak P, Huang CM, Li CJ, Vagbo CB, Shi Y, Wang WL, Song SH, et al. (2013). ALKBH5 is a mammalian RNA demethylase that impacts RNA metabolism and mouse fertility. Mol Cell 49, 18–29. [DOI] [PMC free article] [PubMed] [Google Scholar]
Associated Data
This section collects any data citations, data availability statements, or supplementary materials included in this article.
Supplementary Materials
Data Availability Statement
The RNA-Seq data generated in this study are available at NCBI GEO DataSets under accession number GSE136204 (https://www.ncbi.nlm.nih.gov/geo/query/acc.cgi?acc=GSE136204) and GSE145363 (https://www.ncbi.nlm.nih.gov/geo/query/acc.cgi?acc=GSE145363).