

Abstract
The so-called speed-premium, introduced in Sweden in the 1980s and still in effect in 2018, grants some advantages regarding parental leave benefits for parents that have two births within a set number of months. Previous research has shown a great increase in the prevalence of short birth intervals in the 1980s and 1990s associated with the introduction of this policy. This study shows that the previously documented spike in short birth intervals has mostly disappeared in recent years. By the 2010s, the pattern of birth intervals is similar to that seen around the time of the introduction of the speed-premium in the early 1980s. Altogether the present results suggest that the effect of the speed-premium on birth spacing is relatively small in recent years.
Keywords: Birth interval, Birth spacing, Sweden, Parental leave, Policy, Speed-premium
Introduction
Sweden has one of the most extensive systems of paid parental leave in the world, with 16 months of paid leave per child to be shared between the parents. An important feature of this system is that the benefits are largely proportional to work-related income. This entails that part-time work or no work between two births can reduce the parental leave benefit associated with the subsequent child. In this context, legislation was introduced in 1980 that allowed parents to prevent such loss of benefits if the interval between two births was shorter than 2 years. The eligibility interval was increased to 2.5 years in 1986, the level still in effect in 2018. This special provision is often referred to in the literature as the “speed-premium” in the Swedish parental leave system.
Previous studies have documented that the introduction of the speed-premium coincided with shorter birth intervals (Hoem 1990, 1993a; Andersson et al. 2006, Neyer and Andersson 2008). During the late 1980s and early 1990s, birth rates increased significantly among mothers with children in ages one and two, the group that could benefit from the speed-premium. Overall, birth intervals of 2.5 years or shorter became more common and longer births intervals became relatively less common during that period. This association helped previous studies to draw a causal link between the introduction of the policy and the shortening of birth intervals.
This study uses more recent data to show that the upsurge in short birth intervals was largely restricted to the late 1980s and early 1990s. Short birth intervals have become increasingly less common since the mid-1990s. By the 2010s, the pattern of birth intervals is similar to that seen before the expansion of the speed-premium in the early 1980s. Those results indicate the need to reconsider the association between the speed-premium and birth intervals. To contextualize the results, the next section presents a brief overview of the Swedish parental leave system.
The Speed-Premium in the Parental Leave System
The legislation that organizes the Swedish system of parental leave is complex. It has a large set of rules determining, for instance, the total number of leave days, the level of the benefit and how couples can share the leave period among themselves. Moreover, those rules have changed a number of times since the system was introduced in 1974, largely toward a greater number of leave days and an increase in the number of days reserved for each parent. This last provision aims to increase gender equality, as it encourages fathers to take at least a minimum number of days of parental leave. It is much beyond the scope of this study to present a comprehensive review of the system and all its aspects that could potentially affect childbearing decisions. This section focuses, instead, on presenting the main mechanisms of the system that create the speed-premium for birth intervals. For the interested reader, more extensive reviews of the Swedish system of parental leave system can be found elsewhere1 (Hoem 1993a; Duvander 2008; Duvander and Johansson 2012; Carlson 2013).
When the contemporary parental leave system was first introduced in the 1970s, parents were granted paid parental leave for up to 6 months per child. Instead of tying the benefit to the mother, as in most other societies, the system allowed the parents to choose how to divide the leave period among them. The number of leave days has increased gradually over the last decades and it has been set at 16 months per child since 2002. The amount of leave is set initially at 8 months for each parent, but the couple can decide to divide the leave days between them differently, with a few restrictions.2 In the current system, 3 months are reserved for each parent and they are allowed to divide the remaining 10 months among themselves. Mothers claim the vast majority of days, although the share of days claimed by fathers has increased from 5% in 1980 to 28% in 2017 (Statistics Sweden 2018). Mothers also work part-time following a birth more often than fathers do. Around 4 out of 10 mothers who had a child in ages 1 to 5 years worked part-time in 2017, but only about 1 in 10 fathers did so (Statistics Sweden 2018).
The parental leave benefit is largely proportional to one’s work-relate income in the period prior to the start of the leave. The benefit is limited to a relatively high cap. This cap is defined both in relative terms (a set proportion of one’s salary) and absolute terms (a shared maximum ceiling for all beneficiaries). In 1974, the benefit was limited at 90% of one’s income. During the recession that hit the Swedish economy in the first half of the 1990s, benefits were limited to 80% on one’s income, which was still in effect in 2018. The absolute ceiling is set by the government and is typically raised yearly to account for inflation. During the economic recession of the 1990s; however, this value was raised at a slower pace than the inflation rate. The end result is that the benefits were in practice lowered during a large part of that decade. In the early 2000s, the maximum cap was raised again to account for inflation.
Moreover, parents that had low or no income before the start of their parental leave are entitled to a low flat rate.3 While the value of the maximum ceiling is commonly adjusted yearly based on the inflation rate, the flat rate is fixed and only changed more seldom by political decision.4 In addition to the benefits from the social insurance agency, some workers are entitled to additional compensation from their employer based on collective agreements. This complement corresponds often to 10% of one’s salary. This practice started in the 1990s and in present years it covers most sectors of the labor market.
Some figures can be used to illustrate more concretely the speed-premium within this system. In 2018, the absolute ceiling paid by the social insurance agency was 29,000 kronor per month (about 2800 euros) and the flat rate for parents with low or no income was 7500 kronor per month (about 700 euros). The difference between those two figures, 21,500 kronor, indicates the theoretical uppermost value of the premium associated with a birth interval shorter than 2.5 years in 2018. The average premium is likely lower than the aforementioned theoretical maximum, however, as most parents earn incomes that grant them benefits above the flat rate. In 2017, about one in eight mothers received the flat rate. Among native-born women the proportion was even smaller, close to one in thirty (Swedish Social Insurance Agency 2018).
Most central to this study is the fact that the rules regulating the eligibility period for the speed-premium have also changed over time. When those rules were introduced in 1974, parents could benefit from the speed-premium if the interval between two births did not exceed 12 months. The eligibility interval was increased gradually in the following years, reaching 15 months in 1979. Additional legislation expanded the eligibility interval to 24 months in 1980 and further to 30 months in 1986 (Hoem 1990). There were no further changes in the length of the eligibility interval up to 2018.
Parents who work substantially reduced hours in the years following the birth of a child are a group that is likely to have responded to the successive extensions to the eligibility interval. Other groups are less likely to have responded to the policy. Parents who quickly return to the labor market at full-time work after the end of their parental leave are generally not affected by the speed-premium. Those with very low salary are also not significantly affected by the policy either, as they receive parental leave at the low flat rate regardless of their decisions on birth spacing. Those who are not aware of the policy or who do not fully understand how it works are also less likely to have responded to changes in the policy. Parents who become unemployed between two successive births are able to maintain the initial level of the benefit for the second child if they are register as jobseekers with the public employment agency. Those parents are, therefore, not likely to have benefited from changes in the speed-premium.
Data and Methods
The study uses data on the total births that occurred in Sweden between 1970 and 2017 to native-born women between the ages of 15 and 45.5 Information comes from the administrative registers maintained by Swedish national bureau of statistics (Statistics Sweden 2003). The data is coded with month precision. Births registered between 1925 and 1969 were used to determine the parity of women in 1970 (i.e., the number of children women had already given birth to). Two main types of statistics are presented: the median birth interval and birth risks by time since the previous birth.
The median interval between the first and second birth is calculated for women who had their first birth in each year between 1970 and 2013. The median interval is a measure that indicates the number of years that was required for half of mothers to have a second child. It should be noted that the measure does not pertain to a single calendar year, but to a period of years following a birth. The median interval is not shown for mothers who had their first child in 2014 and later years because fewer than half of the women in that group had a second child by 2017. Moreover, the median interval is not calculated for higher parities because fewer than 50% of mothers went on to have a subsequent birth. For instance, fewer than 50% of the women who had a second birth went on to have a third birth.
Risks of second, third and fourth births stratified by time since the previous birth are estimated using event history techniques. A piecewise constant exponential model is used, a variant of the basic exponential model. The basic idea in this approach is that birth rates are constant over predetermined time intervals (i.e., a certain time interval since the previous birth) but they can vary across intervals. This model has been widely used in the demographic literature and has been described extensively elsewhere (Hoem 1993b; Blossfeld et al. 2007; Allison 2010). Women enter the study when they reach the parity under consideration—e.g., after the birth of her first child, when studying second birth rates. Women do not enter the study after multiple births, however, as that imply special circumstances for birth intervals. Women are right-censored at their first emigration, death or their 46th birthday.
Control variables include calendar year, age of the mother and time since the previous birth. Age is grouped in two-year intervals with the exception of the first interval (i.e., ages 15–17, 18–19, …, 44–45). Number of years since the birth of the previous child is grouped into eight intervals: [0–1.5), [1.5–2), [2–2.5), [2.5–3), [3–4), [4–6), [6–8), and 8 or more years. This variable can also be seen as the age of the previous child. Between 1980 and 1985, the first two duration intervals represent eligibility for the speed-premium. From 1986 to 2017, the first three intervals show eligibility for the premium, with the third interval being the focus of the speed-premium expansion in 1986.
Results
Fertility has shown a cyclical nature in Sweden. Periods of higher and lower fertility rates have replaced each other since the 1970s (see Fig. 1). Economic cycles are one explanation to this variation, with female income positively associated with higher birth rates. Variation in the value of the parental leave benefit is another factor, as the value increased over the late 1980s and declined over the mid-1990s (Andersson 2000). The introduction of the speed-premium itself can be an explanation for the peak of total fertility rates around 1990, as a shortening of birth intervals can lead to a temporary increase in total fertility rates.
Fig. 1.
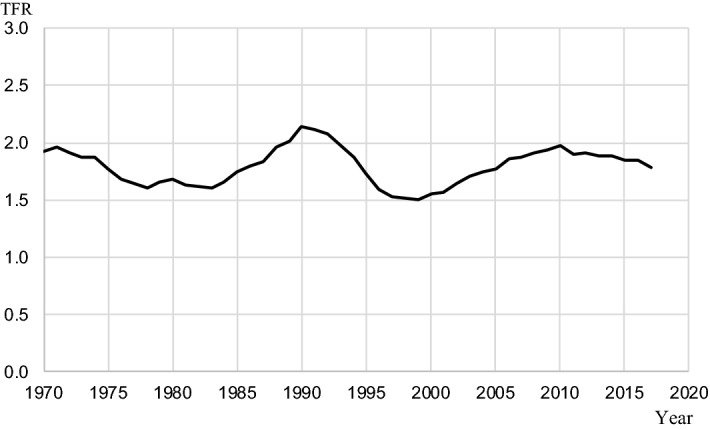
Total fertility rate, Sweden, 1970–2017
Figure 2 shows the median interval between the first and second births over the last decades. The median interval was over 3.5 years among those mothers who had their first birth in the early 1970s. It started declining in the late 1970s and it declined at a faster pace over the 1980s, reaching 2.7 years among mothers who had their first child in 1990. As pointed out by Hoem (1993a), this trend is likely to have been influenced by the introduction of the speed-premium. In particular, the expansion of the eligibility interval to 2 years in 1980 and further to 2.5 years in 1986 made it possible for a larger share of mothers to benefit from the policy.
Fig. 2.
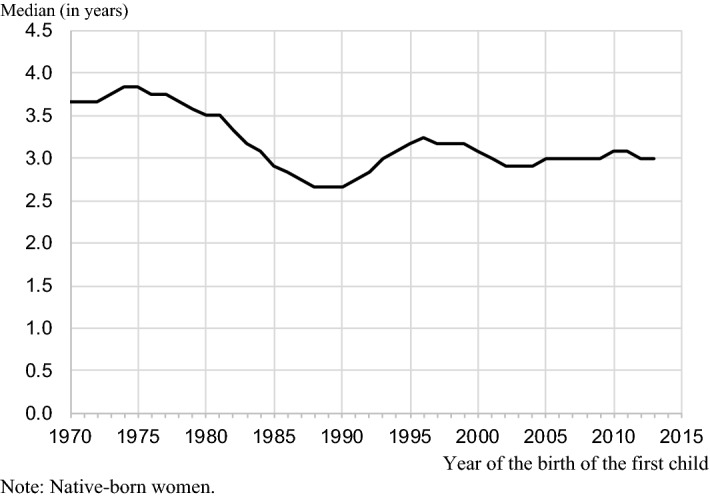
Median interval between the first and second births
A fact that has not been widely documented in the literature is that the median interval increased over the 1990s. This suggests that the impact of the speed-premium on birth intervals has weakened after the mid-1990s. The median has fluctuated around 3 years among those mothers who had their first child in 2000 and later (Fig. 2). In recent years, the median interval is at a level similar to that before the expansion of the policy in 1986.
There is a striking similarity in the distribution of birth interval between women who had their first child in the mid-1980s and more recent mothers, as highlighted in Fig. 3. The chart presents the distribution of birth intervals for four groups of women: women who had their first birth in 1980, 1985, 1990 and 2000. It shows in detail how birth intervals became more concentrated within the 2.5 years after the first birth, when mothers who had their first child in 1980, 1985 and 1990 are compared. The last group, mothers who had their first birth in 2000, is included to illustrate the distribution of birth intervals after the increase in the median interval in the 1990s. The distributions for women who had their first birth in 1985 and 2000 overlap to a large extent.
Fig. 3.
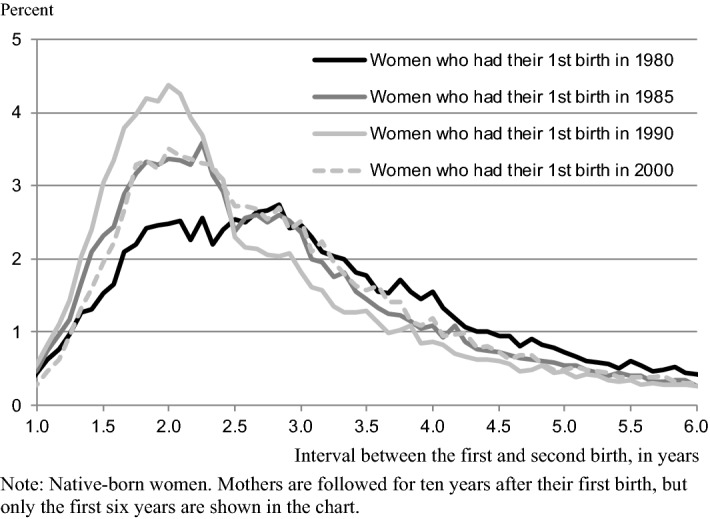
Distribution of birth interval in four groups of mothers
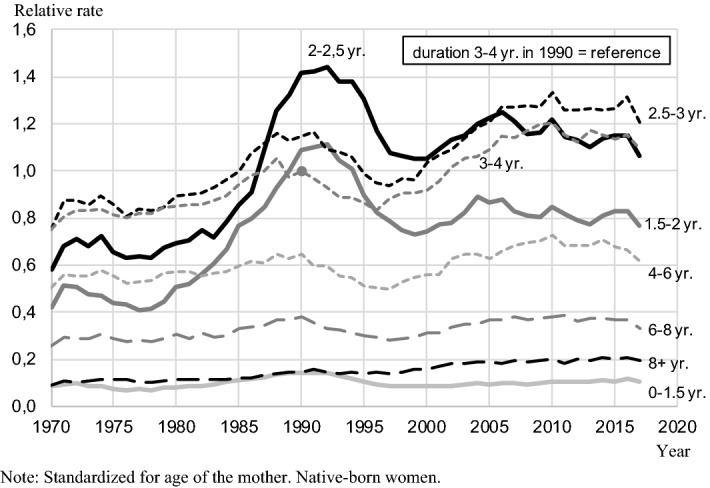
Figure 4 shows the second birth rate by duration since the birth of the first child, standardized by age of the mother, for the period from 1970 to 2017. For each year, rates at each duration are expressed as a ratio in relation to the birth rate at duration 3–4 years in that year. This allows a comparison over time of the relative weight of the birth rate at each duration that is free of the seasonal variations in general fertility levels. Moreover, since mothers with birth intervals of 3–4 years are not eligible for the speed-premium, this duration can be taken as a control group for the study of the effect of the policy. The results in Fig. 4 can be interpreted in a straightforward manner. For instance, in 1970, the birth rate at duration 2–2.5 years was 80% of the birth rate at duration 3–4 years. This is also equivalent to say that, in 1970, the birth rate of one-child mothers with a child aged 2–2.5 was 80% of the birth rate of one-child mothers with a child aged 3–4 years. Thus, birth intervals of 3–4 years were relatively more common than intervals of 2–2.5 years.
Fig. 4.
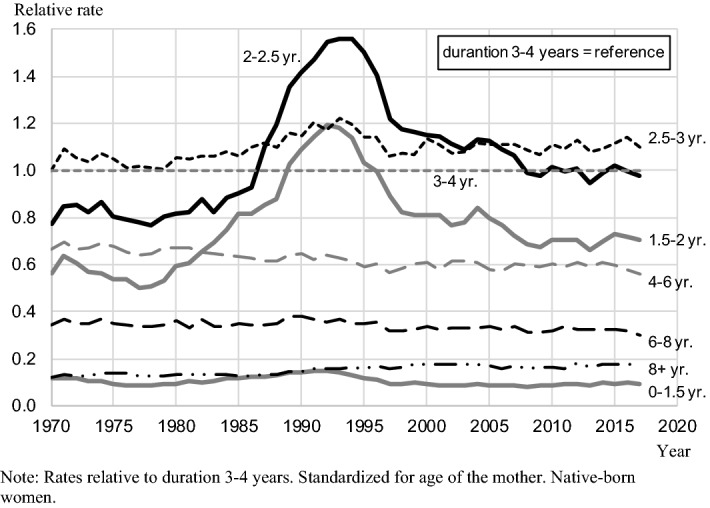
Standardized second birth rates, by time since the birth of the first child, 1970–2017
Between 1980 and 1985, women with births intervals shorter than 2 years were eligible for the speed-premium and there is a corresponding relative increase in the birth rate at durations shorter than 2 years. This is especially so at duration 1.5–2 years, as births intervals shorter than 1.5 years are generally not very common. Eligibility for the speed-premium was extended to intervals shorter than 2.5 years in 1986 and there is an associated surge in the birth rate at duration 2–2.5 years from that year to around the mid-1990s. However, this pattern starts to reverse in the early to mid-1990s. By around 2010, the birth rate at durations 1.5–2 and 2–2.5 years are almost at their same relative levels as in the mid-1980s (Fig. 4). They are, nonetheless, still higher than they were when the speed-premium was first introduced in the late 1970s.
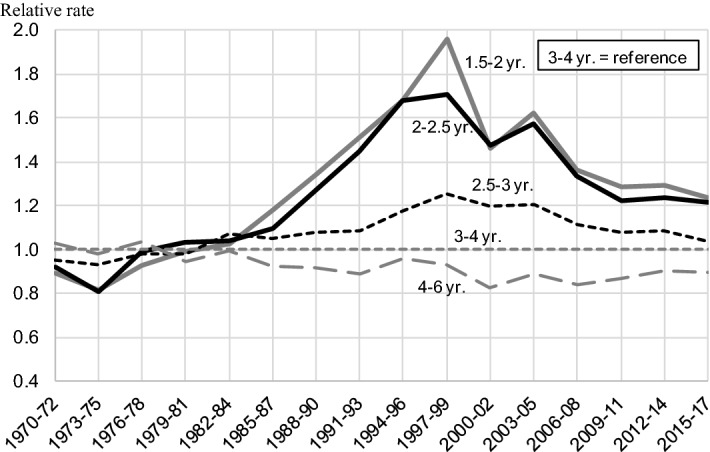
The data in Fig. 4 address straightforwardly the central question posed by this study: whether short birth intervals became less common over time, net of period variations in the general fertility levels. Nonetheless, researchers might also be interested in knowing whether this relative decline corresponds to an absolute decline in the prevalence of short birth intervals. For instance, the total fertility rate has increased in the period from 2000 to 2010 (see Fig. 1). It is therefore conceivable that birth rates increased at all durations between those years and that the decline in short birth intervals took place only in relative terms. Figure 5 helps answer this and other questions related to period variations in general fertility level. The figure shows the second birth rate by duration since the birth of the first child, standardized by age of the mother, for the period from 1970 to 2017. Differently from Fig. 4, however, all rates are expressed in relation to a single point: the birth rate at duration 3–4 years in 1990.
Fig. 5.
Standardized second birth rates, by time since the birth of the first child, 1970–2017. Rates relative to duration 3–4 years in 1990
In light of the results in Fig. 5, the explanation for the relative decline in short birth intervals since the early 1990s can be roughly divided into three main periods—the 1990s, 2000–2010 and the most recent years. Most of the 1990s is characterized by an absolute decline in birth rates at short durations (i.e., 1.5–2.5 years). Birth rates at longer durations declined at a slower pace and there was even a recuperation in the late 1990s. The net result is the sharp decline in the relative prevalence of short birth intervals shown in Fig. 4. This pattern is likely heavily influenced by the couples that postponed having their second child during the economic crisis of the early 1990s and had that desired child after the crisis.
The second period, from around 2000 to 2010, is marked by a general increase in birth rates at all durations. In relative terms, however, the increase was more concentrated at long durations. The net result is the continued decline in the relative prevalence of short birth intervals, but at a slower pace than in the 1990s. Finally, from around 2010 to 2017, birth rates at all durations have been more stable. This explains the more stable rates shown in Fig. 4 regarding the most recent period.
The decline in the prevalence of short birth intervals is not exclusive to spacing the first and second children. Third and fourth birth rates show a similar pattern. Because there are fewer third and fourth births than second births, calendar year is grouped in three-year intervals to smooth the general trends. The third birth rate at durations 1.5–2 and 2–2.5 years increased from the early 1980s to the mid-1990s. It declined since then and, in recent years, it is at levels similar to that observed in the mid-1980s (Fig. 6). The fourth birth rate at durations 1.5–2 and 2–2.5 increased until the late 1990s. The increase was even stronger than that for second and third birth rates. A decline in the fourth birth rate at short durations started around the early 2000s and, in recent years, it is also close to its level in the mid-1980s6 (Fig. 7).
Fig. 6.

Standardized third birth rates, by time since the birth of the second child, 1970–2017. Relative to duration 3–4 years. Standardized for age of the mother. Durations 0–1.5, 6–8 and 8+ years are included in the model but omitted in the figure. Native-born women
Fig. 7.
Standardized fourth birth rates, by time since the birth of the third child, 1970–2017. Relative to duration 3–4 years. Standardized for age of the mother. Durations 0–1.5, 6–8 and 8+ years are included in the model but omitted in the figure. Native-born women
Discussion
Together with the gradual expansion of the speed-premium during the early 1980s, there was a sizeable and relatively fast shortening of birth intervals. There is a general consensus in the demographic literature that this was not just momentary, but that it translated into a long-lasting new pattern of short birth spacing. This conclusion has even informed the public debate in Sweden on whether the speed-premium should be continued or abolished (SOU 2017).
This study presents some important new challenges to this narrative. The most up-to-date data indicates that the prevalence of short birth intervals has decreased noticeably in the 1990s. Short birth intervals are virtually as common in recent years as they were before the largest expansion of the speed-premium policy in the mid-1980s. Documenting this trend certainly raises the question of what factors were responsible for it. Although a definitive answer to this question is surely beyond the scope of this study, some initial speculations can be mentioned here which might help orient future research questions within this field.
Assuming that the speed-premium contributed to a shortening of birth intervals when it was introduced in the 1980s, a line of research is to investigate why its effect declined over time. This stays in line with the existing literature on this subject regarding its interpretation of birth spacing in the 1980s, but indicates a need for further research on additional factors that impact how couples decide to space children. The connection between economic cycles and fertility are one potential explanation (Andersson 2000). During the economic crisis that affected Sweden in the 1990s, unemployment rates were higher than usual and parental leave benefits were lower. Those conditions might have led some couples to wait longer to have an additional child, regardless of the speed-premium policy.
The availability of publicly funded childcare is another likely driving force. Legislation came into force in the 1990s that increased the availability of preschool as well as reduced the waiting times (Sweden Ministry of Education and Science 1999). The increased availability of childcare allowed a greater number of parents to work full-time in the years following a birth, which might have reduced the number of people that would potentially benefit from the speed-premium policy. Greater gender equality might have also played a role. As fathers take an increased number of parental leave days, there might be less need for mothers to work reduced hours after a birth. Hence, a reduced need to take advantage of the speed-premium in order to secure the parental leave benefits connected to the subsequent child. Another potential factor is a decline, over the years, in awareness of the policy by the general public and of how the policy works. It is possible that the policy was highly publicized around the time of its introduction, but not in the years after that.7
Surely, an alternative line of research is to revisit the original hypothesis laid out by previous studies that the introduction of speed-premium is a robust explanation for the shortening of birth intervals observed in the 1980s. It is possible that parents did not plan their fertility decisions based on the policy but that other factors had greater importance. The existing evidence in support of the causal link between the introduction of the policy and a sudden shortening of birth intervals during the late 1980s is strong though. In addition to coincidence in the timing of the two events within Sweden, comparisons with nearby countries with similar welfare-regimes provide additional supporting evidence. During that same time period there was no comparable shortening of birth intervals in Norway and Denmark (Andersson 2004).
At any rate, it should be kept in mind that the policy-relevant conclusion that follows from this study stands irrespective of the forces that might explain the lower prevalence of short birth intervals in recent years. The results indicate that the speed-premium policy plays a significantly smaller role, if at all, on how most parents space the birth of their children today compared to some decades ago. Therefore, eventually abolishing the speed-premium might not have a large impact on birth intervals in contemporary Sweden.
The present results have also broader implications for the study of family policies and fertility. They clearly illustrate the difficulties associated with selecting the relevant time frame to consider when investigating the effect of policies on fertility trends. In this particular case, the effect of the speed-premium policy on childbearing behavior seems to have varied considerably over a number of decades.
Acknowledgements
The author gratefully acknowledges the helpful comments provided by two anonymous reviewers.
Compliance with Ethical Standards
Conflict of interest
I have no conflict of interest to disclose.
Footnotes
Further information on the legislation pertaining to the parental leave system and additional statistics can be found at the website of the Swedish Social Insurance Agency (https://www.forsakringskassan.se).
Parental leave can be spread out longer through some mechanisms. For instance, one may work 50% and take parental leave at a 50% rate. This would mean a lower benefit per month, for a greater number of months. Periods of paid leave can also be combined with unpaid leave. Furthermore, parents have the legal right to reduced working hours with reduced pay throughout their children’s preschool years.
In order to receive the parental leave benefit above the flat rate during the first 6 months after the birth, it is necessary to have worked for the 8 months preceding the birth. Otherwise, the parent receives the flat rate. After the first 6 months following the birth, parental leave benefit is associated with the income earned when the parent requests the benefit. One of the aims of this provision is to incentivize parents, and especially women, to engage in paid work before and between births.
For instance, after being fixed at 5400 kronor per month for most of the 2000s, the flat rate was raised to 6750 kronor per month in 2014 and further to 7500 kronor in 2016.
The main reason for focusing on native-born women is that the shortening of birth intervals in the 1980 s has been largely concentrated in that group, as documented by previous studies. Changes in birth interval were much less pronounced among foreign-born mothers (Andersson et al. 2006). Seventy percent of all children born in Sweden in 2017 had a native-born mother. The proportion was higher in the previous decades.
It is also conceivable that awareness of the policy increased over time and that parents realized that the policy was not as advantageous as previous generation had thought. This would also explain why its effect declined over time.
The views and opinions expressed in the text belong solely to the author and do not necessarily reflect the position of their employer or any other agency or organization.
Publisher's Note
Springer Nature remains neutral with regard to jurisdictional claims in published maps and institutional affiliations.
References
- Agency Swedish Social Insurance. Social insurance in figures 2018. Stockholm: Swedish Social Insurance Agency; 2018. [Google Scholar]
- Allison PD. Survival analysis using SAS: A practical guide. 2. Cary, NC: SAS Institute Inc.; 2010. [Google Scholar]
- Andersson G. The impact of labour-force participation on childbearing behaviour: Pro-cyclical fertility in Sweden during the 1980s and the 1990s. European Journal of Population. 2000;16(4):293–333. doi: 10.1023/A:1006454909642. [DOI] [Google Scholar]
- Andersson G. Childbearing developments in Denmark, Norway, and Sweden from the 1970s to the 1990s: A comparison. Demographic Research. 2004;3:155–176. doi: 10.4054/DemRes.2004.S3.7. [DOI] [Google Scholar]
- Andersson G, Hoem JM, Duvander AZ. Social differentials in speed-premium effects in childbearing in Sweden. Demographic Research. 2006;14:51–70. doi: 10.4054/DemRes.2006.14.4. [DOI] [Google Scholar]
- Blossfeld H-P, Golsch K, Rohwer G. Event history analysis with Stata. New York: Lawrence Erlbaum; 2007. [Google Scholar]
- Carlson J. Sweden’s parental leave insurance: A policy analysis of strategies to increase gender equality. The Journal of Sociology & Social Welfare. 2013;40(2):63–76. [Google Scholar]
- Duvander, A. Z. (2008). Family policy in Sweden: An overview. SPaDE Working Paper, 2008:5, Stockholm University Linnaeus Center on Social Policy and Family Dynamics in Europe.
- Duvander AZ, Johansson M. What are the effects of reforms promoting fathers’ parental leave use? Journal of European Social Policy. 2012;22(3):319–330. doi: 10.1177/0958928712440201. [DOI] [Google Scholar]
- Hoem JM. Social policy and recent fertility change in Sweden. Population and Development Review. 1990;16(4):735–748. doi: 10.2307/1972965. [DOI] [Google Scholar]
- Hoem JM. Public policy as the fuel of fertility: Effects of a policy reform on the pace of childbearing in Sweden in the 1980s. Acta Sociologica. 1993;36(1):19–31. doi: 10.1177/000169939303600102. [DOI] [Google Scholar]
- Hoem, J. M. (1993b). Classical demographic methods of analysis and modern event-history techniques. In IUSSP: 22nd international population conference, Montreal, Canada (Vol. 3, pp. 281–91).
- Neyer G, Andersson G. Consequences of family policies on childbearing behavior: Effects or artifacts? Population and Development Review. 2008;34(4):699–724. doi: 10.1111/j.1728-4457.2008.00246.x. [DOI] [Google Scholar]
- SOU. (2017). Jämställt föräldraskap och goda uppväxtvillkor för barn: en ny modell för föräldraförsäkringen. Statens offentliga utredningar 2017:101. Stockholm: Wolters Kluwer.
- Statistics Sweden . Access to microdata in the Nordic countries. Örebro: Statistics Sweden; 2003. [Google Scholar]
- Statistics Sweden . Women and men in Sweden 2018: Facts and figures. Stockholm: Statistics Sweden; 2018. [Google Scholar]
- Sweden Ministry of Education and Science. (1999). Early childhood education and care policy in Sweden. Background report prepared for the OECD Thematic Review. Paris: Organisation for Economic Co-operation and Development.