Abstract
While levels of migration within countries have been trending down in a number of advanced economies, Sweden has recorded a rise in internal migration among young adults. An increase in aggregate migration levels can be the result of a decline in immobility (i.e. the absence of migration), an increase in repeat movement or a combination of both. In this paper, we draw on retrospective survey and longitudinal register data to explore the demographic mechanisms underpinning the rise in internal migration among young Swedes born in the 30 years to 1980 and we compare the migration behaviour of the youngest cohort to that of their European counterparts. Of all 25 European countries, Sweden reports the highest level of migration among young adults, which is the result of very low immobility combined with high repeat movement. The increase in migration has been particularly pronounced for inter-county moves for the post-1970 cohorts. Analysis of order-specific components of migration shows that this is the result of a decrease in immobility combined with a modest rise in higher-order moves, whereas it is the rise in higher-order moves that underpins the increase in inter-parish migration. This upswing has been accompanied by a shift in the ages at migration, characterised by an earlier start and later finish leading to a lengthening of the number of years young adults are mobile. The results indicate that change in migration behaviour is order-specific, which underlines the need to collect and analyse migration by move order to obtain a reliable account of migration trends.
Electronic supplementary material
The online version of this article (10.1007/s10680-019-09542-z) contains supplementary material, which is available to authorized users.
Keywords: Internal migration, Sweden, Cohort analysis, Completed migration rate, Completed migration distribution, Young adults
Introduction
Sweden, along with its Nordic neighbours, is a highly mobile country, with nearly 14% of its population changing address every year, which is twice the European average (Bell et al. 2015a). The intensity of both short- and long-distance migration has been broadly stable in Sweden over the last decades, which is in contrast to falling migration levels in Australia, the USA, Japan and Italy but similar to the stable patterns observed in the UK and Germany (Bell et al. 2018). Since the beginning of the twentieth century, rates of inter-parish migration have oscillated, with a peak after World War II, followed by a bust in the 1960 and 1970s (Shuttleworth et al. 2018). Since the beginning of the 1980s, there has been a gradual increase in inter-parish and inter-county migration rates (Lundholm 2007), but rates of address-changing within the same parish have gone slightly down.
While migration levels have been broadly stable, Sweden has witnessed an increase in migration levels among young adults, with the rate of annual migration between local labour markets doubling in the last 20 years (Kulu et al. 2018). Decomposing annual rates of migration between labour markets by move order and standardising for key socio-demographic characteristics, Kulu et al. (2018) have shown that this increase has been particularly pronounced for the first migration, whereas trends for higher-order migrations have been more stable. This upswing is thought to be linked to tertiary education expansion. While the number of women with tertiary qualifications tripled and that of men doubled between the 1948 and 1986 birth cohorts (Chudnovskaya and Kolk 2017; Hogskoleverket 2013), the distribution of higher educational opportunities has remained spatially uneven, prompting young adults to move to pursue further education (Amcoff and Niedomysl 2013).
As in the case with other demographic processes, period indicators of migration are likely to be distorted by tempo effects if the mean age at migration evolves (Bernard 2017a). To circumvent this issue, we take a cohort approach by comparing migration behaviour between the ages of 18–30 of individuals born in Sweden between 1951 and 1980 and compute a series of order-specific measures of migration that reflect the lifetime behaviour of each cohort, which has not been taken into account in previous cohort analyses of migration in Sweden (Kolk 2019). In this paper, we seek to shed new light by examining order-specific components of migration change. In doing so, we take an explicitly demographic approach to migration; we focus on the average number of migrations and their timing, which have not been considered in previous studies (i.e. Kulu et al. 2018), but do not consider the spatial patterns of migration between the counties and parishes of Sweden, which has been the predominant focus in studies taking a period approach.
Europe is known to exhibit a marked spatial gradient of high mobility in the north and west and low mobility in the south and east (Esipova et al. 2013; Rees and Kupiszewski 1999; Sánchez and Andrews 2011). However, existing studies have looked at total populations and it is unclear whether this spatial pattern holds for young adults. To provide a broader context against which to interpret the results, we first use retrospective survey data to compare the migration behaviour of young adults born between 1971 and 1980 in 25 European countries as comparative analysis of demographic processes can reveal commonality and highlight unusual patterns. We then draw on the Population Register of Sweden to calculate for migration between counties and parishes the average number of migrations and estimate a series of order-specific indicators to examine the progression to higher-order migrations. Finally, we decompose the average number of migrations in Sweden into four components—proportion of migrants, mean age at first move, mean age at last move and mean migration interval—and quantify the relative importance of each factor in driving internal migration up. We conclude by highlighting the importance of analysing migration by move order to identify changes in migration behaviour and discuss how this might be achieved in the European context using the methods outlined in this paper.
Data and Methods
This paper draws on two datasets that provide a complementary perspective on the migration behaviour of young adults in Sweden. First, we draw on retrospective survey data from the 2005 Eurobarometer, which collected all changes of address since leaving the parental home in 25 European countries for over 23,000 individuals. While a distinction between short- and long-distance migration cannot be made, this approach has the advantage producing migration estimates that are not affected by differences in spatial units, which is essential when comparing countries to avoid the modifiable areal unit problem (MAUP) (Openshaw 1984). This is particularly relevant to cross-national comparisons because the level of migration increases with the number of spatial units (Courgeau 1973). We use these data to compare the migration behaviour of Swedes with that of their European counterparts and restrict the analysis to individuals born between 1971 and 1980 who moved between the ages of 15–35 (n = 2873).1 As with any retrospective data, this dataset faces a number of limitations including possible recall errors (Smith and Thomas 2003). Another potential limitation of retrospective data is that they are based on survivors only. Survivor bias is expected to be small, particularly given that we focus on young adults, but results should strictly speaking be interpreted as conditional on survival to the date of the survey.
To examine migration trends, we then use data from the Population Register of Sweden for individuals born between 1951 and 1980, which provides individuals’ full migration histories since birth as collected by the Swedish Tax Office. We use restrict the analysis to Swedish-born individuals that did not emigrate or die before 2012, which corresponds to a sample of approximately 80 to 100,000 individuals for each annual birth cohort (98,622 born 1951 and 85,078 born 1980) or 2,864,366 individuals in total. To obtain life-courses of comparable lengths for all cohorts, we then restrict the analysis to the ages of 18–30 years, which corresponds to the period of the life-course where migration behaviour has increased in the last decades (Kulu et al. 2018; Shuttleworth et al. 2018). Information on individuals’ de-jure place of residence is available at the end of year at two spatial scales parish and county, which we use to quantify inter-county and inter-parish migration. While we could recode the number of counties so that they are stable over time (n = 21), we could not do so for parishes, which after a long period of stability (n ≈ 2600 in the 1970s, 1980s and 1990s) have been progressively collapsed, resulting in a continuous decrease in their number down to about 1500 in 2010. This will inevitably exert a downward trend on the average number of migrations recorded for younger cohorts. While all changes of address have been collected since 1978, we chose not to use these data as it would have prevented us from including the earlier birth cohorts in the analysis. Another limitation relates to a gradual increase in the share of university students who chose to register their place of usual residence at their study location, instead of at their parents’ household (Lundholm 2007). We have found trends for males and females to be broadly similar and thus we report results jointly for both sexes throughout the paper.2
We harness these datasets to a series of cohort measures recently proposed by Bernard (2017b), which parallel those long employed in the analysis of fertility and mortality to gauge differences in levels and patterns between cohorts. The analysis presented here is confined to a subset of measures that capture the key aspects of migration. Table 1 lists each migration measure in summary form, providing a definition and an algebraic representation, where M corresponds to the number of migrations, P to the number of individuals X to the age at migration, subscript i to the order of each migration (first, second, etc.) and n to an individual. Thus, refers to the number of individuals who migrated i times and to the number of migrations of order i for all i > 0. corresponds to the age at migration of individual n.
Table 1.
Cohort measures of migration.
Source: Bernard (2017a)
| Measures | Definition | Methods | Equations |
|---|---|---|---|
| Completed migration rate | Average number of migrations per individual by the end of their migratory life | (1) | |
| Completed migration distribution | Proportion of a cohort who migrated exactly i times | (2) | |
| Migration progression ratios | Proportion of a cohort who migrated i times and who went on to migrate at least once more | (3) | |
| Mean age at migration | Mean age at which individuals in cohort migrated | (4) | |
| Order-specific mean age at migration | Mean age at which individuals in cohort migrated for the ith times | (5) | |
| Mean migration interval | Average interval between all migrations for individuals who migrated at least twice | (6) |
The first of these measures is the completed migration rate (CMR), sometimes referred to as the cohort migration expectancy (Long 1973) or the cohort total migration rate (Kolk 2019). It represents the average number of migrations as defined by Eq. (1). It is readily comparable across cohorts and indicates whether the overall level of migration is high or low. Because we focus on young adults, we calculate this measure for a specific age range and annotate it accordingly. For example, refers to the average number of migrants between the ages of 18–30. Because the actual migration behaviour of individuals is more heterogeneous than this summary statistic, the completed distribution decomposes the population according to the number times they migrated, as indicated in Eq. (2), and hence reveals the proportion of non-migrants, infrequent migrants and frequent migrants. Migration progression ratios (MPRs) depict the underlying, incremental migration process by measuring the proportion of individuals that, having made a given number of migrations, proceed to migrate at least one more time as shown in Eq. (3). Mean age at migration summarises migration age patterns by showing whether populations are migrating early or late in life. It can be computed for all migrations, as indicated by Eq. (4), or for migrations of a particular order, as shown by Eq. (5). The last measure relates to the interval between consecutive migrations, which indicates the extent to which migrations are close to each other in time or are spaced out, as indicated by Eq. (6). Further information and worked examples can be found in Bernard (2017b).
Internal Migration Behaviour of Young European Adults
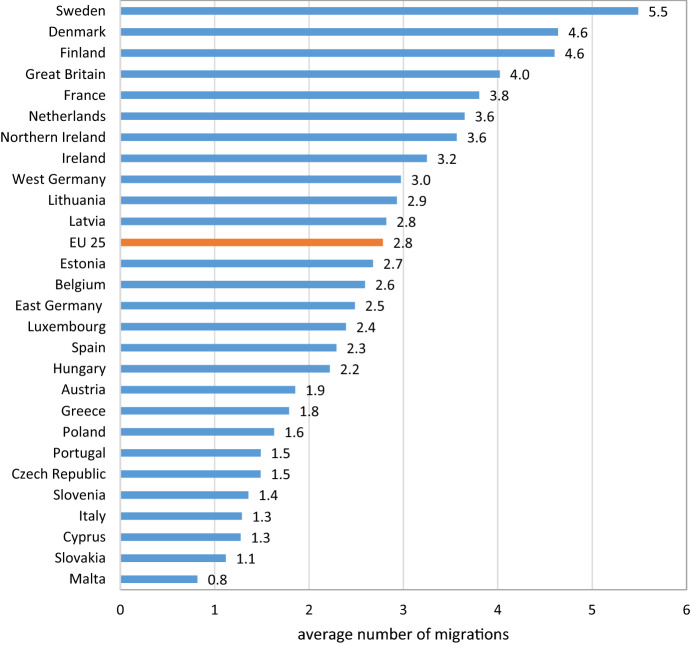
Figure 1 reports the completed migration rate between the ages of 15–35 ) in 25 European countries. It shows that Sweden is by far the most mobile country. It is the only country where young adults move on average more than five times, which is nearly double the European average. A marked north–south and east–west gradient is apparent, with the high CMRs of Sweden, Denmark and Finland moderating southwards and eastwards through to the France, the Netherlands and Northern Ireland, declining further in Spain, Hungary and Greece, reaching very low levels in Portugal, Slovenia, the Czech Republic and Italy, where young adults move an average 1.5 times or less.
Fig. 1.
Completed migration rate between 15 and 35 years of age ). Note: The completed migration rate corresponds to the average number of migrations.
Source: 2005 Eurobarometer, cohorts born between 1971 and 1980, authors’ calculations
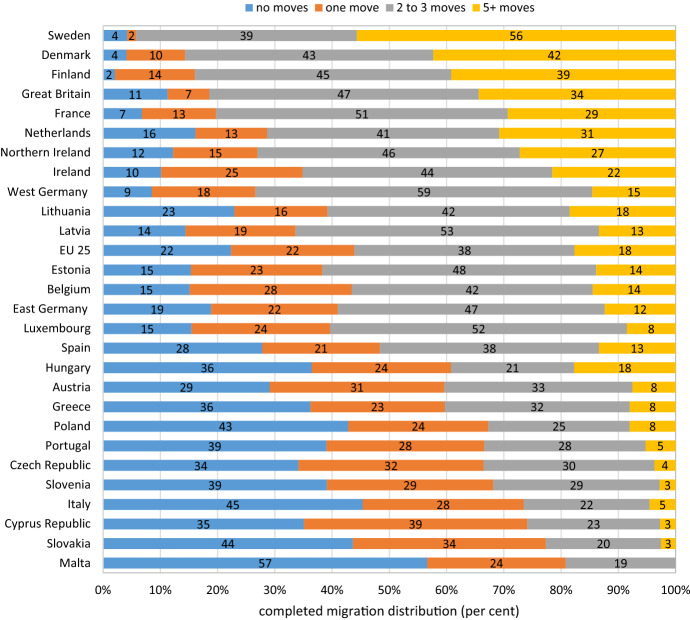
While the CMR is a summary measure that is useful for identifying high and low migration countries, the actual migration behaviour of individuals is more heterogeneous than this summary statistics suggests. To describe the actual range of migration experiences of young European adults, the completed migration distribution ) decomposes populations according to the exact number of times individuals migrated as young adults and hence reveals the proportion of non-migrants, infrequent migrants and frequent migrants. Figure 2 shows that high level of migration in Sweden is the result of a very low percentage of non-movers, with less than 5% not moving between the ages of 15–35, combined with a large proportion of repeat movers, with more than 55% of respondents moving at least five times. A similar pattern characterises Denmark and Finland. In contrast, the low mobility countries of southern and eastern Europe display the opposite pattern, with substantial proportions of non-movers and very low proportion of frequency movers. In Poland, Italy and Slovakia more than 40% of young adults never moved and less than 5% moved five times or more. In countries with intermediate levels of migration, such as France, Ireland and Germany, Spain and Austria, two to three is the most common number of moves among young adults. These results conform closely to the regional variations identified in previous comparatives studies based on total populations and show that the migration experience of young adults differs widely across Europe. While young Swedes are clearly more mobile than their European counterparts, their migration patterns of low immobility3 and high repeat movement are similar to those of their Nordic neighbours. Having established regional variations in migration levels for a cohort of individuals born in the 1970s, the next section examines changes in migration behaviour in Sweden for individuals born in the 30 years to 1980.
Fig. 2.
Completed migration distribution between 15 and 35 years of age ). Note: Countries are ranked in order of decreasing CMRs.
Source: 2005 Eurobarometer, cohorts born between 1971 and 1980, authors’ calculations
Evolution of Cohort Migration in Sweden
Figure 3 reports the average number of migrations ) by annual birth cohort, distinguishing between inter-county and inter-parish migration. It shows that following a period of subdued migration for cohorts born in the 1950s and 1960s, the completed migration rate of inter-parish migration increased for cohorts born after 1960, while inter-county migration started increasing for cohorts born after 1970, reaching 1.0 migration between counties and 2.8 migrations between parishes for the youngest cohort. This upswing was particularly pronounced for inter-county migration, with the average number of moves increasing by nearly 80 per between the first and last cohorts, compared with a 38% increase for inter-parish migration, which is in part due to the decrease in the number of parishes.
Fig. 3.
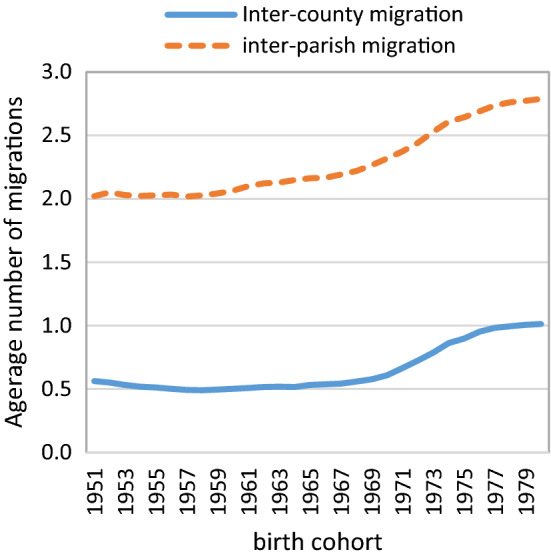
Completed migration rate ) by birth cohort.
Source: Swedish Population Register, authors’ calculations
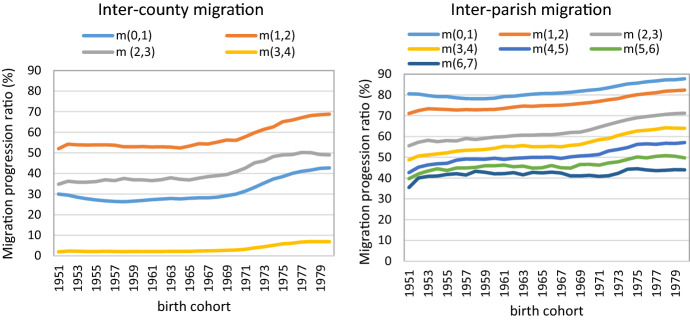
To describe the actual range of migration experiences, migration progression ratios measure the proportion of individuals who, having made a given number of migrations, proceed to migrate at least of once more. Figure 4 depicts the migration trajectory of different cohorts by reporting migration progression ratios by move order. It shows that the increase in the average number of inter-county migrations for cohorts born in the early 1970s onward was the result of an upswing in the proportion of young adults who migrated at least once or, in other words, a decrease in immobility. Less than 30% of the 1950s and 1960s cohorts migrated at least once compared with over 50% of the cohorts born after the mid-1970s. At the same time, the proportion of first-time migrants who progressed to the second migration increased significantly from slightly over 50% for cohorts born before 1970 and increased thereafter to reach nearly 70% for the youngest cohort. The proportion of young adults progressing to their third migration progressively rose, reaching more than 50% for the youngest cohort, while progression ratios to their fourth move increased more moderaltely and remained below 8%. Collectively, these results indicate that the rise in inter-county migration observed for cohorts born after the 1970s was the result of a decline in immobility combined with a rise in repeat and return movement, particulary moves of order 2 and 3. The trend is broadly similar for inter-parish migration although it is the rise in repeat movement, particularly migrations of order three to five, that underpins most of the increase in the complete migration rate among younger cohorts. In contrast, the proportion of first-time movers increased modestly from about 80% for the 1950s and 1960s cohorts to over 87% for cohorts born in the mid-1970s onward, indicating that less than 15% of Swedes did not change the parish of residence between the ages of 18–30. For cohorts born after 1975, inter-parish migration progression ratios remain above 50% up to the fourth move, which indicates that migrants were very likely to progress to the next move. This underpins the very high level of repeat movement observed in Sweden compared with other European countries.
Fig. 4.
Migration progression ratios () by birth cohort. Note: m (i, i + 1) indicates the proportion of migrants who migrated i times and went on to migrate at least once more.
Source: Swedish Population Register, authors’ calculations
The average number of times individuals migrate in their lives is the result of a number of processes, one of which is the age at which they migrate for the first time as young adults. Age at first migration is fundamental because it marks the beginning of one’s migration career and there is strong evidence at both an individual- and population-level that young starters are more likely to progress to migrating at least a second time and, as a result, report a higher number of lifetime migrations that later starters (Bernard 2017b). This can be seen in Fig. 5, which shows for selected cohorts migration progression ratios to the second move against ages at first move for inter-parish migration. For the 1980 cohort, a full 90% of individuals who migrated for the first time by the age 21 went on to migrate at least once more compared with less than 50% of individuals who did so after the age of 26. The relationship between age at first move and the probability of transitioning to the second move holds across cohorts, and similar patterns have been found in 16 OECD countries (Bernard et al. 2017). An equally important factor is the age at last migration, which dictates with the age at first migration the average number of years individuals are mobile. Finally, the timing it takes individuals to progress to the next migration will have an impact on their overall migration levels as shorter migration interval means that successive migrations are spaced closer together. These different factors come into play and interact to generate a completed migration rate unique to each cohort.
Fig. 5.
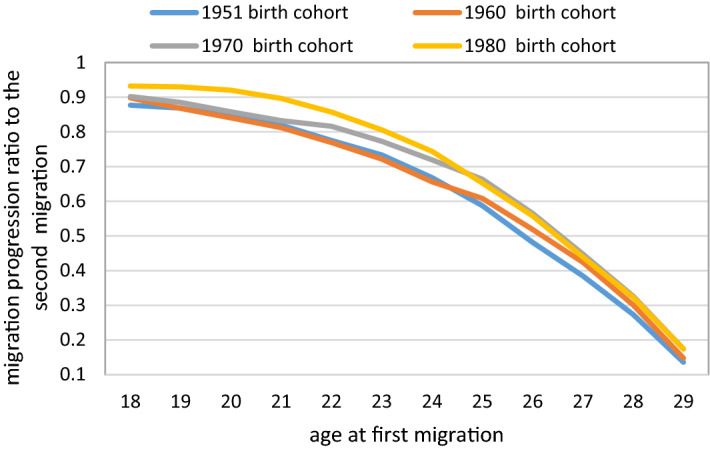
Age at first migration against migration progression ratio to the second migration, inter-parish migration, selected cohorts. Note: The migration progression ratio to the second migration corresponds to the proportion of first-time migrants who moved at least once more.
Source: Swedish Population Register, authors’ calculations
It is therefore possible to mathematically express the completed migration rate as a function of these components as demonstrated by Bernard et al. (2019):
| 7 |
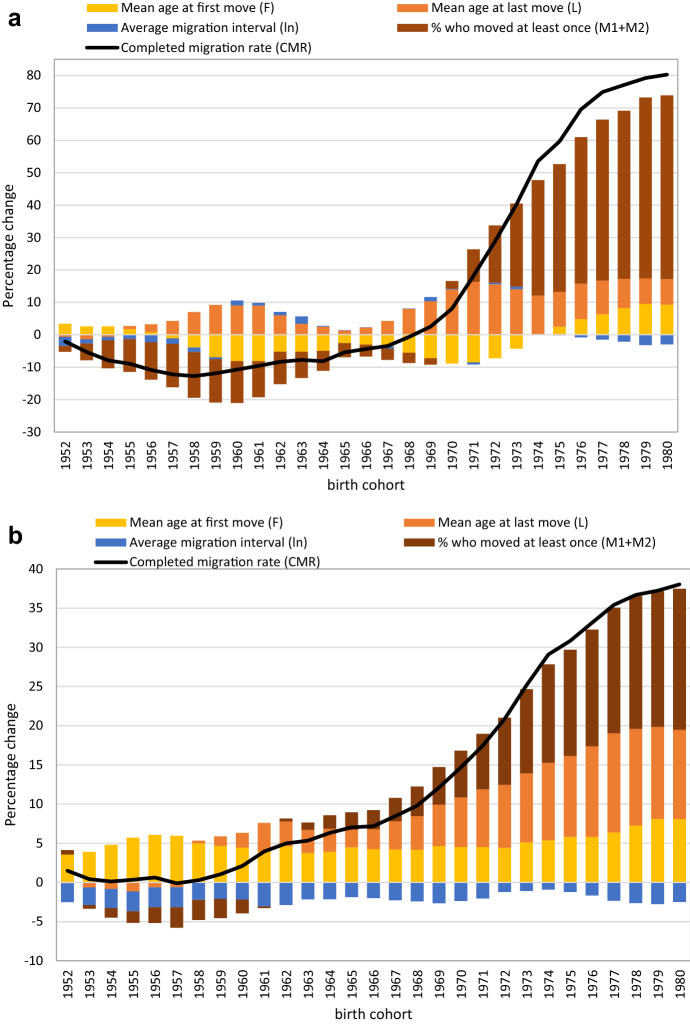
where M1 is the proportion of individuals who moved exactly once, M2 is the proportion of individuals who moved at least twice, F is the mean age at first move, L is the mean age at last move and I is the mean length of all intervals between consecutive moves for individuals who moved at least twice. We use Eq. (7) to quantify the relative contribution of each component to differences in completed migration. For each cohort, we calculated each component for inter-county and inter-parish migration. Figure 6 shows the percentage of the difference in the completed migration rate attributable to each component in comparison with the 1951 birth cohort. This was obtained by replacing the value of each component with that of subsequent cohorts, holding the other components unchanged and then computing the percentage difference between this counterfactual CMR and the observed CMR for each cohort. For ease of reading, M1 and M2 are reported jointly.
Fig. 6.
a Percentage difference in completed migration rate ) compared with the 1951 cohort and percentage attributable to each component, a inter-county migration, b inter-parish migration. Note: The percentage difference in CMR attributable to each component (M1 + M2, F, L, and In) was obtained by replacing the value of each component with that of subsequent cohorts, holding the other components unchanged and then computing the percentage different between this counterfactual CMR and the observed CMR for each cohort. Results should be interpreted as follows: CMR for the 1957 birth cohort is 11% lower than the 1951 cohort. A lower proportion of movers, longer migration intervals and older mean age first move contributed to this decline, while older mean age at last move had the reversed effect.
Source: Swedish Population Register, authors’ calculations
For inter-county migration, the gradual decline for pre-1970 cohorts was the result of a decrease in the proportion of non-migrants combined with a younger mean ages at first migration, although the a postponement of last migration had a small counteracting effect on overall migration levels. The increase in inter-county migration for the cohorts born after 1970 has been manifested by a significant increase in the overall proportion of young adults who migrated at least once and a progressive decrease in the mean age at first move. Of the 80% increase in recorded for the 1980 cohort, 57% was attributable to a higher proportion of migrants, 9% to younger ages at first move and 8% to older ages at last move. The average interval between migrations somewhat lengthened, which reduced the impact of the first three variables on competed migration by about 3%. Similar changes contributed to the progressive increase in inter-parish migration, which was mainly caused by a decrease in the proportion of non-migrants and a lengthening of the average number of years young adults were mobile because of an earlier start and a later finish. As for inter-county migration, the lengthening of the average interval between consecutive migrations has had a small counteracting effect for all cohorts. Thus, the marked increase in cohort migration for post-1970 cohorts was the result of several changes in migration behaviour that combined to contribute to higher completed migration rates.
Conclusion and Discussion
While overall migration levels have been broadly stable, Sweden has witnessed an increase in migration levels among young adults. Drawing on longitudinal register data, we have employed a cohort approach to explaining changes in the migration behaviour among young adults born between 1951 and 1980 and illustrated the importance of using order-specific measures. The results show that the increase has been particularly pronounced for inter-county migration, which rose significantly for cohorts born after the 1970s, following a period of decline for earlier cohorts. While inter-parish migration progressively increased for all birth cohorts, it did so at a slower rate although and this is in part due to a decrease in the number of parishes. Using order-specific measures, we showed that the rise in inter-county migration was mainly the result of a decrease in immobility combined with a more modest rise in higher-order moves, whereas for inter-parish migration it is the rise in higher-order moves than underpins the increase in migration, particularly for cohorts born after 1970. For both inter-county and inter-parish migration, this upward trend was accompanied by a shift in the ages at migration, characterised by an earlier start and later finish leading to a lengthening of the number of years young adults were mobile. This effect was, however, slightly counteracted by an increase in the average interval between consecutive moves. These shifts have contributed to Sweden recording the highest level of migration among young European adults born in 1971 and 1980, with an average of 5.5 changes of address between the ages of 15–35, which is twice the European average.
While levels of internal migration have fallen in a number of advanced economies, particularly Australia and the USA (Champion et al. 2018), there is no evidence of a migration decline among young Swedes. Period trend analysis has also shown a dramatic increase in the migration intensity of young adults in the UK, in contrast with broadly stable migration intensities among other age groups (Lomax and Stillwell 2018), which underlines the importance of disaggregating migration trend analysis by age group. Both in the UK (Wyness 2010; Champion and Shuttleworth 2017) and Sweden (Kulu et al. 2018), policy changes to the university sector initiated in the 1990s, which have resulted in the expansion in numbers participating in higher education, have been put forward as the primary reason for increased migration levels among young adults. This hypothesis is supported by the fact migration levels have been stable among other age groups (Shuttleworth et al. 2018; Fischer and Malmberg 2001). In Sweden in the 30 years to 2010, students have increasingly studied further afield from their parental home despite policies to regionalise education and facilitate access (Andersson et al. 2004). This mobility pattern can be explained by increased enrolment in older traditional universities (Chudnovskaya and Kolk 2017), which is likely to underpin the increase in inter-county migration level of post-1970 birth cohorts.
Results of our cohort analysis indicate that change in migration behaviour is order-specific. For example, the rise in inter-parish migration for post-1970 cohorts was mainly caused by an increase in the rate of movers of order three to five. This means that using all-move data, irrespective of mover order, can obscure the complexity of underling changes and thus conceal the extent of changes in migration behaviour. This highlights the need to collect and analyse migration by move order to obtain an accurate account of change and explain the evolution of migration behaviour. In addition, decomposition analysis has showed that changes in overall migration are the result of several distinct but interrelated aspects of migration behaviour, including age at first and last migrations and the average migration interval, which can only be computed with order-specific data.
To date, very few studies have considered the order of moves and examined whether changes in migration behaviour are order-specific (Kulu et al. 2018; Pelikh and Kulu 2018) and this is mainly because of the limited availability of adequate data. Migration is most commonly measured in censuses as a transition by comparing the place of residence at two points in times (Bell et al. 2015b), which is based on a dichotomy between movers and non-movers, irrespective of move order. Migration data by move order can be obtained either from prospective data such population registers, administrative records or longitudinal surveys conducted over a sufficiently long period or from retrospective survey data of complete migration histories. Europe benefits from a number of comparable retrospective surveys, including the Study of Health and Ageing in Europe, which retrospectively collect in 2007 the complete residential history of baby-boomers in 12 European countries. While such a dataset can shed new light on the migration behaviour of particular cohorts, it does not permit trend analysis. Alternatively, population registers and administrative records can be used to examine order-specific components of migration change. However, while population registers are an important source of demographic data in Europe (Poulain and Herm 2013), access to individual-level data follows strict protocols that limits their use to a few countries. National statistical offices could estimate and make publicly available aggregate migration indicators disaggregated by move order as it has long been done for fertility measures. Such effort would represent an important step forward in the analysis and understanding of migration, particularly in the European context, as reasons for diverging trends in levels of internal migration remain poorly understood including among young adults who remain the most mobile group in all countries.
Electronic supplementary material
Below is the link to the electronic supplementary material.
Acknowledgements
The authors gratefully acknowledge the support of the Australian Research Council under ARC Early Career Discovery Project (DE160101574) and Riksbankens Jubileumsfond (P17-0330:1).
Footnotes
The Eurobarometer did not collect the age at which moves took place, except the age at leaving the parental home. For this reason, we could not restrict the analysis to the ages of 18–30 as we did with Swedish register data and had to analyse migration behaviour over a wider age range (e.g. 15–35).
See Kolk (2019) for sex-specific overall migration patterns.
Immobility is defined as the absence of migration in given interval and thus does not refer the inability of a person to move around in daily activity without help or aids.
Publisher's Note
Springer Nature remains neutral with regard to jurisdictional claims in published maps and institutional affiliations.
References
- Amcoff J, Niedomysl T. Back to the city: Internal return migration to metropolitan regions in Sweden. Planning and Environment A. 2013;45(10):2477–2494. doi: 10.1068/a45492. [DOI] [Google Scholar]
- Andersson R, Quigley JM, Wilhelmson M. University decentralization as regional policy: The Swedish experiment. Journal of Economic Geography. 2004;4(4):371–388. doi: 10.1093/jnlecg/lbh031. [DOI] [Google Scholar]
- Bell M, et al. Internal migration and development: Comparing migration intensities around the world. Population and Development Review. 2015;41(1):33–58. doi: 10.1111/j.1728-4457.2015.00025.x. [DOI] [Google Scholar]
- Bell M, et al. Internal migration data around the world: Assessing contemporary practice. Population, Space and Place. 2015;21(1):1–17. doi: 10.1002/psp.1848. [DOI] [Google Scholar]
- Bell M, Charles-Edwards E, Bernard A, Ueffing P. Global trends in internal migration. In: Champion T, Cooke T, Shuttleworth I, editors. Internal migration in the developed world: are we becoming less mobile? London: Routledge; 2018. pp. 76–97. [Google Scholar]
- Bernard A. Cohort measures of internal migration: Understanding long-term trends. Demography. 2017;54(6):2201–2221. doi: 10.1007/s13524-017-0626-7. [DOI] [PubMed] [Google Scholar]
- Bernard A. Levels and patterns of internal migration in Europe: A cohort perspective. Population Studies. 2017;71(3):293–311. doi: 10.1080/00324728.2017.1360932. [DOI] [PubMed] [Google Scholar]
- Bernard A, Bell M, Zhu Y. Migration in China: A Cohort approach to understanding past and future trends. Population Space and Place. 2019;2019:e2234. [Google Scholar]
- Bernard A, et al. Residential mobility in Australia and the United States: A retrospective study. Australian Population Studies. 2017;1(1):41–54. doi: 10.37970/aps.v1i1.11. [DOI] [Google Scholar]
- Champion T, Cooke T, Shuttleworth I. Internal migration in the developed world: Are we becoming less mobile? London: Routledge; 2018. [Google Scholar]
- Champion AG, Shuttleworth I. Is longer-distance migration slowing? An analysis of the annual record for England and Wales since the 1970s. Population, Space and Place. 2017;23(3):e2024. doi: 10.1002/psp.2024. [DOI] [Google Scholar]
- Chudnovskaya M, Kolk M. Educational expansion and intergenerational proximity in Sweden. Population, Space, and Place. 2017;23(1):e1973. doi: 10.1002/psp.1973. [DOI] [Google Scholar]
- Courgeau, D. (1973). Migrations et découpages du territoire. Population (french edition), 511–537.
- Esipova N, Pugliese A, Ray J. The demographics of global internal migration. Migration Policy Practice. 2013;3(2):3–5. [Google Scholar]
- Fischer PA, Malmberg G. Settled people don’t move: On life course and (im-) mobility in Sweden. International Journal of Population Geography. 2001;7(5):357–371. doi: 10.1002/ijpg.230. [DOI] [Google Scholar]
- Hogskoleverket. (2013). Higher education in Sweden, Status Report (Swedish Higher Education Authority).
- Kolk M. Period and cohort measures of internal migration. Population. 2019;74(3):333–350. doi: 10.3917/popu.1903.0355. [DOI] [Google Scholar]
- Kulu H, Lundholm E, Malmberg G. Is spatial mobility on the rise or in decline? An order-specific analysis of the migration of young adults in Sweden. Population Studies. 2018;72(3):1–15. doi: 10.1080/00324728.2018.1451554. [DOI] [PubMed] [Google Scholar]
- Lomax N, Stillwell J. Temporal change in internal migration in the United Kingdom. In: Champion T, Cooke TJ, Shuttleworth I, editors. Internal migration in the developed world: Are we becoming less mobile? London: Routledge; 2018. [Google Scholar]
- Long L. New estimates of migration expectancy in the United States. Journal of the American Statistical Association. 1973;68(341):37–43. doi: 10.1080/01621459.1973.10481330. [DOI] [Google Scholar]
- Lundholm E. Are movers still the same? Characteristics of interregional migrants in Sweden 1970–2001. Tijdschrift voor economische en sociale geografie. 2007;98(3):336–348. doi: 10.1111/j.1467-9663.2007.00401.x. [DOI] [Google Scholar]
- Openshaw S. The modifiable areal unit problem. In: Study Group in Quantitative Methods, editor. Concepts and techniques in modern geography. Norwich: Geobooks; 1984. [Google Scholar]
- Pelikh A, Kulu H. Short-and long-distance moves of young adults during the transition to adulthood in Britain. Population, Space and Place. 2018;24(5):e2125. doi: 10.1002/psp.2125. [DOI] [Google Scholar]
- Poulain M, Herm A. Central population registers as a source of demographic statistics in Europe. Population. 2013;68(2):183–212. doi: 10.3917/pope.1302.0183. [DOI] [Google Scholar]
- Rees, P., & Kupiszewski, M. (1999). Internal migration and regional population dynamics in Europe: A synthesis (Populatio Studies, 32: Council of Europe Publishing), Strasbourg.
- Sánchez, A. C., & Andrews, D. (2011). To move or not to move: What drives residential mobility Rates in the OECD? OECD Economics Department Working paper 846, Paris.
- Shuttleworth I, Osth J, Niedomysl T. Internal migration in a high-migration Nordic country. In: Champion T, Cooke T, Shuttleworth I, editors. Internal migration in the developed world: Are we becoming less mobilie? London: Routledge; 2018. [Google Scholar]
- Smith JP, Thomas D. Remembrances of things past: Test–retest reliability of retrospective migration histories. Journal of the Royal Statistical Society: Series A (Statistics in Society) 2003;166(1):23–49. doi: 10.1111/1467-985X.00257. [DOI] [Google Scholar]
- Wyness, G. (2010). Policy changes in UK higher education funding, 1963–2009, Working Paper (pp. 10–15). London: Department of Quantitative Social Science, Institute of Education.
Associated Data
This section collects any data citations, data availability statements, or supplementary materials included in this article.


