

Abstract
The N-localizer and the Sturm-Pastyr localizer are two technologies that facilitate image-guided stereotactic surgery. Both localizers enable the geometric transformation of tomographic image data from the two-dimensional coordinate system of a medical image into the three-dimensional coordinate system of the stereotactic frame. Monte Carlo simulations reveal that the Sturm-Pastyr localizer is less accurate than the N-localizer in the presence of image noise.
Keywords: stereotactic surgery, stereotactic radiosurgery, computed tomography, magnetic resonance imaging, n-localizer, sturm-pastyr localizer, monte carlo, image-guided surgery, image-guided radiosurgery, deep brain stimulation
Introduction
The N-localizer was introduced in 1979 [1], and the Sturm-Pastyr localizer was introduced in 1983 [2]. Both localizers enable the geometric transformation of tomographic image data from the two-dimensional  coordinate system of a medical image into the three-dimensional
  coordinate system of the stereotactic frame. Geometric transformation requires calculations that differ substantially between the two localizers in ways that impact the accuracy of the calculations when the effects of image noise are considered.
Technical report
Geometric transformation requires the calculation of  coordinates in the three-dimensional coordinate system of the stereotactic frame. The following presentation discusses the calculation of only the
  -coordinate because the calculation of the
  coordinates is trivial due to features of the N-localizer and Sturm-Pastyr localizer. Specifically, the N-localizer includes two vertical rods that have fixed values of
  and
and  , and the Sturm-Pastyr localizer includes one vertical rod that has fixed values of
  and
and  .
.
Figure 1 depicts the N-localizer that comprises two vertical rods and one diagonal rod. For the N-localizer, calculation of the  -coordinate of the point of intersection of the cylindrical axis of rod
  with the tomographic section is performed via linear interpolation between the two ends of rod
  according to the following equation [3].
 |
In this equation,  and
and  are distances measured in the
  coordinate system of the medical image,
  is the
  -coordinate of the top of rod
  , and
, and  is the
  -coordinate of the bottom of rod
  . The numeric values for
  and
and  are established by the manufacturing specifications for the N-localizer. The fraction
  is dimensionless, and hence the units of
  are the units of
  and
and  that are specified by the manufacturer. For this reason, calculations for the N-localizer do not require the specification of the pixel size for the medical image [3,4].
Figure 1. The N-Localizer and its Intersection with a Tomographic Section.

 Side view of the N-localizer. A tomographic section intersects rods
  ,
,  , and
, and  .
.  Tomographic image. The intersection of the tomographic section with rods
  ,
,  , and
, and  creates fiducial circles
  and
and  and fiducial ellipse
  in the tomographic image. The distance
  between the centers of ellipse
  and circle
  and the distance
  between the centers of circles
  and
and  are used to calculate the
  -coordinate of the point of intersection of the cylindrical axis of rod
  with the tomographic section [3].
Figure 2 depicts the Sturm-Pastyr localizer that comprises two diagonal rods and one vertical rod. For the Sturm-Pastyr localizer, calculation of the  -coordinate of the point of intersection of the cylindrical axis of rod
  with the tomographic section is performed via the following non-linear equation that is derived in the Appendix [5].
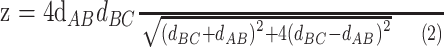 |
In this equation,  and
and  are distances measured in the
  coordinate system of the medical image. At the bottom of rod
  , i.e., at the apex of the V-shaped Sturm-Pastyr localizer,
  . When vertical rod
  is perpendicular to the tomographic section, i.e., when the tomographic section is parallel to the base of the stereotactic frame, Equation (2) reduces to
 |
This equation applies because the Sturm-Pastyr localizer is manufactured such that the angle between rods  and
and  , and the angle between rods
  and
and  , are both
  [6].
[6].
Figure 2. The Sturm-Pastyr Localizer and its Intersection with a Tomographic Section.

 Side view of the Sturm-Pastyr localizer. A tomographic section intersects rods
  ,
,  , and
, and  .
.  Tomographic image. The intersection of the tomographic section with rods
  ,
,  , and
, and  creates fiducial ellipses
  and
and  and fiducial circle
  in the tomographic image. The distance
  between the centers of ellipse
  and circle
  and the distance
  between the centers of circle
  and ellipse
  are used to calculate the
  -coordinate of the point of intersection of the cylindrical axis of rod
  with the tomographic section [6].
Equation (3) requires specification of the pixel size for the medical image to permit conversion of the distances  and
and  to millimeters. Equation (2) also requires specification of the pixel size because the units of
  calculated by Equation (2) are the units of
  and
and  , as demonstrated by dimensional analysis of Equation (2). This requirement, which does not apply to the N-localizer, renders the Sturm-Pastyr localizer susceptible to error. An erroneous value of
  will be calculated via Equations (2, 3) if the pixel size is specified incorrectly via user input, or computed incorrectly from fiducials in the medical image [6], or recorded incorrectly in medical image metadata that require frequent calibration of the imaging system to guarantee correct pixel size.
Figures 1, 2 demonstrate that the tomographic section of a medical image has a finite thickness. It is convenient to ignore this thickness and to approximate a tomographic section as an infinitely thin plane. This "central" plane lies midway between the top and bottom halves of the tomographic section, analogous to the way that a slice of cheese is sandwiched between two slices of bread. In the following presentation, the term "tomographic section" will be used as an abbreviation for the term "central plane of the tomographic section."
Similarly, it is convenient to ignore the diameter of rods  ,
,  , and
, and  in Figures 1, 2 and to approximate each rod as an infinitely thin cylindrical axis. In the following discussion, the term "rod" will be used as an abbreviation for the term "cylindrical axis of a rod." Hence, in the following presentation, the intersection of a "rod" with a "tomographic section" is equivalent to the intersection of a line with a plane and defines a point.
Monte Carlo algorithm
The accuracies of the N-localizer and Sturm-Pastyr localizer are compared via Monte Carlo simulation that is performed using the following algorithm.
1. A  -coordinate is chosen to express the height above the base of the stereotactic frame, i.e., above the base of the localizer.
2. An angle  is chosen to express the angle by which the tomographic section is tilted with respect to the localizer such that line
  is tilted relative to the base of the stereotactic frame (see Figures 3, 7).
Figure 3. Depiction of the N-Localizer.

The N-localizer is depicted by rods  ,
,  , and
, and  that intersect a non-tilted tomographic section at fiducial points
  ,
,  , and
, and  . The rods also intersect a tomographic section that is tilted by the angle
  at fiducial points
  ,
,  , and
, and  . The distance between points
  and
and  is
is  . The distance between points
  and
and  is
is  .
.
3. The  pair is used to calculate the
  ,
,  , and
, and  coordinates of the fiducial points
  ,
,  , and
, and  , respectively, in millimeters.
4. The  ,
,  , and
, and  coordinates are perturbed via random numbers [7,8] in the range
  mm via
  iterations to create
  sets of perturbed
  ,
,  , and
, and  coordinates, where the superscript
  designates the
  -th perturbed coordinate.
5. Each set of perturbed  ,
,  , and
, and  coordinates is used to calculate a set of perturbed distances
  ,
,  , and
, and  via the Pythagorean distance equation.
6. Each set of perturbed distances  ,
,  , and
, and  is used to calculate a perturbed
  -coordinate.
7. The  perturbed
  -coordinates are used to calculate the root mean square (RMS) error
  .
.
8. A new  pair is chosen and steps 3-7 are repeated.
Monte Carlo simulation for the N-localizer
Step 3 of the Monte Carlo algorithm requires calculation of the  ,
,  , and
, and  coordinates for a
  pair. To promote clarity, the calculation for a
  pair, for which
  , is discussed first.
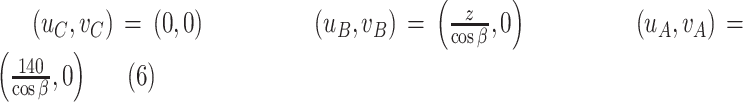
Figure 3 depicts an N-localizer wherein rods  ,
,  , and
, and  intersect both a non-tilted tomographic section, for which
  , and a tilted tomographic section, for which
  . For the non-tilted section, calculation of the
  ,
,  , and
, and  coordinates of the respective fiducial points
  ,
,  , and
, and  begins with calculation of the distances
  and
and  . The assumption that vertical rods
  and
and  are separated by
  mm yields
  mm. The assumption that vertical rods
  and
and  are
are  mm high yields
  mm. Making the simplification that
  then yields
  per Equation (1), where
  is specified in millimeters.
Given the distances  and
and  , it is possible to assign values to the
  ,
,  , and
, and  coordinates of the fiducial points
  ,
,  , and
, and  . Making the simplification that the fiducial points lie along the
  -axis, a simple assignment is
 |
For the tilted section, calculation of the  ,
,  , and
, and  coordinates begins with calculation of the distances
  and
and  . Figure 3 reveals that triangles
  and
and  are both right triangles, thus
 |
Hence, the  ,
,  , and
, and  coordinates of the fiducial points
  ,
,  , and
, and  are
are
 |
Steps 4-7 of the Monte Carlo algorithm then proceed as follows. The  ,
,  , and
, and  coordinates of the fiducial points
  ,
,  , and
, and  are perturbed
  times by random numbers to obtain
  perturbed
  ,
,  , and
, and  coordinates, from which
  perturbed distances
  and
and  are calculated, from which
  perturbed
  -coordinates are calculated via Equation (1) and used to calculate the RMS error
 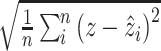 . Then a new
  pair is chosen and steps 3-7 of the Monte Carlo algorithm are repeated.
Monte Carlo simulation for the Sturm-Pastyr localizer
For step 3 of the Monte Carlo algorithm applied to the Sturm-Pastyr localizer, calculation of the  ,
,  , and
, and  coordinates for a
  pair begins with calculation of the distances
  and
and  . For this calculation, Equations (A1, A2) of the Appendix are solved for
  and
and  to obtain
 |
In these equations, 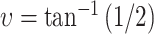 for the Sturm-Pastyr localizer [6]. Hence,
  and
and  are functions of only
  and
and  .
.
Given the distances  and
and  , it is possible to assign values to the
  ,
,  , and
, and  coordinates of the fiducial points
  ,
,  , and
, and  . Making the simplification that the fiducial points lie along the
  -axis, a simple assignment is
 |
Steps 4-7 of the Monte Carlo algorithm then proceed as follows. The  ,
,  , and
, and  coordinates of the fiducial points
  ,
,  , and
, and  are perturbed
  times by random numbers to obtain
  perturbed
  ,
,  , and
, and  coordinates, from which
  perturbed distances
  and
and  are calculated, from which
  perturbed
  -coordinates are calculated via Equation (2) and used to calculate the RMS error
  . Then a new
  pair is chosen and steps 3-7 of the Monte Carlo algorithm are repeated.
Discussion
Figure 4 shows the results of Monte Carlo simulation for the N-localizer and the Sturm-Pastyr localizer. The RMS error in  for the Sturm-Pastyr localizer approaches the smaller RMS error for the N-localizer at only large values of
  and tilt angle
  . For all other values of
  and
and  , the Sturm-Pastyr localizer incurs significantly more RMS error than the N-localizer.
Figure 4. RMS Error in  Plotted vs.
  for the N-Localizer and Sturm-Pastyr Localizer.

The RMS error in  is plotted vs.
  for the N-localizer (solid curves) and the Sturm-Pastyr localizer (dashed curves). Each curve is generated using the value of
  that is specified in degrees to the right of the curve.
RMS: root mean square
The RMS error for the Sturm-Pastyr localizer increases as  decreases and as
  increases. These trends may be understood by inspecting Equation (7), which shows that
  is directly proportional to
  and inversely proportional to
  ; this sine term is maximized when
  degrees. These trends may also be understood by inspecting Figure 7, which shows that
  is minimized for a given value of
  when line segment
  is perpendicular to line segment
  , i.e., when
  . Thus, an increase in
  in the range
  degrees or a decrease in
  decreases
  and consequently, the random perturbations in the range
  mm become more significant relative to
  and thereby increase the RMS error.
Equation (7) also shows that  is inversely proportional to
  and hence increases monotonically as
  increases in the range
  degrees, where
  . And Equation (2) shows that
  depends on
  and
and  in a non-linear manner. Figure 5 demonstrates the effect of this non-linearity on the RMS error in
  for the Sturm-Pastyr localizer and reveals that the maximum RMS error occurs near
  degrees.
Figure 5. RMS Error in  Plotted vs.
  for the Sturm-Pastyr Localizer.

The RMS error in  is plotted versus
  for the Sturm-Pastyr localizer. Each curve is generated using the value of
  that is specified in millimeters to the left of the curve. The curves for
  mm are similar to the curve for
  mm and are omitted.
RMS: root mean square
The RMS error for the N-localizer decreases as  increases. This trend may be understood by inspecting Equation (6), which shows that the unperturbed
  ,
,  , and
, and  coordinates are inversely proportional to
  . Hence, as
  increases in the range
  degrees, the unperturbed coordinates increase as well and in consequence, the random perturbations in the range
  mm become less significant relative to the magnitudes of the unperturbed coordinates and thereby decrease the RMS error.
Random perturbations in the range  mm are used for the Monte Carlo algorithm due to the following considerations. A typical field of view (FOV) for a medical image that is used for planning stereotactic surgery lies in the range
  mm and comprises 512x512 pixels. Hence, the pixel size for such an image is in the range
  mm. A conservative estimate that the center of each fiducial circle or ellipse is displaced at most two pixels by random noise yields the perturbation range
  mm.
mm.
The effect of various perturbation ranges on the errors incurred by the N-localizer and Sturm-Pastyr localizer is shown in Figure 6. This figure plots the RMS and maximum errors for both localizers at  mm and
  degrees vs. the maximum perturbation for the following continuous ranges of white noise:
  ,
,  ,
,  ,
,  , and
, and  mm. The RMS and maximum errors for the N-localizer scale linearly with the maximum perturbation: the slope and correlation coefficient of a linear least-squares fit to the RMS-error data are 0.76 and 0.999991, respectively; the slope and correlation coefficient of a linear least-squares fit to the maximum-error data are 2.21 and 0.9998, respectively. As can be appreciated from Figure 6, the RMS and maximum errors for the Sturm-Pastyr localizer scale slightly super-linearly, as demonstrated by the slight upward concavity of the Sturm-Pastyr curves. The combination
  mm and
  degrees pertains to a medical image that is obtained near the base of the stereotactic frame and almost parallel to the base of the frame. Such an image would be acquired for functional neurosurgery of the basal ganglia or for the insertion of deep brain stimulation implants.
Figure 6. RMS and Maximum Errors vs. Maximum Perturbation for the N-Localizer and Sturm-Pastyr Localizer at  mm and
  Degrees.

The RMS and maximum errors are plotted vs. the maximum perturbation for the N-localizer (solid and dot-dashed curves) and the Sturm-Pastyr localizer (dashed and long-dashed curves) at  mm and
  degrees.
RMS: root mean square
Conclusions
The Sturm-Pastyr localizer was originally intended for use with a medical image that is parallel to the base of the stereotactic frame, as depicted in Figure 2, wherein vertical rod  is perpendicular to the tomographic section. Obtaining such a parallel image is difficult because it requires precise alignment of the patient. The equations presented in the Appendix extend this localizer for use with a medical image that is not parallel to the base of the stereotactic frame. But these equations cannot surmount the V-shape of the Sturm-Pastyr localizer that hampers its accuracy for a non-parallel image. And, even for a parallel image, the accuracy of this localizer degrades substantially near the apex of the V, i.e., near the base of the stereotactic frame. This decreased accuracy may hinder the effectiveness of the Sturm-Pastyr localizer for targets deep in the brain, e.g., for functional neurosurgery of the basal ganglia or for insertion of deep brain stimulation implants.
In contrast to the Sturm-Pastyr localizer, the N-localizer is intended for use with a medical image that is not perforce parallel to the base of the stereotactic frame. Hence, there is no requirement to precisely align the patient to obtain a parallel image. In fact, the accuracy of the N-localizer increases for a non-parallel image. And for either parallel or non-parallel images, the N-localizer is more accurate than the Sturm-Pastyr localizer. An additional advantage of the N-localizer compared to the Sturm-Pastyr localizer is that the N-localizer does not require specification of the pixel size for a medical image.
Acknowledgments
The authors thank John A. Robinson for helpful comments.
Appendices
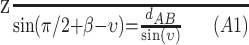
The Sturm-Pastyr localizer is designed to provide the  -coordinate when vertical rod
  of the localizer is perpendicular to the tomographic section, i.e., when the tomographic section is parallel to the base of the stereotactic frame. This idealized case is depicted in Figure 2 but not in Figure 7. In the idealized case,
  and
and  because angles
  and
and  shown in Figure 7 are both
 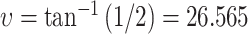 degrees [6]. However, achieving the idealized case is impractical due to the difficulty of precisely aligning the patient such that the tomographic section is perpendicular to vertical rod
  . Moreover, image noise perturbs the distances
  and
and  such that
  even if the patient is precisely aligned. For these reasons, Dai et al. have derived equations that permit calculation of
  from
from  and
and  when the tomographic section is not perpendicular to vertical rod
  [6].
[6].
Figure 7. Depiction of the Sturm-Pastyr Localizer.

The Sturm-Pastyr localizer is depicted by rods  ,
,  , and
, and  that intersect the tomographic section at fiducial points
  ,
,  , and
, and  . The tomographic section is tilted by
  degrees. The distance between points
  and
and  is
is  . The distance between points
  and
and  is
is  . The distance between points
  and
and  is
is  . Because angle
  is a constant for the Sturm-Pastyr localizer, i.e.,
  degrees [6], angles
  ,
,  ,
,  , and
, and  are functions of only angle
  , e.g., angle
  .
.
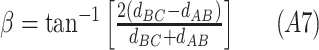
Understanding the derivation of Dai, et al. requires familiarity with only trigonometry and algebra. However, because Dai, et al. omitted several intermediate steps from their derivation, it is unnecessarily obscure. The intermediate steps are provided below and in addition, the result reported by Dai, et al. is extended to yield an expression that contains no trigonometric functions.
The derivation of Dai, et al. produces an equation for the angle  in terms of the distances
  and
and  as follows.
Application of the law of sines to triangle  of Figure 7 yields
 |
In this equation,  and
and 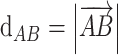 .
.
Similarly, application of the law of sines to triangle  yields
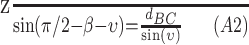 |
In this equation,  and
and  .
.
Dividing Equation (A1) by Equation (A2) eliminates  and
and  to yield
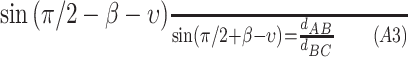 |
Applying the rule for the sine of the sum of two angles followed by the rule for the cosine of the sum of two angles produces
 |
Cross multiplication by the denominators and then factoring in  and
and  yields
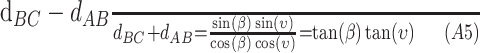 |
Substituting  into Equation (A5) yields
 |
Solving Equation (A6) for  completes the derivation of Dai, et al [6].
 |
Solving Equation (A1) for  yields
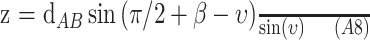 |
Computing  via Equation (A7) and substituting
  into Equation (A8) calculates
  in terms of
  and
and  when the tomographic section is not perpendicular to vertical rod
  .
.
An expression for  in terms
  and
and  that does not involve trigonometric functions is obtained by first constructing expressions for
  and
and  via inspection of Equation (A6)
 |
Applying the rules for the sine and cosine of the sum of two angles to Equation (A8) yields
 |
Substituting  into Equation (A10) yields
 |
Substituting Equation (A9) into Equation (A11) yields a non-linear expression for  in terms
  and
and  that does not involve trigonometric functions [5]
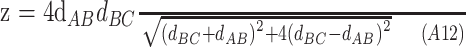 |
When  , Equation (A12) reduces to Equation (3).
The content published in Cureus is the result of clinical experience and/or research by independent individuals or organizations. Cureus is not responsible for the scientific accuracy or reliability of data or conclusions published herein. All content published within Cureus is intended only for educational, research and reference purposes. Additionally, articles published within Cureus should not be deemed a suitable substitute for the advice of a qualified health care professional. Do not disregard or avoid professional medical advice due to content published within Cureus.
The authors have declared that no competing interests exist.
Human Ethics
Consent was obtained by all participants in this study
Animal Ethics
Animal subjects: All authors have confirmed that this study did not involve animal subjects or tissue.
References
- 1.A computerized tomography-computer graphics approach to stereotaxic localization. Brown RA. J Neurosurg. 1979;50:715–720. doi: 10.3171/jns.1979.50.6.0715. [DOI] [PubMed] [Google Scholar]
- 2.Stereotactic computer tomography with a modified Riechert-Mundinger device as the basis for integrated stereotactic neuroradiological investigations. Sturm V, Pastyr O, Schlegel W, et al. Acta Neurochir (Wien) 1983;68:11–17. doi: 10.1007/BF01406197. [DOI] [PubMed] [Google Scholar]
- 3.A stereotactic head frame for use with CT body scanners. Brown RA. Invest Radiol. 1979;14:300–304. doi: 10.1097/00004424-197907000-00006. [DOI] [PubMed] [Google Scholar]
- 4.A CT-based computerized treatment planning system for I-125 stereotactic brain implants. Weaver K, Smith V, Lewis JD, et al. Int J Radiat Oncol Biol Phys. 1990;18:445–454. doi: 10.1016/0360-3016(90)90114-y. [DOI] [PubMed] [Google Scholar]
- 5.Alaminos-Bouza AL. Functional Neurosurgery. Vol. 1. São Paulo, Brazil: Alaúde Editorial Ltda.; 2014. Imaging, stereotactic space and targeting in functional neurosurgery; pp. 67–79. [Google Scholar]
- 6.An algorithm for stereotactic localization by computed tomography or magnetic resonance imaging. Dai J, Zhu Y, Qu H, Hu Y. Phys Med Biol. 2001;46:0. doi: 10.1088/0031-9155/46/1/401. [DOI] [PubMed] [Google Scholar]
- 7.RANLUX: A Fortran implementation of the high-quality pseudorandom number generator of Lüscher. James F. Comput Phys Commun. 1994;79:111–114. [Google Scholar]
- 8.A portable high-quality random number generator for lattice field theory simulations. Lüscher M. Comput Phys Commun. 1994;79:100–110. [Google Scholar]