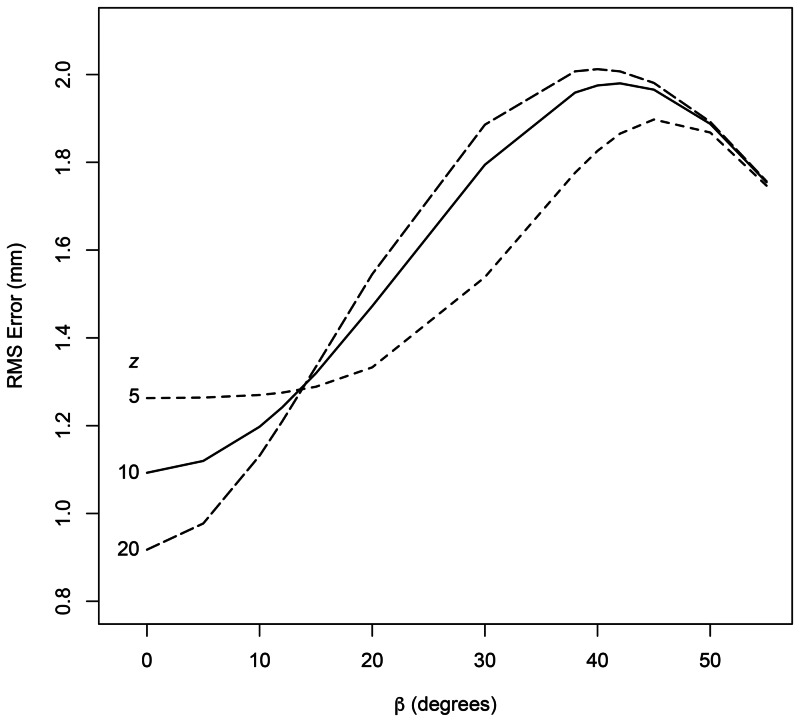
Figure 5. RMS Error in  Plotted vs.
  for the Sturm-Pastyr Localizer.
The RMS error in  is plotted versus
  for the Sturm-Pastyr localizer. Each curve is generated using the value of
  that is specified in millimeters to the left of the curve. The curves for
  mm are similar to the curve for
  mm and are omitted.
RMS: root mean square

