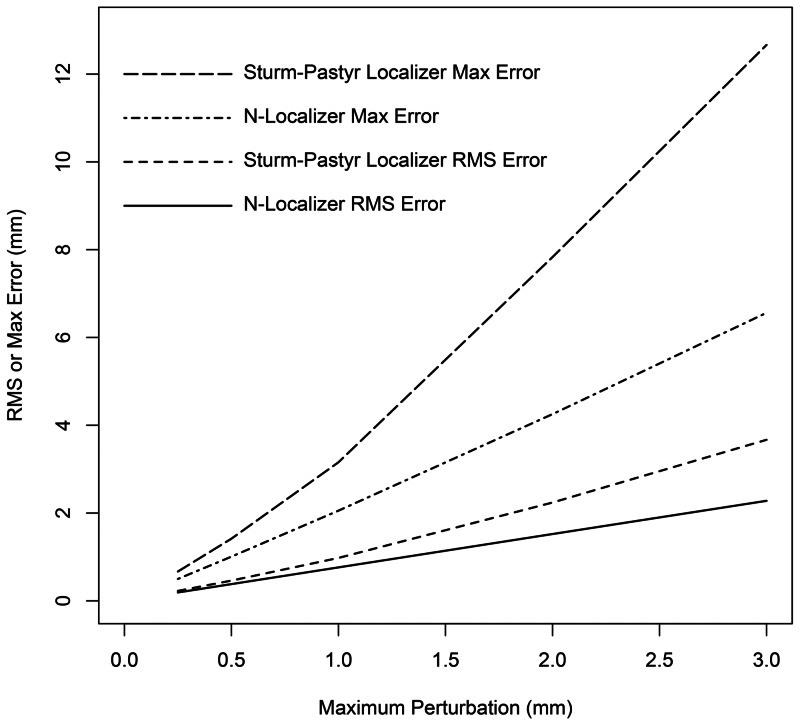
Figure 6. RMS and Maximum Errors vs. Maximum Perturbation for the N-Localizer and Sturm-Pastyr Localizer at  mm and
  Degrees.
The RMS and maximum errors are plotted vs. the maximum perturbation for the N-localizer (solid and dot-dashed curves) and the Sturm-Pastyr localizer (dashed and long-dashed curves) at  mm and
  degrees.
RMS: root mean square

