Abstract
As the most common neoplasm in digestive system, hepatocellular carcinoma (HCC) is one of the most important leading cause of cancer deaths worldwide. Its high-frequency metastasis and relapse rate lead to the poor survival of HCC patients. However, the mechanism of HCC metastasis is still unclear. Alternative splicing events (ASEs) have a great effect in cancer development, progression and metastasis. We downloaded RNA sequencing and seven types of ASEs data of HCC samples, in order to explore the mechanism of ASEs underlying tumorigenesis and metastasis of HCC. The data were taken from the The Cancer Genome Atlas (TCGA) and TCGASpliceSeq databases. Univariate Cox regression analysis was used to determine a total of 3197 overall survival-related ASEs (OS-SEs). And based on five OS-SEs screened by Lasso regression, we constructed a prediction model with the Area Under Curve of 0.765. With a good reliability of the model, the risk score was also proved to be an independent predictor. Among identified 390 candidate SFs, Y-box protein 3 (YBX3) was significantly correlated with OS and metastasis. Among 177 ASEs, ATP-binding cassette subfamily A member 6 (ABCA6)-43162-AT and PLIN5-46808-AT were identified both associated with OS, bone metastasis and co-expressed with SFs. Then we identified primary bile acid biosynthesis as survival-related (KEGG) pathway by Gene Set Variation Analysis (GSVA) and univariate regression analysis, which was correlated with ABCA6-43162-AT and PLIN5-46808-AT. Finally, we proposed that ABCA6-43162-AT and PLIN5-46808-AT may contribute to HCC poor prognosis and metastasis under the regulation of aberrant YBX3 through the pathway of primary bile acid biosynthesis.
Keywords: alternative splicing, hepatocellular carcinoma, metastasis, prognosis
Introduction
Hepatocellular carcinoma (HCC) is the most common primary liver tumor and one of the most important lethal malignancies worldwide [1]. In China, the incidence of HCC has been increasing continually and the 5-year survival rate has been less than 15% in the past decade [2–4]. Currently, optional treatments for liver cancer are very limited and the prognosis is generally unsatisfactory [5,6]. The highly metastatic capability and recurrence rate of HCC result in the low survival rate of HCC patients. Therefore, HCC has become a severe public health problem worldwide [7]. Although many advances have been achieved in the diagnosis and treatment of HCC, the overall prognosis for HCC patients remains poor. Tumor metastasis contributes greatly to the poor prognosis of HCC patients. Current therapeutic strategies for HCC have been demonstrated to promote HCC metastasis instead of repressing it [8]. Therefore, investigations of the molecular mechanisms underlying HCC metastasis are urgently needed to develop potential therapeutic strategies to target HCC metastasis [9].
Alternative splicing (AS) is an important post-transcriptional regulatory mechanism that increases protein diversity [10]. AS of pre-mRNA transcribed from a single gene can generate isoforms with distinct structures and functions [11]. Approximately 95% of the genes in the human genome undergo AS [12]. Aberrant AS can play a role in cancer development and resistance to therapy [13–15]. AS events (ASEs) could therefore function as diagnostic or prognostic biomarkers in various cancers. Additionally, cancer-specific splice isoforms or splicing factors could be therapeutic targets. In the past few years, emerging data have suggested that the cancer progression and metastasis are specifically associated with a plethora of mRNA isoforms [16].
Although multiple studies have revealed the critical role of many genes in the development and progression of HCC, most previous studies focused on alteration in transcriptome level. Analysis of post-transcriptional process is largely ignored, especially the potential roles of ASEs in the pathogenesis of HCC.
In our study, a comprehensive analysis was performed to characterize AS profiling and we constructed a prognostic model based on metastasis-related and overall survival-related ASEs (OS-SEs) for HCC. Additionally, Pearson correlation analysis was used to identify metastasis-associated ASEs as well as the corresponding SFs and pathways to elucidate the latent metastasis mechanism in HCC. Our results proved that the hypothetical constructed model has an important significance in prognostic prediction of HCC, which might assist oncologists in clinical management. Furthermore, a new sneak molecular mechanism and three potential therapeutic targets for HCC metastasis (YBX3 (Y-box protein 3), ABCA6, PLIN5) were both identified among the present study. In the present study, the active search about AS profiling has identified three potential therapeutic targets for HCC metastasis (YBX3, ABCA6, PLIN5). Meanwhile, the underlying molecular mechanism was also investigated.
Methods
Data extraction
RNA-seq data and SFs of 390 HCC cases were downloaded from the The Cancer Genome Atlas (TCGA) Data Portal (https://tcgadata.nci.nih.gov/tcga/). Meanwhile, we retrieved seven types of ASE data (spare receptor sites, AA; exon skip, ES; alternative terminator, AT; mutually exclusive exons, ME; reserved introns, RI; Alternative donor site, AD; alternative promoter, AP) from the TCGASpliceSeq database (https://bioinformatics.mdanderson.org/TCGASpliceSeq/). Samples with more than 25 percent of missing percent splicing (PSI) values were excluded.
Identification of OS-SEs
For ASEs, samples without follow-up records and samples with mean and standard deviation of PSI less than 0.05 and 0.01 were excluded, and K-nearest neighbor algorithm was used to correct for ASEs lacking expression data. Afterward, the univariate Cox regression analysis of integrated ASE and clinical data wereused to assess the prognostic value of each screened ASE. To demonstrate the prognosis-related and -unrelated ASEs holistically, the volcano plot was developed. Meanwhile, UpSet plot showed the OS-SEs. To display the top 20 OS-SEs of AA, AD, AP, AT, ES, ME and RI, seven bubble plots were generated, where the color and size of bubbles represent the overall survival value of ASEs.
Construction of the prognostic model based on the OS-SEs
First, to enhance the adaptability of the prognostic model constructed below, Lasso regression was performed to filter the top 20 significant prognostic OS-SEs. The significance of each OS-SEs screened by Lasso regression can be evaluated by using a multivariate Cox regression model with β-value, which indicated the regression coefficient of every integrated OS-SE in the model. Risk score was thus acquired by the following formula:
The samples were scored by two risk groups based on the median risk score and were reordered according to the risk score, which enabled the risk curve, scatterplot and expression heatmap be generated. Then we assessed the accuracy of the model by using the area under the receiver operator characteristic (ROC) curve. In addition, the identification of differences between high-risk and low-risk groups can also be resolved by Kaplan–Meier survival analysis.
To assess whether the risk score, as well as age, gender, grade, stage and TNM stage was independent prognostic factor, univariate and multivariate Cox regression analyses can be applied by modifying the baseline information.
Construction of the interaction and correlation network
In the SpliceAid2 database, 377 splicing factors were retrieved [17]. Pearson correlation analysis was utilized to inquiry the interaction and correlation between SFs and OS-SEs. The regulation network of SFs and OS-SEs was constructed by Cytoscape (3.7.1) with the exclusion criteria of the regulation pairs with P>0.001 and the absolute value of correlation coefficient < 0.75 [18]. In the network, we define the positive and negative regulations as red and green lines, respectively, the low and high risk of OS-SEs as purple and red, and OS-SEs and SF as ovals and arrows.
Identification of metastasis- and/or stage-related OS-SEs
To identify the OS-SEs significantly associated with TNM stage, metastasis or both of them, Kruskal–Wallis test and Mann–Whitney–Wilcoxon test were performed, and results were displayed by beeswarm plots. Moreover, the regulation network also contains these metastasis-/stage-related OS-SEs.
Co-expression analysis between ASEs and signaling pathways
To screen for prognosis-associated signal pathways identified by Gene Set Variation Analysis (GSVA), univariate Cox analysis was performed [19]. Then, to determine the possible downstream mechanisms of OS-SEs, we included key OS-SEs (distant metastasis/bone metastasis/stage-related) and the Kyoto Gene and Genomic Encyclopedia (KEGG) pathway (prognosis-related) into co-expression analysis.
Online database validation
To minimize bias, multiple databases were used to detect gene and protein expression levels of key biomarkers at the tissue levels, including the UALCAN [20], Kaplan–Meier plotter [21], LinkedOmics [22], SurvExpress [23], Firebrowse [24], GEPIA, CCLE, Oncomine, String.
Statistical analysis
All statistical analyses were applied by R version 3.5.1 (Institute for Statistics and Mathematics, Vienna, Austria; www.r-project.org) (Package: impute, UpSetR, ggplot2, rms, glmnet, preprocessCore, forestplot, survminer, survivalROC, beeswarm). Two-tailed P<0.05 was regarded statistically significant.
Results
Analysis of ASEs data and identification of OS-SEs in HCC
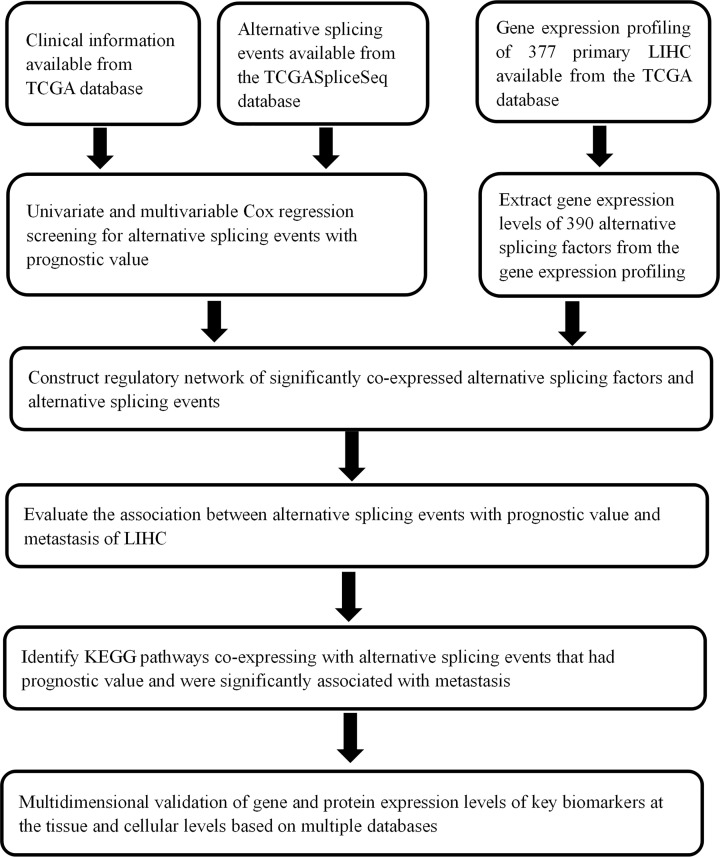
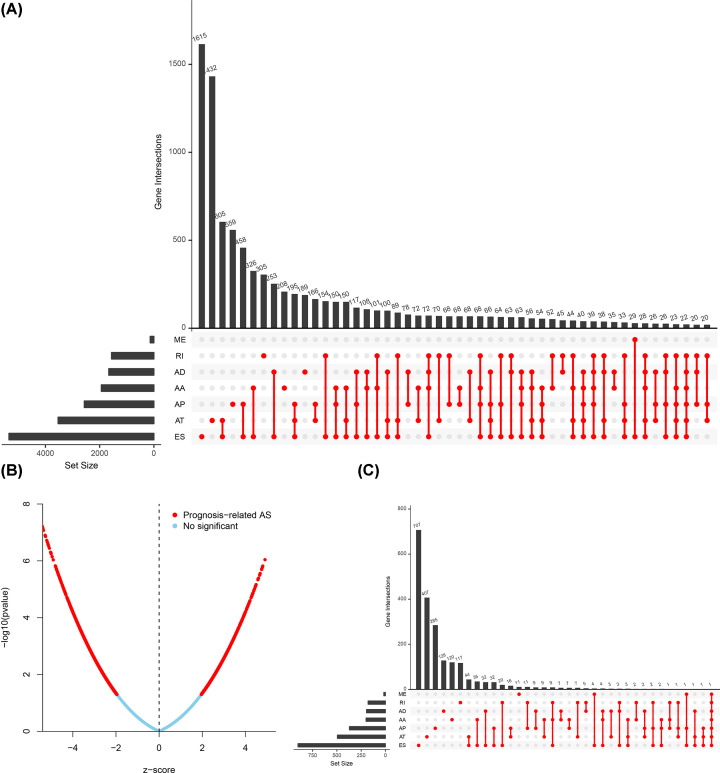
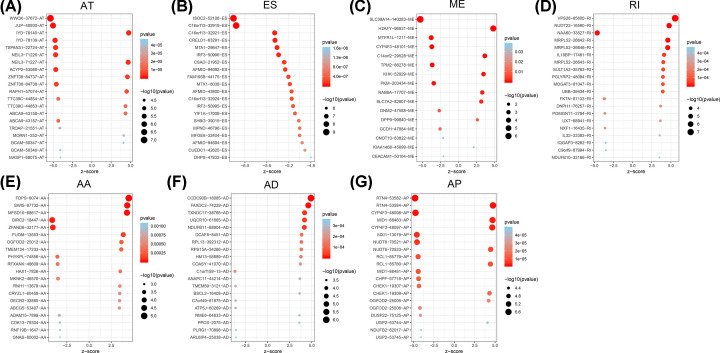
The flow chart of the present study is illustrated in Figure 1. ASEs data of 377 HCC samples were collected from TCGASpliceSeq (https://bioinformatics.mdanderson.org/TCGASpliceSeq/) and we identified a total of 34163 ASEs in 8985 genes among the HCC cases: 12327 ES events in 5343 genes, 8087 AT events in 3532 genes, 6352 AP events in 2566 genes, 2666 AA events in 1937 genes, 2331 AD events in 1663 genes, 2263 RI events in 1561 genes and 137 ME events in 135 genes. Therefore, multiple AS types could occur in the same genes (Figure 2A). We used univariate Cox regression analysis for determining OS-ASEs by FDR < 0.05 and 3197 events were found (Figure 2B). Additionally, based on 3197 events, UpSet plots were constructed to visualize the relationship of seven types ASEs and genes (Figure 2C) and bubble plots were generated to show the top 20 OS-SEs in seven types, respectively (Figure 3A–G).
Figure 1. Flowchart of the study.
Figure 2. The Upset plots and volcano plot of HCC ASEs.
A total of 34163 ASEs in seven AS patterns (A). The volcano plot exhibited the result of univariate Cox regression analysis (B). A total of 3197 OS-SEs identified by univariate Cox regression analysis in seven AS patterns (C).
Figure 3. The bubble plots of HCC ASEs.
The bubble plots displayed the top 20 OS-SEs of each type (A–G).
Prognostic predictors of OS in HCC
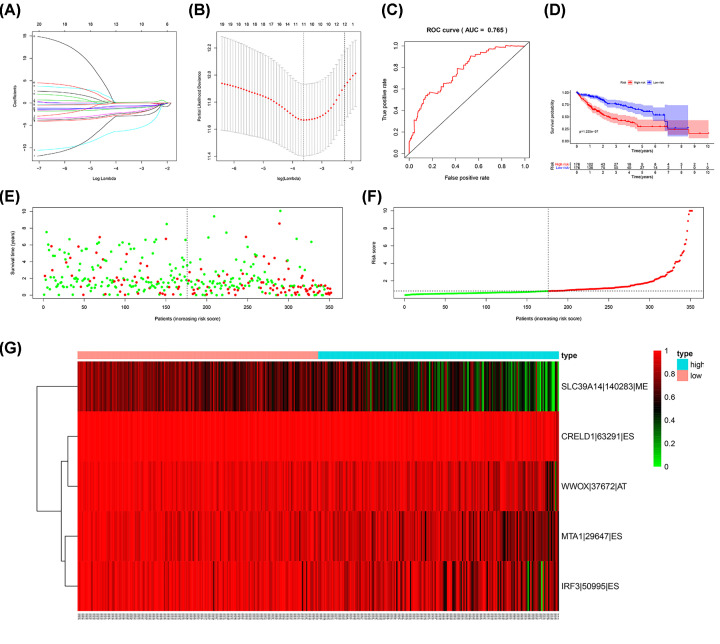
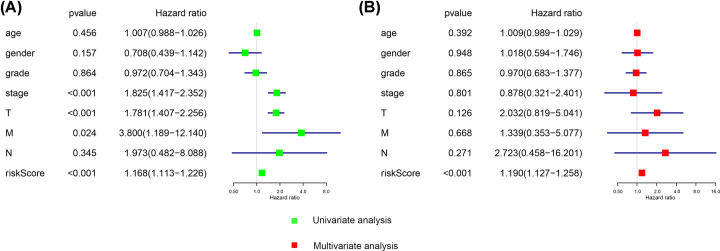
After filtration of the Lasso regression for the 20 most significant OS-SEs, ISOC2/52106/ES, CRELD1/63291/ES, MTA1/29647/ES, WWOX/37672/AT, SLC39A14/140283/ME, MTX1/8038/ES, AFMID/43800/ES, IRF3/50995/ES were integrated to construct a prediction model (Figure 4A,B). Next, we generated ROC curves to evaluate the accuracy of the prediction model and the area under the curves is 0.765 (CI = 95%) (Figure 4C). Based on the two subgroups divided by risk score, Kaplan–Meier survival analysis displayed that there is a poor prognosis for high-risk group which indicated that the prediction model had a good value (P= .225E-7) (Figure 4D). The risk curve showed the result of ranking patients by value of risk score (Figure 4E). The green and red dots of the scatter plot represent survival and death, respectively, and the result disclosed there was a higher mortality in a high-risk group (Figure 4F). Besides, we generated heat map to display the expression level for five OS-SEs (SLC39A14-14028-ME, CRELD1-63291-ES, WWO-37672-AT, MTA1-29647-ES and IRF3) filed by Lasso regression, and all of them were higher in the high-risk group (Figure 4G). Furthermore, we used univariate as well as multivariate Cox regression analyses to estimate the independent prognostic value of age, gender, grade, stage and risk score. Both results suggested riskScore could be considered as an independent prognostic factor (univariate model: HR = 1.168, 95% CI (1.113–1.226), P<0.001; multivariate model: HR = 1.190, 95% CI (1.127–1.258), P<0.001) (Figure 5).
Figure 4. Construction and assessment of the prognosis model.
The Lasso regression for the 20 most significant OS-ASEs. (A,B) We constructed a predict model based on eight OS-SEs screened by Lasso regression, the ROC curves to evaluate the accuracy of the model and the area under the curves is 0.765. (C) K–M survival analysis for demonstrating risk score able to predict prognosis in patients with HCC (D). The risk curve for ranking patients by value of risk score (E). The green and red dots of the scatter plot representing survival and death, respectively (F). The heat map for PSI of five OS-ASEs screened by Lasso regression (G).
Figure 5. Estimation of independent prognostic value.
Univariate (A) and multivariate (B) Cox regression analyses suggested risk score can be used as independent prognostic factor for HCC.
Construction of the regulatory network between ASEs and SFs and identification of metastasis-related ASEs
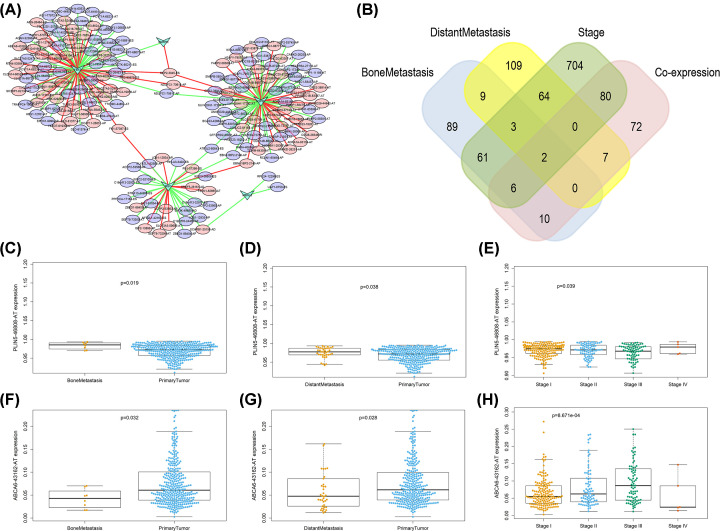
Since AS is the outcome of SFs, in order to find SFs-associated ASEs, Pearson correlation analysis between OS-SEs and 390 SFs was performed. The Cytoscape was then implemented to generate regulation network. The results indicated that five SFs (HSPB1, MBNLS, MSI, SNRPN, YBX3) were correlated with 177 ASEs. Among 187 pairs of correlation cases, 104 pairs were negatively regulated (green lines) and 83 pairs were positively regulated (red lines). Of the 177 ASEs, 79 were high-risk events (red ovals) and 98 were low-risk events (green ovals) (Figure 6A). Among the 177 ASEs, 18 ASEs were significantly connected with bone metastasis, especially, ABCA6-43162-AT and PLIN5-46808-AT, which were both associated with OS (P=0.041, P=0.048), bone metastasis (P=0.032, P=0.019) and co-expressed with YBX3 (correlation coefficient = 0.410, P<0.001; correlation coefficient = −0.416, P<0.001) (Figure 6B–H).
Figure 6. Regulatory network between OS-SEs and co-expressed SFs.
The results indicated five SFs (HSPB1, MBNLS, MSI, SNRPN, YBX3) were correlated with 177 ASEs. Of the 187 pairs of corelation cases, 104 pairs were negatively regulated (green lines) and 83 pairs were positively regulated (red lines). Of the 177 ASEs, 79 were high-risk events (red ovals) and 98 were low-risk events (green ovals) (A). Venn plot for displaying OS-SEs associated metastasis and clinical status, among the 177 ASEs, 18 ASEs were significantly connected with bone metastasis, ABCA6-43162-AT and PLIN5-46808-AT were identified to be both associated with OS (P=0.041, P=0.048), bone metastasis (P=0.032, P=0.019) and co-expressed with SFs (cor = 0.410, P=1.05E-15; cor = −0.416, P=3.83E-16) (B). Beeswarm plots demonstrating OS-SEs, ABCA6-43162-AT and PLIN5-46808-AT, were significantly associated with metastasis and clinical status (C–H).
Integrated analysis of survival-related KEGG pathways and metastasis-related ASEs
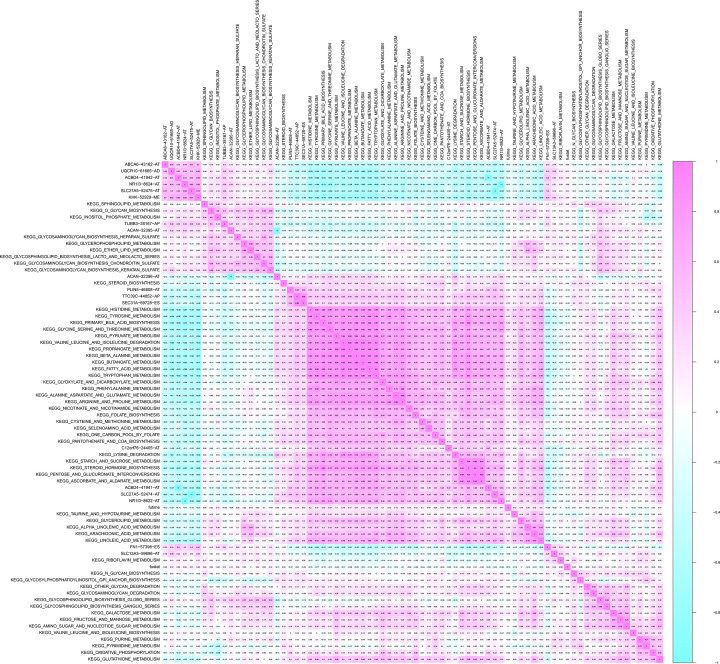
Through GSVA, we identified survival-related KEGG pathways with univariate regression analysis. With the co-expression analysis, some significant correlation patterns between survival-related KEGG pathways and ASEs intersecting of bone metastasis and regulatory network were shown in Figure 7, and ABCA6-43162-AT and PLIN5-46808-AT were both correlated with primary bile acid biosynthesis (R = −0.49; R = 0.36).
Figure 7. Co-expression heat map between KEGG pathway identified by GSVA and OS-SEs related with metastasis.
ABCA6-43162-AT and PLIN5-46808-AT were both correlated with primary bile acid biosynthesis (R = −0.49; R = 0.36).
External validation
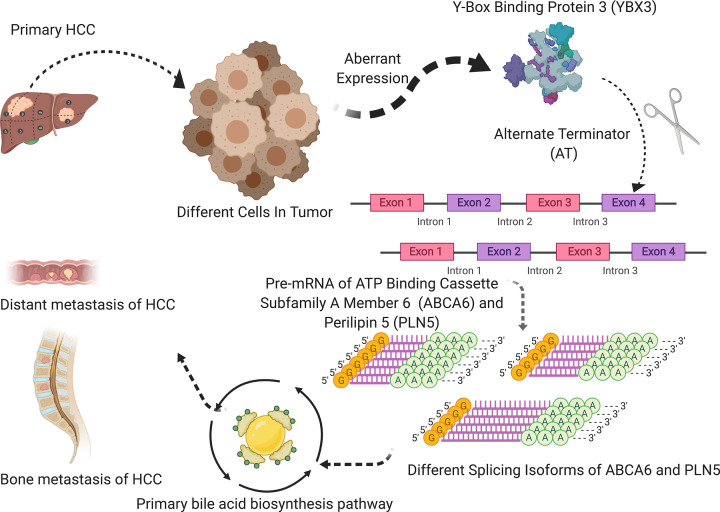
The top five genes for pathway of primary bile acid biosynthesis were CH25H, AMACR, AKR1D1, CYP27A1, CYP46A1 which were identified by Pathcard database (http://pathcards.genecards.org/). Then to enhance the validity of our results, we performed a multidimensional validation for verifying prognostic value of ABCA6, PLIN5, YBX3 and the five genes mentioned above. All the results are shown in Table 1. ABCA6, PLIN5, AMACR, AKR1D1 CYP27A1 and CYP46A1 are differently expressed genes among clinical stages in UALCAN (Supplementary Figure S1). In the Human Protein Atlas, the expression of YBX3, AKR1D1 and CYP27A1 are lower in HCC than normal liver but the AMACR are opposite (Supplementary Figure S2). Most of the genes are significantly associated with survival in Kaplan–Meier (Supplementary Figure S3). ABCA6, PLIN5, AKR1D1 and CYP27A1 were significantly related to survival and clinical stages in Linkedomics (Supplementary Figure S4). At the tissue level, YBX3, ABCA6, PLIN5, CH25H, AMACR, AKR1D1, CYP27A1 and CYP46A1 were all significantly related to survival in SurvExpress (Supplementary Figure S5). The differential expression of ABCA6, PLIN5, AKR1D1, CYP27A1 are related with survival and clinical stages in GEPIA (Supplementary Figure S6). At the cellular level, YBX3 and CH25H were highly expressed in liver cancer cell lines, and ABCA6, PLIN5, AMACR, AKR1D1, CYP27A1, CYP46A1 were highly expressed in liver cancer cell lines in CCLE (Supplementary Figure S7). PLIN5, AMACR and YBX3 expressed differently in multiple studies and multiple cancers in Oncomine (Supplementary Figure S8). Finally, Figure 8 summarizes the speculative mechanism diagram including YBX3, ABCA6-43162-AT, PLIN5-46808-AT and primary bile acid biosynthesis pathway.
Table 1. The external validation of YBX3, ABCA6, PLIN5, CH25H, AMACR, AKR1D1, CYP27A1, CYP46A1.
| Database | YBX3 (splicing factor gene) | ABCA6 (ASEs gene) | PLIN5 (ASEs gene) | CH25H (pathway gene) | AMACR (pathway gene) | AKR1D1 (pathway gene) | CYP27A1 (pathway gene) | CYP46A1 (pathway gene) |
|---|---|---|---|---|---|---|---|---|
| UALCAN | Expression: P<0.001 Stage: P=0.001 |
Expression: P=0.002 Stage: P<0.001 |
Expression: P<0.001 Stage: P<0.001 |
Expression: P=0.67 Stage: P=0.24 |
Expression: P<0.001 Stage: P<0.001 |
Expression: P<0.001 Stage: P<0.001 |
Expression: P<0.001 Stage: P<0.001 |
Expression: P=0.23 Stage: P=0.018 |
| The Human Protein Atlas | Tumor; media Normal; not detected |
None | None | None | Tumor; media Normal; high |
Tumor; media Normal; not detected |
Tumor; media Normal; not detected |
Tumor; media Normal; not detected |
| Kaplan–Meier plotter | ||||||||
| Best cutoff | P=0.17 | P<0.001 | P<0.001 | P=0.016 | P=0.100 | P<0.001 | P<0.001 | P=0.225 |
| Median value | P=0.51 | P=0.118 | P=0.073P= | P=0.316 | P=0.409 | P<0.001 | P<0.001 | P=0.688 |
| LinkedOmics | K–M analysis: P=0.463 Stage: P=0.607 |
K–M analysis: P=0.003 Stage: P=0.041 |
K–M analysis: P<0.001 Stage: P=0.002 |
K–M analysis: P=0.066 Stage: P=0.370 |
K–M analysis: P=0.082 Stage: P=0.924 |
K–M analysis: P=0.004 Stage: P=0.001 |
K–M analysis: P<0.001 Stage: P<0.001 |
K–M analysis: P=0.614 Stage: P=0.421 |
| SurvExpress | K–M analysis: P=0.039 | K–M analysis: P=0.036 | K–M analysis: P=0.007 | K–M analysis: P=0.025 | K–M analysis: P=0.038 | K–M analysis: P=0.019 | K–M analysis: P=0.015 | K–M analysis: P=0.011 |
| GEPIA | Tumor low Nomal low KM: P=0.45 Stage: P=0.171 |
Tumor media Nomal high KM: P=0.041 Stage: P=0.002 |
Tumor low Nomal high KM: P=0.006 Stage: P=0.038 |
Tumor low Nomal low KM: P=0.69 Stage: P=0.945 |
Tumor low Nomal low KM: P=0.36 Stage: P=0.72 |
Tumor low Nomal high KM: P=0.05 Stage: P=0.002 |
Tumor high Nomal high KM: P=0.009 Stage: P<0.001 |
Tumor low Nomal high KM: P=0.94 Stage: P=0.585 |
| CCLE | Tumor high | Tumor low | Tumor low | Tumor low | Tumor high | Tumor low | Tumor low | Tumor low |
| Oncomine | ||||||||
Abbreviations: ABCA6, ATP-binding cassette subfamily A member 6; AKR1D1, aldo-keto reductase family 1 member D1; AMACR, α-methylacyl-CoA racemase; CH25H, cholesterol 25-hydroxylase; CYP27A1, cytochrome P450 family 27 subfamily A member 1; CYP46A1, cytochrome P450 family 46 subfamily A member 1; PLIN5, Perilipin 5; YBX3, Y-box binding protein 3.
Figure 8. The speculative mechanism diagram of the article.
The speculative mechanism diagram included YBX3, ABCA6-43162-AT, PLIN5-46808-AT and primary bile acid biosynthesis pathway.
Discussion
HCC was the commonest primary liver tumor and related to unsatisfactory prognosis [1]. Previous studies identified some key genes in HCC development and progression, however, fewer focused on analysis of post-transcription process, especially HCC metastasis [7,8]. Under the regulation of AS, a single gene could generate isoforms with distinct structures and functions [11,12]. Furthermore, aberrant AS could contribute to the production of onco-protein, leading to tumorigenesis, progression and metastasis of HCC [10–13].
In the present study, we totally identified 3197 HCC OS-SEs by univariate Cox regression analysis and then we constructed a prognosis model based on the eight OS-SEs filtered by the Lasso regression. Besides, risk score was demonstrated to be used as an independent prognostic factor. More importantly, among the OS-SEs, we identified two bone metastasis-related ASEs (ABCA6-43162-AT and PLIN5-46808-AT) co-expressing with SF YBX3 and pathway of primary bile acid biosynthesis. Based on the results, we supposed YBX3 regulated ABCA6-43162-AT and PLIN5-46808-AT of the primary bile acid biosynthesis pathway resulting in HCC metastasis.
YBX3upregto the Y-box binding protein family. The Y-box binding proteins play diverse regulatory functions, including regulation of transpription and translation, and are considered to be contributing to cell proliferation and transformation [25]. These proteins contain a highly conserved nucleic acid-binding motif called the cold shock domain (CSD). In YB proteins, the CSD is flanked by the N-terminal alanine/proline-rich(A/P) domain and the extended C-terminal domain (CTD) containing positively and negatively charged clusters of amino acids [26]. In all three members of the family, CSDs show more than 90% identity, while CTDs are close in amino acid composition and distribution of charged clusters. CTDs of YB protein family members from different vertebrates show high homology (approximately 60% identity) [27]. The CSD enables Y-box proteins to interact with both DNA and RNA to control the transcription and translation of specific genes [28,29]. Y-Box binding proteins can fall into three subfamilies, YBX1, YBX2 and YBX3.
YB-1, as the prototype member of this family, its nuclear expression has been reported to be correlated with advanced stages of malignant diseases, such as breast cancer [30], non-small lung cancer [31], thyroid cancer [32] and colorectal cancer [33]. Notably, reports have linked YB-1 with cancer cell invasiveness, promoting metastasis of liver cancer [34]. The studies of this protein have largely contributed to the recognition of the wide functional abilities of YB proteins. Since the composition, structure and order of YB-1 and YB-3 were similar to each other, YBX3 might similarly play a role in transport pathways between nucleus and cytoplasm and replace YB-1 in the regulation of mRNA translation and stability. In our study, YBX3 was the only aberrant SF co-expressing with ABCA6-43162-AT and PLIN5-46808-AT which are high risk OS-ASEs for HCC. Epidemiologically, chronic infection with hepatitis B virus or hepatitis C virus is closely related with the development of HCC. According to one study, dbpA could accelerate the process of inflammation-induced hepatocarcinogenesis [35]. And it has been reported that the T-to-G transversion in the dbpA promoter region was suggested to be a predisposing factor for the progression of HCC [36]. A similar view was also reported in another paper: enhanced expression of dbpA gene might be one of the accelerating factors in the hypercarcinogenic state, by provoking the genetic instability which is a prerequisite event leading to hepatocarcinogenesis [37].
ATP-binding cassette (ABC) transporters have been acknowledged as important players in the processes of transmembrane transport which utilize ATP hydrolysis energy to transport various substrates including lipid, amino acids, peptides, ions and sugars [38–40]. As an intracellular member of the ABC A subfamily, ABCA6 mediated the translocation of various physiological lipid compounds. Besides, ABCA6 was the first gene of ABC A subfamily to be described in completion because of its unique genomic organization and high sequence homology. A study indicated that ABCA6 may play a part in lipid transport [41]. Additionally, Kaminski et al. found mutation of the ABC A proteins were related to a variety of diseases and Elisabeth et al. found ABCA6 variant associated with cholesterol levels [42,43], which is known to be the inhibitor of HCC invasion and metastasis [44].
Similarly associated with lipid, PLIN5 belongs to the family of perilipins consisting of five distinct members (PLIN1-5), which are major structural proteins located on the surface of lipid droplets known to serve as factors for lipid homeostasis by modulating lipid storage, with crucial roles in diseases characterized with lipid manifestations [45,46]. In our study, PLIN5-46808-AT was more common in primary sites of HCC with metastasis than primary HCC. One study indicate that Lipocalin 2 (LCN2) is a key modulator of hepatic lipid homeostasis that controls the formation of intracellular lipid droplets by regulating PLIN5 expression [47]. The formation of intracellular lipid droplets, which PLIN5 involved, may lead to progression of non‐alcoholic fatty liver disease (NAFLD), the second leading etiology of HCC and currently the most common cause of chronic liver disease [48,49]. Furthermore, LCN2 and PLIN5 has been found highly expressed specifically in tumoral areas of HCC livers in human patients as well as in experimental HCC mouse models [50]. Importantly, mounting evidence proved that abnormal lipid metabolism has a negative role in HCC and other cancer [51–53]. Thus, we conjecture that ABCA6 and PLIN5 promote HCC progression by some lipid biosynthesis process.
The co-expression between the ASEs of ABCA6-43162-AT, PLIN5-46808-AT and the pathway of bile acid biosynthesis in the present study has also proved both the ASEs were related to HCC metastasis by affecting lipid metabolism. Bile acids acted as an emulsifier and helped to absorb and transport lipids. They were regarded as key signal molecules involving in lipid metabolism. Our study found that the pathway of primary bile acid biosynthesis was co-expressed with HCC metastasis-related ASEs (ABCA6-43162-AT and PLIN5-46808-AT) and we inferred that the pathway was involved in metastasis of HCC. A multicenter international study showed that primary biliary cirrhosis significantly promoted HCC initiation and this effect might be related to the activation of inflammatory signaling [54,55].
Our data revealed that ABCA6, PLIN5 and the pathway were all associated with lipid in various aspects. The further result of String database also demonstrated that there are extensive connections among our hypothesis members. ABCC3, establishing broad links between ABCA6 and the pathway genes, may play a part on transportation of organic anions in biliary and intestinal excretion. Besides, it is associated with Extrahepatic Cholestasis [56]. PPARA, link relay station of PLIN5 and pathway gene, acts as a transcription factor regulates fatty acid metabolism genes, such as intracellular binding and fatty acid transport [57].
There are incontrovertibly some limitations in our study. First of all, the data we collected from public databases are limited so that clinical information is not comprehensive and may cause potential bias and errors. Second, the present study is a multidimensional correlation study rather than a specific biological mechanism. Last but not least, single bioinformatics analysis lacks high credibility. Therefore, cell and animal experiments and clinical trials still need to be done to verify the findings. Although there are limitations, for all we know, our study was the first to link ASEs effects on lipid-to-lipid effects on HCC metastasis. In the future, we will concentrate on the splicing isoforms of ABCA6-43162-AT and PLIN5-46808-AT to further explore mechanism of HCC metastasis.
In conclusion, risk score calculated by the predict model can be used as an independent prognostic factor for HCC. We proposed that ABCA6-43162-AT and PLIN5-46808-AT are regulated by YBX3 via the pathway of primary bile acid biosynthesis, and this regulatory relationship can lead to a poor prognosis and clinical outcome in the progression of HCC.
Supplementary Material
Acknowledgements
We thank the TCGA team for using their data.
Abbreviations
- ABC
ATP-binding cassette
- ABCA
ATP-binding cassette subfamily A member
- AD
alternative donor
- AP
alternative promoter
- AS
alternative splicing
- ASE
AS event
- AT
alternative terminator
- CI
confidence interval
- CSD
cold shock domain
- CTD
C-terminal domain
- dbpA
DNA binding protein A
- FDR
false discovery rate
- GSVA
Gene Set Variation Analysis
- HCC
hepatocellular carcinoma
- HR
hazard ratio
- KEGG
Kyoto Gene and Genomic Encyclopedia
- LCN2
Lipocalin 2
- ME
mutually exclusive exon
- OS-SE
overall survival-related ASE
- Pre-mRNA
precursor mRNA
- RI
reserved intron
- ROC
receiver operator characteristic
- TCGA
The Cancer Genome Atlas
- TNM
tumor, node, metastasis
- YBX3
Y-box protein 3
Contributor Information
Huabin Yin, Email: jiezhang@tongji.edu.cn.
Tong Meng, Email: mengtong@medmail.com.cn.
Zongqiang Huang, Email: gzhuangzq@163.com.
Data Availability
The datasets generated and/or analyzed during the current study are available in the Supplementary Material and TCGA-LGG program (https://portal.gdc.cancer.gov).
Competing Interests
The authors declare that there are no competing interests associated with the manuscript.
Funding
This work was supported by the National Natural Science Foundation of China [grant numbers 81702659, 81772856, 81501203]; the Youth Fund of Shanghai Municipal Health Planning Commission [grant number 2017YQ054]; and the Henan Medical Science and Technology Research Project [grant number 201602031].
Author Contribution
Conception/design: Runzhi Huang, Gaili Yan, Hanlin Sun, Jie Zhang, Dianwen Song, Rui Kong, Penghui Yan, Peng Hu, Aiqing Xie, Siqiao Wang, Juanwei Zhuang, Huabin Yin, Tong Meng, Zongqiang Huang. Collection and/or assembly of data: Runzhi Huang, Gaili Yan, Hanlin Sun, Jie Zhang, Dianwen Song, Rui Kong, Penghui Yan, Peng Hu, Aiqing Xie, Siqiao Wang, Juanwei Zhuang. Data analysis and interpretation: Runzhi Huang, Gaili Yan, Hanlin Sun, Jie Zhang, Dianwen Song, Rui Kong, Penghui Yan, Peng Hu, Aiqing Xie, Siqiao Wang, Juanwei Zhuang, Huabin Yin, Tong Meng, Zongqiang Huang. Manuscript writing: Runzhi Huang, Gaili Yan, Hanlin Sun, Jie Zhang, Dianwen Song, Rui Kong, Penghui Yan, Peng Hu, Aiqing Xie, Siqiao Wang, Juanwei Zhuang. Final approval of manuscript: Runzhi Huang, Gaili Yan, Hanlin Sun, Jie Zhang, Dianwen Song, Rui Kong, Penghui Yan, Peng Hu, Aiqing Xie, Siqiao Wang, Juanwei Zhuang, Huabin Yin, Tong Meng, Zongqiang Huang.
Ethics Approval
The study was approved by the Ethics Committee of First Affiliated Hospital of Zhengzhou University (No. KEYAN-2020-LW-069).
References
- 1.Parkin D.M. et al. (2001) Estimating the world cancer burden: Globocan 2000. Int. J. Cancer 94, 153–156 10.1002/ijc.1440 [DOI] [PubMed] [Google Scholar]
- 2.El-Serag H.B. and Mason A.C. (1999) Rising incidence of hepatocellular carcinoma in the United States. N. Engl. J. Med. 340, 745–750 10.1056/NEJM199903113401001 [DOI] [PubMed] [Google Scholar]
- 3.El-Serag H.B. (2004) Hepatocellular carcinoma: recent trends in the United States. Gastroenterology 127, S27–S34 10.1053/j.gastro.2004.09.013 [DOI] [PubMed] [Google Scholar]
- 4.Mittal S. and El-Serag H.B. (2013) Epidemiology of hepatocellular carcinoma: consider the population. J. Clin. Gastroenterol. 47, S2–S6 10.1097/MCG.0b013e3182872f29 [DOI] [PMC free article] [PubMed] [Google Scholar]
- 5.Llovet J.M. and Bruix J. (2008) Novel advancements in the management of hepatocellular carcinoma in 2008. J. Hepatol. 48, S20–S37 10.1016/j.jhep.2008.01.022 [DOI] [PubMed] [Google Scholar]
- 6.Spangenberg H.C., Thimme R. and Blum H.E. (2009) Targeted therapy for hepatocellular carcinoma. Nat. Rev. Gastroenterol. Hepatol. 6, 423–432 10.1038/nrgastro.2009.86 [DOI] [PubMed] [Google Scholar]
- 7.Wang M., Yu F. and Li P. (2018) Circular RNAs: characteristics, function and clinical significance in hepatocellular carcinoma. Cancers (Basel) 10, 258 10.3390/cancers10080258 [DOI] [PMC free article] [PubMed] [Google Scholar]
- 8.Zhang W. et al. (2012) Sorafenib down-regulates expression of HTATIP2 to promote invasiveness and metastasis of orthotopic hepatocellular carcinoma tumors in mice. Gastroenterology 143, 1641.e5–1649.e5 10.1053/j.gastro.2012.08.032 [DOI] [PubMed] [Google Scholar]
- 9.Yuan K. et al. (2020) TXNDC12 promotes EMT and metastasis of hepatocellular carcinoma cells via activation of β-catenin. Cell Death Differ. 27, 1355–1368 10.1038/s41418-019-0421-7 [DOI] [PMC free article] [PubMed] [Google Scholar]
- 10.Ge Y. and Porse B.T. (2014) The functional consequences of intron retention: alternative splicing coupled to NMD as a regulator of gene expression. Bioessays 36, 236–243 10.1002/bies.201300156 [DOI] [PubMed] [Google Scholar]
- 11.Climente-González H. et al. (2017) The functional impact of alternative splicing in cancer. Cell Rep. 20, 2215–2226 10.1016/j.celrep.2017.08.012 [DOI] [PubMed] [Google Scholar]
- 12.Nilsen T.W. and Graveley B.R. (2010) Expansion of the eukaryotic proteome by alternative splicing. Nature 463, 457–463 10.1038/nature08909 [DOI] [PMC free article] [PubMed] [Google Scholar]
- 13.Lee S.C. and Abdel-Wahab O. (2016) Therapeutic targeting of splicing in cancer. Nat. Med. 22, 976–986 10.1038/nm.4165 [DOI] [PMC free article] [PubMed] [Google Scholar]
- 14.Singh B. and Eyras E. (2017) The role of alternative splicing in cancer. Transcription 8, 91–98 10.1080/21541264.2016.1268245 [DOI] [PMC free article] [PubMed] [Google Scholar]
- 15.Munkley J. et al. (2017) RNA splicing and splicing regulator changes in prostate cancer pathology. Hum. Genet. 136, 1143–1154 10.1007/s00439-017-1792-9 [DOI] [PMC free article] [PubMed] [Google Scholar]
- 16.David C.J. and Manley J.L. (2010) Alternative pre-mRNA splicing regulation in cancer: pathways and programs unhinged. Genes Dev. 24, 2343–2364 10.1101/gad.1973010 [DOI] [PMC free article] [PubMed] [Google Scholar]
- 17.Piva F. et al. (2009) SpliceAid: a database of experimental RNA target motifs bound by splicing proteins in humans. Bioinformatics 25, 1211–1213 10.1093/bioinformatics/btp124 [DOI] [PubMed] [Google Scholar]
- 18.Shannon P. et al. (2003) Cytoscape: a software environment for integrated models of biomolecular interaction networks. Genome Res. 13, 2498–2504 10.1101/gr.1239303 [DOI] [PMC free article] [PubMed] [Google Scholar]
- 19.Hänzelmann S., Castelo R. and Guinney J. (2013) GSVA: gene set variation analysis for microarray and RNA-seq data. BMC Bioinformatics 14, 7 10.1186/1471-2105-14-7 [DOI] [PMC free article] [PubMed] [Google Scholar]
- 20.Chandrashekar D.S. et al. (2017) UALCAN: a portal for facilitating tumor subgroup gene expression and survival analyses. Neoplasia 19, 649–658 10.1016/j.neo.2017.05.002 [DOI] [PMC free article] [PubMed] [Google Scholar]
- 21.Nagy Á. et al. (2018) Validation of miRNA prognostic power in hepatocellular carcinoma using expression data of independent datasets. Sci. Rep. 8, 9227 10.1038/s41598-018-27521-y [DOI] [PMC free article] [PubMed] [Google Scholar]
- 22.Vasaikar S.V. et al. (2018) LinkedOmics: analyzing multi-omics data within and across 32 cancer types. Nucleic Acids Res. 46, D956–D963 10.1093/nar/gkx1090 [DOI] [PMC free article] [PubMed] [Google Scholar]
- 23.Aguirre-Gamboa R. et al. (2013) SurvExpress: an online biomarker validation tool and database for cancer gene expression data using survival analysis. PLoS ONE 8, e74250 10.1371/journal.pone.0074250 [DOI] [PMC free article] [PubMed] [Google Scholar]
- 24.Deng M. et al. (2017) FirebrowseR: an R client to the Broad Institute’s Firehose Pipeline. Database (Oxford) 2017, 10.1093/database/baw160 [DOI] [PMC free article] [PubMed] [Google Scholar]
- 25.Matsumoto K. and Wolffe A.P. (1998) Gene regulation by Y-box proteins: coupling control of transcription and translation. Trends Cell Biol. 8, 318–323 10.1016/S0962-8924(98)01300-2 [DOI] [PubMed] [Google Scholar]
- 26.Eliseeva I.A. et al. (2011) Y-box-binding protein 1 (YB-1) and its functions. Biochemistry (Mosc.) 76, 1402–1433 10.1134/S0006297911130049 [DOI] [PubMed] [Google Scholar]
- 27.Mordovkina D. et al. (2020) Y-box binding proteins in mRNP assembly, translation, and stability control. Biomolecules 10, 591 10.3390/biom10040591 [DOI] [PMC free article] [PubMed] [Google Scholar]
- 28.Ladomery M. and Sommerville J. (1995) A role for Y-box proteins in cell proliferation. Bioessays 17, 9–11 10.1002/bies.950170104 [DOI] [PubMed] [Google Scholar]
- 29.Wolffe A.P. (1994) Structural and functional properties of the evolutionarily ancient Y-box family of nucleic acid binding proteins. Bioessays 16, 245–251 10.1002/bies.950160407 [DOI] [PubMed] [Google Scholar]
- 30.Bargou R.C. et al. (1997) Nuclear localization and increased levels of transcription factor YB-1 in primary human breast cancers are associated with intrinsic MDR1 gene expression. Nat. Med. 3, 447–450 10.1038/nm0497-447 [DOI] [PubMed] [Google Scholar]
- 31.Shibahara K. et al. (2001) Nuclear expression of the Y-box binding protein, YB-1, as a novel marker of disease progression in non-small cell lung cancer. Clin. Cancer Res. 7, 3151–3155 [PubMed] [Google Scholar]
- 32.Ito Y. et al. (2003) Y-box binding protein expression in thyroid neoplasms: its linkage with anaplastic transformation. Pathol. Int. 53, 429–433 10.1046/j.1440-1827.2003.01494.x [DOI] [PubMed] [Google Scholar]
- 33.Shibao K. et al. (1999) Enhanced coexpression of YB-1 and DNA topoisomerase II alpha genes in human colorectal carcinomas. Int. J. Cancer 83, 732–737 [DOI] [PubMed] [Google Scholar]
- 34.Wu Y. et al. (2012) Strong YB-1 expression is associated with liver metastasis progression and predicts shorter disease-free survival in advanced gastric cancer. J. Surg. Oncol. 105, 724–730 10.1002/jso.23030 [DOI] [PubMed] [Google Scholar]
- 35.Kajino K. et al. (2001) Recombination hot spot of hepatitis B virus genome binds to members of the HMG domain protein family and the Y box binding protein family; implication of these proteins in genomic instability. Intervirology 44, 311–316 10.1159/000050063 [DOI] [PubMed] [Google Scholar]
- 36.Kudo S., Mattei M.G. and Fukuda M. (1995) Characterization of the gene for dbpA, a family member of the nucleic-acid-binding proteins containing a cold-shock domain. Eur. J. Biochem. 231, 72–82 10.1111/j.1432-1033.1995.tb20672.x [DOI] [PubMed] [Google Scholar]
- 37.Heinemeyer T. et al. (1998) Databases on transcriptional regulation: TRANSFAC, TRRD and COMPEL. Nucleic Acids Res. 26, 362–367 10.1093/nar/26.1.362 [DOI] [PMC free article] [PubMed] [Google Scholar]
- 38.Higgins C.F. (1992) ABC transporters: from microorganisms to man. Annu. Rev. Cell Biol. 8, 67–113 10.1146/annurev.cb.08.110192.000435 [DOI] [PubMed] [Google Scholar]
- 39.Bauer B.E., Wolfger H. and Kuchler K. (1999) Inventory and function of yeast ABC proteins: about sex, stress, pleiotropic drug and heavy metal resistance. Biochim. Biophys. Acta 1461, 217–236 10.1016/S0005-2736(99)00160-1 [DOI] [PubMed] [Google Scholar]
- 40.Klein I., Sarkadi B. and Váradi A. (1999) An inventory of the human ABC proteins. Biochim. Biophys. Acta 1461, 237–262 10.1016/S0005-2736(99)00161-3 [DOI] [PubMed] [Google Scholar]
- 41.Gai J. et al. (2013) FoxO regulates expression of ABCA6, an intracellular ATP-binding-cassette transporter responsive to cholesterol. Int. J. Biochem. Cell Biol. 45, 2651–2659 10.1016/j.biocel.2013.08.020 [DOI] [PubMed] [Google Scholar]
- 42.Kaminski W.E., Piehler A. and Wenzel J.J. (2006) ABC A-subfamily transporters: structure, function and disease. Biochim. Biophys. Acta 1762, 510–524 10.1016/j.bbadis.2006.01.011 [DOI] [PubMed] [Google Scholar]
- 43.van Leeuwen E.M. et al. (2015) Genome of The Netherlands population-specific imputations identify an ABCA6 variant associated with cholesterol levels. Nat. Commun. 6, 6065 10.1038/ncomms7065 [DOI] [PMC free article] [PubMed] [Google Scholar]
- 44.Yang Z. et al. (2018) Cholesterol inhibits hepatocellular carcinoma invasion and metastasis by promoting CD44 localization in lipid rafts. Cancer Lett. 429, 66–77 10.1016/j.canlet.2018.04.038 [DOI] [PubMed] [Google Scholar]
- 45.Kimmel A.R. and Sztalryd C. (2016) The perilipins: major cytosolic lipid droplet-associated proteins and their roles in cellular lipid storage, mobilization, and systemic homeostasis. Annu. Rev. Nutr. 36, 471–509 10.1146/annurev-nutr-071813-105410 [DOI] [PubMed] [Google Scholar]
- 46.Sztalryd C. and Brasaemle D.L. (2017) The perilipin family of lipid droplet proteins: gatekeepers of intracellular lipolysis. Biochim. Biophys Acta Mol. Cell Biol. Lipids 1862, 1221–1232 10.1016/j.bbalip.2017.07.009 [DOI] [PMC free article] [PubMed] [Google Scholar]
- 47.Asimakopoulou A. et al. (2014) Lipocalin-2 (LCN2) regulates PLIN5 expression and intracellular lipid droplet formation in the liver. Biochim. Biophys. Acta 1842, 1513–1524 10.1016/j.bbalip.2014.07.017 [DOI] [PubMed] [Google Scholar]
- 48.Chalasani N. et al. (2012) The diagnosis and management of non-alcoholic fatty liver disease: practice guideline by the American Gastroenterological Association, American Association for the Study of Liver Diseases, and American College of Gastroenterology. Gastroenterology 142, 1592–1609 10.1053/j.gastro.2012.04.001 [DOI] [PubMed] [Google Scholar]
- 49.Gluchowski N.L. et al. (2017) Lipid droplets and liver disease: from basic biology to clinical implications. Nat. Rev. Gastroenterol. Hepatol. 14, 343–355 10.1038/nrgastro.2017.32 [DOI] [PMC free article] [PubMed] [Google Scholar]
- 50.Asimakopoulou A. et al. (2019) Perilipin 5 and Lipocalin 2 expression in hepatocellular carcinoma. Cancers (Basel) 11, 10.3390/cancers11030385 [DOI] [PMC free article] [PubMed] [Google Scholar]
- 51.Pope E.D. III et al. (2019) Aberrant lipid metabolism as a therapeutic target in liver cancer. Expert Opin. Ther. Targets 23, 473–483 10.1080/14728222.2019.1615883 [DOI] [PMC free article] [PubMed] [Google Scholar]
- 52.Yan S. et al. (2018) Hyperspectral stimulated Raman scattering microscopy unravels aberrant accumulation of saturated fat in human liver cancer. Anal. Chem. 90, 6362–6366 10.1021/acs.analchem.8b01312 [DOI] [PubMed] [Google Scholar]
- 53.Calvisi D.F. et al. (2011) Increased lipogenesis, induced by AKT-mTORC1-RPS6 signaling, promotes development of human hepatocellular carcinoma. Gastroenterology 140, 1071–1083 10.1053/j.gastro.2010.12.006 [DOI] [PMC free article] [PubMed] [Google Scholar]
- 54.Trivedi P.J. et al. (2016) Stratification of hepatocellular carcinoma risk in primary biliary cirrhosis: a multicentre international study. Gut 65, 321–329 10.1136/gutjnl-2014-308351 [DOI] [PubMed] [Google Scholar]
- 55.Sun L. et al. (2016) Bile acids promote diethylnitrosamine-induced hepatocellular carcinoma via increased inflammatory signaling. Am. J. Physiol. Gastrointest. Liver Physiol. 311, G91–G104 10.1152/ajpgi.00027.2015 [DOI] [PMC free article] [PubMed] [Google Scholar]
- 56.Keppler D. and König J. (2000) Hepatic secretion of conjugated drugs and endogenous substances. Semin. Liver Dis. 20, 265–272 10.1055/s-2000-9391 [DOI] [PubMed] [Google Scholar]
- 57.Maciejewska-Skrendo A. et al. (2019) The polymorphisms of the peroxisome-proliferator activated receptors’ alfa gene modify the aerobic training induced changes of cholesterol and glucose. J. Clin. Med. 8, 1043 10.3390/jcm8071043 [DOI] [PMC free article] [PubMed] [Google Scholar]
Associated Data
This section collects any data citations, data availability statements, or supplementary materials included in this article.
Supplementary Materials
Data Availability Statement
The datasets generated and/or analyzed during the current study are available in the Supplementary Material and TCGA-LGG program (https://portal.gdc.cancer.gov).


