

Abstract

A biocomposite scaffold was developed using chitosan (CS) and bovine-derived hydroxyapatite (BHA). The prepared CS–BHA biocomposite scaffold was characterized for its physiochemical and biological properties and compared against control BHA scaffolds to evaluate the effects of CS. Energy-dispersive X-ray analysis confirmed the elemental composition of the CS–BHA scaffold, which presented peaks for C and O from CS and Ca and P along with trace elements in the bovine bone such as Na, Mg, and Cl. Fourier transform infrared spectroscopy confirmed the presence of phosphate, hydroxyl, carbonate, and amide functional groups attributed to the CS and BHA present in the biocomposite scaffolds. The CS–BHA scaffolds demonstrated an interconnected porous structure with pore sizes ranging from 60 to 600 μm and a total porosity of ∼64–75%, as revealed by scanning electron microscopy and micro-CT analyses, respectively. Furthermore, thermogravimetric analysis revealed that the CS–BHA scaffold lost 70% of its weight when heated up to 1000 °C, which is characteristic of CS phase decomposition in the biocomposite. In vitro studies demonstrated that the CS–BHA scaffolds were biocompatible toward Saos-2 osteoblast-like cells, showing high cell viability and a significant increase in cell proliferation across the measured timepoints compared to the controls.
1. Introduction
Increasing life expectancy and prevalence of obesity have contributed to a surge in musculoskeletal disorders. Treatment of musculoskeletal disorders are expensive, and the soaring demand for such treatments poses serious financial problems globally.1 The current gold standard, autografts, has limitations such as limited availability, requirement for multiple surgeries, and donor-site morbidities. Only 60% of all patients meet the eligibility criteria for autograft-based solutions.2 Although allograft resolves issues of availability, they carry the risk of disease transmission and rejection. Hence, the use of synthetic biomaterials or biocomposites provide an excellent alternative for repairing bony defects.3
Hydroxyapatite (HA) is the main inorganic compound that is found in bones and teeth known for its biocompatibility, osteoconductivity, and bioactivity.4,5 Bovine-derived hydroxyapatite (BHA) provides an effective and economical raw material for xenograft bone substitutes. Having trace elements such as sodium, magnesium, and fluoride, the BHA bears a similar architecture to HA found in the human bones and teeth.6 New Zealand (NZ)-sourced bovine bones are valued because of the high agricultural standards in the country and bovine spongiform encephalopathy free status, making them an ideal source for the xenograft material.7 BHA scaffolds produced from NZ-sourced bovine bones by Ratnayake et al. were found to possess the ideal porosity and biocompatibility required for a biomaterial scaffold.6 However, BHA lacks antimicrobial activity which increases the chance of infections during implantation.8 These disadvantages of the BHA scaffolds can be augmented by combining BHA with a polymeric material which would impart the deficient properties to the BHA material. Chitosan (CS) is an N-deacetylation product of chitin.9 CS has wide-ranging applications, ranging from being used in food packaging, drug delivery, and wound closures.10−15 The intrinsic biodegradability, nontoxicity, biocompatibility, and antimicrobial ability all make CS a favorable biomaterial for biomedical applications.10,16 CS can be molded into the various structures from membranes to porous scaffolds and combined with other materials such as nanotubes.14,15,17 In the present study, we aim to develop a biocomposite scaffold from commercially sourced CS and HA derived from NZ bovine bones (BHA). The BHA was extracted through a protocol developed by Ratnayake et al.,6 where the bovine bones were sectioned, defatted, and deproteinized in stages. The powdered BHA were then mixed with CS solution to prepare the CS–BHA biocomposite scaffold. The chemical properties of the scaffold were characterized using Fourier transform infrared spectroscopy (FTIR), energy-dispersive X-ray (EDX) analysis, and thermogravimetric analysis (TGA). Structural properties were investigated using scanning electron microscopy (SEM) and microcomputer tomography (μ-CT) imaging. In vitro studies such as LIVE/DEAD assay and cell proliferation were conducted to evaluate the biocompatibility of the material.
2. Materials and Methods
2.1. Preparation of BHA Powder
Following a protocol from Ratnayake et al.6 The cancellous bones were sourced from the condyle portion of the bovine femur. The bones were then sectioned using a bandsaw into small cubes (2 cm × 2 cm x 2 cm) with each ends of the femur yielding 8–10 cubes. To remove the soft tissues such as cartilage and fat, the cubes were pressure cooked in a stainless steel pressure cooker at 15 psi (103.4 kPa) and then soaked in 0.1 M NaOH solution for 12 h at 70 °C. A pH of at least 12 was maintained by constant monitoring with additions of 0.1 M of NaOH. Finally, the cubes were submerged in deionized water and exposed to microwave energy for 5 min in a domestic microwave oven (2.45 GHz, 1100 W Samsung).
The defatted cubes were subjected to subcritical water extraction (SWCE) in a hydrothermal pressure vessel to extract the organic matter such as collagen. The cubes were placed into deionized water, and nitrogen gas was used to displace the oxygen. The pressure vessel was tightly sealed and heated to 180 °C for 1 h, followed by being quenched in large amounts of ice. The bones were then left to dry for 24 h before sintering. The dry cubes were sintered in a furnace at 650 °C for 6 h under atmospheric pressure. The processed cubes were then grounded down using a mortar and pestle and further milled into nanosize particles using a ball mill (McCRONE, USA). A 5% (w/v) HA (2.5 g) was selected as it was the highest possible concentration in a pilot study conducted by Reilly18 to be added with CS to form the biocomposite scaffold.
2.2. Preparation of CS Scaffolds
An 8% (w/v) solution of CS was chosen as the desired concentration based on preliminary trials in conjunction with Reilly18 because of their effect on the pore morphology which will be discussed later in this article. The CS solution (8% w/v) was made by dissolving 4 g of CS in 50 mL of 1% acetic acid solution. The solution was then mixed at room temperature for 5 min or until a transparent gel was formed. The milled BHA (2.5 g) was added to the mixture to create a 5% (w/v) concentration and thoroughly mixed until white BHA powder was dispersed throughout the gel. The CS–BHA gel was placed in a vacuum chamber to remove any air bubbles and subsequently frozen at −20 °C prior to lyophilization. The temperature of the freeze dryer was reduced to at least −40 °C before the samples were placed inside. The vacuum was then activated for 1 h before the temperature was increased to 0 °C for 20 h as the primary dehydration process. The temperature was then raised to 20 °C for an additional 24 h as the secondary dehydration process to remove residual water. The scaffolds were then collected and subjected to ethanol dilution to remove the acetic acid by submerging it in absolute ethanol for 1 h, and then in 90, 80, 70, and 50% ethanol solution for 30 min each. The scaffold was then rinsed with distilled water and freeze-dried again.
2.3. Characterization
The functional groups of the CS–BHA biocomposite scaffold were identified using FTIR spectroscopy (PerkinElmer #100) over the regions of 400–4000 cm–1, with 4 cm–1 spectral resolution by using the KBr pellet technique. The investigation of thermal stability and thermal decomposition was carried out using TGA. The biocomposite scaffold was tested using a TGA analyzer (TGA; Q 50 from TA Instruments, USA) operating in the ramp mode from 20 to 1000 °C at 10 °C/min under a N2 atmosphere. A scanning electron microscope (JOEL 2300, Tokyo Japan) equipped with an EDX (Oxford UK) analyzer working at 15 kV and 15 mA was used to analyze the morphology of the surface and identify the elemental composition of the scaffolds.
2.4. Microarchitectural Analysis of the CS–BHA Scaffold
An 8 mm disc of the CS–BHA scaffold was placed into the chamber of a SkyScan 1172 high-resolution μCT scanner (Bruker-Micro CT, Kontuch, Belgium) to quantify the three-dimensional (3D) microstructure of the scaffold sample. The SkyScan system had an X-ray source with a focal spot of <5 μm and was operating at 40 kV, 250 μA and used a 10 Mp detector. Two-dimensional (2D) images were obtained by rotating the sample 180° at a rotation of 0.4° per section. About 800 images were taken over a period of 30 min. The 2D images were then complied and stacked together using ImageJ software to create a 3D image to measure the porosity of the samples.
2.5. In Vitro Biocompatibility Assay
The biocompatibility of the scaffold was assessed using a modified direct method using human osteoblast-like cells (Saos-2) along with the LIVE/DEAD cell viability/cytotoxicity assay (Invitrogen Life Technologies) and MTS cell proliferation assay (CellTiter 96 Aqueous One Solution, Promega, WI). For this study, Saos-2 cells were purchased from the American Type Culture Collection (ATCC; Virginia, USA) and was chosen to investigate the in vitro biocompatibility of the developed CS–BHA and BHA scaffolds. Saos-2 is an osteosarcoma cell line derived from an 11-year-old Caucasian girl in 1973 and was originally isolated and characterized by Fogh et al.19 Saos-2 cells are commonly used to assess the biocompatibility of biomaterials for bone regeneration applications because of their osteoblast-like properties such as ability to produce a mineralized extracellular matrix.20−23
2.5.1. Scaffold Preparation and Sterilization
For all in vitro work, an 8 mm biopsy punch was used to prepare circular discs of the CS–BHA scaffolds. Using the same method, circular discs of BHA scaffolds were prepared to be used as controls for the assays. For sterilization, the scaffolds were submerged in 70% ethanol for 30 min followed by exposure to UV light for 30 min and then subsequently rinsed in phosphate buffered saline (PBS) for 2 min. The scaffolds were placed in 1 mL of the cell culture media to equilibrate overnight in a cell culturing chamber at 37 °C with 5% CO2 before they were deemed ready for cell seeding.
2.5.2. Cell Culture Preparation
Human osteoblast-like cells [Saos-2 (ATCC HTB-85, USA)] were grown in 25 cm2 vented cell culture flasks in a humified incubator at 37 °C with 5% CO2. The cells were maintained in the minimum essential media alpha (Invitrogen Life Technologies, USA) medium supplemented with 10% fetal bovine serum (Thermo Fisher Scientific, NZ) and 1% penicillin–streptomycin antibiotics (Life Technologies, Auckland, NZ). The CS–BHA discs and as a control, BHA discs, were prepared using an 8 mm biopsy punch with a depth of 5 mm. Before seeding the cells, the scaffolds were sterilized by immersion in 70% ethanol and left to dry, before exposing to ultraviolet radiation for 30 min, followed by rinsing with PBS for 2 min to remove any traces of ethanol. The scaffolds were equilibrated in the culture medium for 48 h at 37 °C in a humidified atmosphere of 5% CO2. The media was removed, and cells were seeded directly onto each scaffold at a density of 6 × 10³ cells/scaffold for the LIVE/DEAD cytotoxicity and cell proliferation assays. This specific cell density has been identified as reaching an appropriate level of confluency over time.24 Three replicates were used for each scaffold type and the controls.
2.5.3. LIVE/DEAD Assay for Cell Viability/Cytotoxicity
To assess the cell viability of Saos-2 cells on the BHA and CS–BHA, the scaffolds were processed using the LIVE/DEAD cytotoxicity kit for mammalian cells. Glass cover slips were used as additional controls. Fluorescent visualization was with a confocal laser-scanning microscope (Carl Zeiss Micro Imaging GmBH, Jena, Germany). Images were captured using Zen 2009 software (Carl Zeiss). Cell counts was performed on three random fields per scaffold and controls using a 10× objective lens at 24, 48, and 72 h. The cell viability for each image was calculated according to the following equation:
The attachment and morphology of the cells were investigated by first freeze drying and then coating in platinum palladium before being viewed by SEM (JOEL Ltd., Tokyo, Japan).
2.5.4. MTS Assay for Cell Proliferation
The cell proliferation for CS–BHA and the BHA scaffolds was determined using the MTS [3-(4,5-dimethylthiazol-2yl)-5-(3-caebozymethoxyphenyl)-2-(4,5-dimesulphonyl)-2H-tetrazolium] assay (CellTiter 96 Aqueous One Solution, Promega, Madison, WI), according to the manufacturer’s instructions. After 24, 48, and 72 h, cell proliferation was assessed by calorimetric measurement of the samples using a spectrophotometer (Synergy 2 multi-mode microplate reader, Biotek) at a wavelength of 490 nm.
2.6. Statistical Analysis
Statistical analysis was performed using Prism (GraphPad Prism 6, CA, USA) software. Bar graphs were reported as + standard error of the mean. Nonlinear curves were represented by their equations and coefficient of determination (r2) values. Statistically significant differences were determined using one-way analysis of variance (ANOVA). If differences were detected, multiple comparisons were made using Tukey’s multiple comparison tests at a confidence level of 95% (P < 0.05).
3. Results
3.1. Optimization of CS Concentration
Preliminary SEM analysis (Figure 1) of the CS scaffolds of varying concentrations revealed that increasing the CS concentration above 8% led to a decrease in the pore size. There was an increase in homogeneity of the pore morphology from 4% (w/v) to 8% (w/v) CS, with less rectangular and more circular pores at 8% (w/v). Increasing concentration beyond 10% (w/v) resulted in scaffolds with an inappropriate pore size for cellular integration, ranging between 40 and 100 μm. A low concentration of CS (<4%) resulted in large rectangular and extremely fragile wall, eventually losing their structural integrity.
Figure 1.

SEM images of the preliminary scaffold architecture. (A) 1.5, (B) 2, (C) 4, (D) 8, (E) 9, (F) 10, (G) 11, and (H) 12% (w/v) CS. Pore sizes are indicated in red. All images were captured at ×100 magnification.
3.2. Production of CS–BHA Biocomposite Scaffold
After defatting and deproteination, majority of the collagen and fats had liquified out of the matrix. SWCE resulted in the cubes becoming brittle with pale-yellow color. After the sintering processes, the cubes became harder and whiter. An 8% (w/v) concentration of commercial CS was dissolved in acetic acid, resulting in a pale-yellow gel, and minimal change was observed after addition of ball-milled BHA powder. The CS–BHA gel was then freeze-dried to become a hard and light-yellow sponge (Figure 2). The solid scaffold was punched with an 8 mm biopsy, no changes were observed with serial ethanol dilution and subsequent freeze-drying, except small cotton-like reside found in the wells.
Figure 2.

3 CS–BHA biopsy-punched scaffold disc with 8 mm diameter.
3.3. FTIR Spectroscopy
FTIR spectroscopy was used to characterize functional groups of the CS–BHA scaffold after the final freeze-drying. Figure 3 reveals characteristic peaks of the hydroxyl group (OH–) at 3430–1 and phosphate group (PO43–) between 500 and 700 cm–1 (564, 603, and 634 cm–1) associated with the presence of HA. The peaks at 1645 and 1554 cm–1 represented carbonyl groups of amide I and amide II, respectively. The peaks at 1033 and 1155 cm–1 were assigned to the carbon–oxygen (C–O) stretching vibration.
Figure 3.

FTIR of the CS–BHA scaffold revealing the peaks associated with HA and CS.
3.4. Micro-CT (Porosity)
Approximately 800 2D images were taken by the μ-CT from an 8 mm biopsy-punched scaffold. The biopsy punch was taken from the center of the well plate after the final freeze-drying process. Figure 4 shows a reconstructed 3D architecture of the bio-scaffold with large white spots representing BHA granules. Thin white traces of CS between the BHA can also be observed, generating an interconnected porous architecture. By using SkyScan software, the total porosity of the BHA scaffold was calculated to be between 64.35 and 74.55%.
Figure 4.

Micro-CT revealing the porosity, interconnected pores, and BHA dispersed throughout the scaffold.
3.5. SEM (Pore Size)
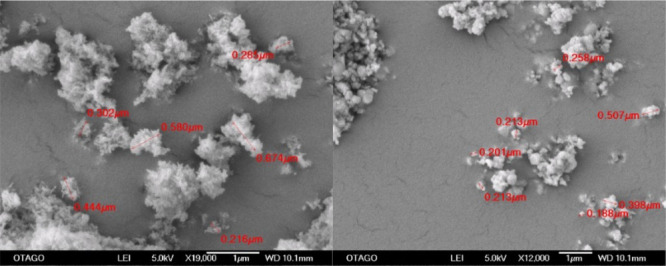
Macroscopic images were taken from the carefully sliced interior portion of the scaffold. The pore size of the CS–BHA scaffold ranged between 60 and 600 μm, with an average pore size of 133 μm (Figures 5).
Figure 5.

Scanning electron micrograph of CS–BHA biocomposite scaffolds.
3.6. EDX Analysis
The EDX results (Figure 6) revealed that the inorganic phase of the CS–BHA scaffold were mainly composed of calcium, phosphate, carbon, and oxygen as the main constituent. Trace elements such as sodium, magnesium, and chloride were detected in lower quantities. No toxic elements such as Cd and Hg were detected.
Figure 6.

EDX of the CS–BHA scaffold showing the elemental composition of the CS–BHA.
3.7. TGA
Figure 7 shows the results of the TGA analysis of the CS–BHA scaffold in terms of weight loss to temperature. The results show significant weight loss, losing up to 70% of its original mass at 600 °C. The scaffold did not lose significant weight after 600 °C and remained stable up to 1000 °C for the rest of the duration of the investigation.
Figure 7.

TGA analysis of the CS–BHA from 20 to 1000 °C.
3.8. In Vitro Biocompatibility Test: LIVE/DEAD Assay
The LIVE/DEAD cell assay (Figure 8) revealed that the CS–BHA scaffold was nontoxic, and results indicated excellent viability for all time periods. The cell viability for Saos-2 cells on the CS–BHA scaffolds were above 94% at all points of the study—95% viability at 24 h, 94% at 48 h, and 96% at 72 h. When compared to BHA, there was no significant difference.
Figure 8.

Fluorescence images (A–I) of the CS–BHA scaffold seeded with Saos-2 cells stained with the LIVE/DEAD viability assay. Green = live cells (calcein). Red = dead cell (ethidium homodimer-1). Images show Saos-2 cells at 24 (A–C), 48 (D–F), and 72 h (G–I). Bar = 100 μm.
3.9. Cell Attachment and Morphology
The growth, attachment, and morphology of the cells were also observed after 24, 48, and 72 h of incubation and evaluated using SEM imaging (Figure 9). In brief, the CS–BHA scaffolds with cells were fixed with 2.5% glutaraldehyde in 0.1 M cacodylate buffer (CB), pH 7.4 for 1 h with subsequent PBS and water rinse. The scaffolds were further washed with CB buffer and later fixed with 1% osmium tetroxide to improve the conductivity. The samples were then washed with distilled water for 5 min, further dehydrated for 10 min in a serial diluted ethanol solution of 30, 50, 70, 90, and 100%, and critical point dried in a Bal-tec CPD030 critical point dryer (Bal-tec, Balzers, Leichtenstein). The samples were mounted on aluminium stubs using adhesive carbon tape, sputter coated in an Emitech K575X sputter coater with 10 nm of gold palladium. The SEM images were captured at 15 kV accelerating voltage using SEM. The micrograph revealed osteoblast-like cell attachment on the CS–BHA biocomposite scaffold. The cells developed cytoplasmic extension between the cells and some adhering to the surface.
Figure 9.

SEM images: picture A (left) shows the extracellular-matrix mesh-like sheets between cells and also adhering to the surface, picture B (right) shows the cytoplasmic projection occurring between cells for intercellular communication indicated by a red arrow.
3.10. Cell Proliferation
The cell proliferation and biocompatibility of each of the scaffold groups were investigated through the MTS assay shown in Figure 10. BHA scaffolds were used as the control group.6,23 The cell number increased with time for both CS–BHA and BHA scaffolds and were biocompatible for the Saos-2 cells. CS–BHA scaffolds showed significantly higher cell number in comparison to their previous timepoints, with cell numbers at 72 h being the highest. There were no significant differences observed between CS–BHA and controls for each timepoints. However, the number of cells was higher at 48 and 72 h in CS–BHA compared to control BHA scaffolds (ANOVA; P = 0.05)
Figure 10.

Proliferation of Saos-2 cells after seeding onto CS–BHA and BHA (n = 3, **P < 0.01, ***P < 0.001, and error bars represent the SE of the mean).
4. Discussion
The preliminary optimization of the CS concentration to choose the ideal concentration for scaffold preparation revealed that varying concentrations of CS affected the interconnecting porous structure of the scaffolds. The results indicated that increasing CS concentrations to 10% (w/v) reduced the pore size and porosity, falling below 100 μm. Low pore diameter, less than 100 μm, reduces cellular integration, leading to poor biocompatibility.25,26 At very low concentrations, the structural integrity is compromised because of the extreme diameter of the pores and thinness of the walls. The concentration of CS is a major factor when freeze drying is the method of production. Increasing CS concentrations in the solution result in thicker walls, reducing the porosity.27 Through this preliminary study, 8% CS was chosen to continue on because of its optimal pore characteristic. The optimal pore size can vary from 100 to 300 μm for tissue regeneration.28 A study conducted by Felfel et al.29 used CS and agarose and found that scaffolds with smaller pores had increased mechanical strength because of better interconnectivity, however, lacked biocompatibility because of the small pore morphology. Scaffolds with larger pore morphology were mechanically weaker but had superior biocompatibility because of better cellular integration.29,30
The bovine femur condyle cubes were successfully pressure cooked to remove the majority of the fat and tissue from the exterior. The NaOH solution and microwave extracted the fats and tissue from the bone matrix, leaving behind a yellow colored scaffold.2 The microwaves can be considered to be a more economical and accessible alternative compared to laboratories methods such as Soxhlet extraction.31
SWCE altered the hardness of the cubes, causing the cubes to become soft and fragile. SWCE has become a more popular method in recent years. It is known for its natural matrices, low cost, and environmentally friendly method.32 Heating the water under high pressure and temperature reduces its dielectric constant and polarity. This allows water to be more efficient at disrupting the matrix of an organic compound,6,33 resulting in cubes of HA. An additional sintering process was used to remove any residue of the organic material leaving behind pure white HA cubes. The BHA cubes were then ball milled into fine white powder. The powder was observed through a scanning electron microscope as small spherical crystals, as opposed to rod-shaped crystals from the synthetic HA, as shown in Figure 11.
Figure 11.
Left: Synthetic HA crystals, Right: Spherical BHA.
FTIR was used to characterize the functional groups present in the CS–BHA scaffold. Figure 3 reveals that peaks found between 500 and 700 cm–1 (564, 603, and 634 cm–1) are standard peaks that represent phosphate (PO4).6,34 The peak at 1645 cm–1 representing amide I and the peak at 1554 cm–1 representing amide II display the intramolecular hydrogen bonding forces between the two-carbonyl group of CS. The peaks between 1033 and 1155 cm–1 were ascribed to the bridge-O stretching vibration and the C–O stretching vibration. The peak at 1410 cm–1 is assigned to the symmetrical deformation of CS. Intramolecular hydrogen bonding forces between the amide (N–H) bond of CS and the hydroxyl group (OH) of BHA can be observed at the peak at 3430 cm–1.35,36 The FTIR spectra of the CS–BHA bio-scaffold sample indicate that the characteristic bands of both hydroxyl-phosphate containing compound and CS are present in the biocomposite scaffold. This FTIR investigation suggests that the structure of the CS scaffold has provided a matrix to house nano-BHA particles and bind them together. Similar peaks assigned to phosphate and hydroxyl functional groups were found by Ross et al.23 after HA was produced from bovine bones.
Micro-CT analysis of the biocomposite scaffold measured the porosity as between 64.35 and 74.55%. The porosity of a scaffold is of vital importance as it determines a scaffold’s ability to harbor cellular infiltration and attachment and promote osteointegration and osteoconduction. By having a high porosity, it can provide mechanical interlocking ability with the surrounding tissue and bone, thus providing additional mechanical stability.37 The porosity of the CS–BHA is similar to that of human’s cancellous bones, which is approximately 70%, allowing for the exchange of nutrients and waste material because of enhanced vascularization.38,39 Additional studies have found that by varying the concentration of CS, the porosity of the scaffold could be changed. The literature reports variable porosities from 60 to 90% for CS-based scaffold materials.40−42 By freeze-drying at −20 °C, the porosity observed is consistent with authors Si et al and Radhika Rajasree et al,43,44 whereas freezing at lower temperatures such as −80 °C (as opposed to −20 °C in this study) has also been reported to create high porosity. One possible explanation is that having a lower freezing temperature produces a faster freezing rate of CS. This provides ice crystals more time to grow larger, and therefore, the final product has more integrity compared to scaffolds frozen at −20 °C34,45
The pore sizes of the CS–BHA scaffold, as measured by SEM analysis, ranged between 60 and 600 μm. Several factors influence the pore size, such as the concentration of CS, HA, freezing time, freezing temperatures, and rate of freezing and heating.27 Previous studies have indicated that freezing at even lower temperature such as −80 °C causes elongated pore size, irregular pore connectivity, and a layered architecture.46−48 This difference in the morphology of the pore with respect to the freezing temperature is due to the effect known as the phase separation phenomena.49 At higher freezing temperatures, such as −20 °C, mass transfer is the main driver for phase separation formation. Compared to lower temperatures, such as −80 °C, where there is a faster freezing rate, phase separation is dominated by heat transfer instead. Because aqueous acetic acid is the medium used to dissolve the CS, the pore morphology is mainly determined by the crystallization of water, which in turn is governed by either mass transfer or heat transfer. In this case, it is mass transfer because of the higher freezing temperature. The pore morphology is an essential feature of scaffolds in clinical applications. The average pore size needs to range above 100 μm, the minimum requirement, for optimum osteogenic integration, thus allowing for fluid transport, cell migration, neovascularization, and osteogenesis.6,38,39 It has been reported in the literature that a pore diameter of 300 μm is essential for vascularization of the scaffold for bone in growth, while pore sizes above 20–100 μm allow for cell infiltration.37,50,51
Calcium, phosphate, carbon, and oxygen were the main constituents from EDX analysis with trace amounts of sodium and magnesium. Trace elements play a vital role in bone metabolism such as magnesium ions stimulating osteoblast proliferation during the early stages of osteogenesis and sodium ions involvement in bone mineralization, resorption, and cell adhesion.52 There were no toxic elements such as cadmium or mercury detected from the EDX. The high carbon and oxygen content were attributed to the presence of CS.34 This suggest that the HA and CS remained intact after refining processes of this investigation method.
The results from the TGA analysis (Figure 7) indicated that there is a 10% weight loss (endothermic loss) at 50 °C which may be due to the residue/bind water loss.53 This sharp decrease is observed between 50 and 100 °C, which is consistent with the boiling point of water. The second major weight loss (exothermic loss) occurred between 250 and 600 °C accounting for a further 60% weight loss. Between the temperature of 200–400 °C, a mass decrease is observed and is due to the process of further dehydration, polymerization, and decomposition of the acetylated units of the CS biopolymer resulting in degradation. Kong et al. found a similar TGA analysis result in a CS/synthetic HA scaffold.34,36 The last decrease in mass is observed at about 500–600 °C, where CS continued to degrade. This behavior of CS–BHA scaffolds agrees with the findings of Kong et al. who observed a complete decomposition of CS from their CS-synthetic HA scaffolds at 600 °C.36 The thermal degradation of the scaffold finally stabilized at 30% of its original weight after 600 °C, with little to no change in mass for the remaining duration of the investigation (up to 1000 °C).
4.1. In Vitro Biocompatibility Assay
The viability of the cells on the CS–BHA biocomposite scaffolds were assessed using a LIVE/DEAD cytotoxicity assay kit. In order to observe the presence of the live cells and dead cells, fluorescence staining was performed. Live cells appeared green because of the binding of calcein, and dead cells appeared red because of the ethidium homodimer (Figure 8). The results show the growth of Saos-2 cells cultured for 24, 48, and 72 h on the CS–BHA scaffold. These results indicate that the scaffold is nontoxic and supported the proliferation of Saos-2 cells, similar to that of the controls.6 The live cells proliferated and distributed through the scaffold, especially around the areas of pores of the scaffold. All these characteristics are important indicators of biocompatibility as it suggests that the cells can migrate and penetrate the matrix of the scaffold for attachment and proliferation.54,55
Evaluation of cellular attachment and morphology (Figure 9) showed that the cytoplasmic extensions ranged from 30 to 50 μm and contained a mesh-like network/bundle of actin-containing microfilaments. These bundles help the movement of migrating cells along the surface.41,56 SEM images (Figure 9) also revealed the beginning of the sheet-like morphology spread on the surface of the CS–BHA scaffold involving multiple cells. These extracellular matrix sheets are the beginning of the formation of a multilayer structure,57 and because of the short timeframe of incubation (72 h), it suggests that the Saos-2 cells have a high affinity to the surface of the CS–BHA scaffold.
The ability of the scaffold to promote cell proliferation was assessed using the MTS assay. There was no significant difference seen at each timepoint (24, 48, and 72 h) from when the cells were seeded onto the CS–BHA compared to BHA scaffolds. The results (Figure 10) also indicate that the cell density progressively increased over time, and at 72 h for CS–BHA, the results were significant compared to 24 and 48 h timepoints. CS–BHA had a higher cell density at 48 and 72 h compared to the BHA scaffold. A similar study carried out by Trakoolwannachai et al. revealed that incorporating CS into HA increases the roughness of the surface of the scaffold and thus increases the surface area for cell proliferation.58,59 Improved cell proliferation because of the increased surface area is also observed in the Chen et al study.54 The cellular differentiation and osteoinductive properties of the CS–BHA scaffold were not evaluated, which is a further limitation of the study. The alkaline phosphatase assay would investigate the differentiation process of Saos-2 cells on the CS–BHA scaffolds which would lead to extracellular bone matrix production. In addition, the clinical feasibility of the CS–BHA scaffold as a bone graft substitute material was not evaluated in this study. Therefore, the next stage of this study should investigate the biocompatibility of the CS–BHA graft using the alkaline phosphatase assay, mechanical properties, and an in vivo study where the CS–BHA is implanted into a critical-sized defect in a rat model, investigating its bone healing capacity using long-term (6 months) histological analysis.
5. Conclusions
A biocomposite scaffold was developed successfully using CS and NZ-sourced BHA. The prepared CS–HA biocomposite presented an interconnected porous network along with the ideal pore sizes and porosity required for osteoconductivity. The prepared biocomposite scaffolds were successfully evaluated for the physiochemical properties using an array of characterization techniques. The CS–BHA scaffolds were found to be biocompatible, and no cytotoxicity was observed toward the osteoblast-like Saos-2 cells seeded on the scaffolds. The Saos-2 cells seeded onto the CS–BHA scaffold cells were able to adhere and maintain a high cell viability and presented significantly higher cell (proliferation) number across the measured timepoints. The results of this study indicate that the CS–BHA scaffold has potential for bone-tissue engineering applications in the biomedical field; however, further research is needed on its possible application in a clinical setting.
Acknowledgments
The authors would like to thank and acknowledge the facilities as well as the scientific and technical assistance from the staff at the Otago Center of Electron Microscopy at the University of Otago. We would also like to thank the Chemistry Department at the University of Otago for their assistance in FTIR and TGA. The first author would like to thank Otago Medical School for the Honours scholarship by the University of Otago, New Zealand.
The authors declare no competing financial interest.
References
- Min J.; Choi K. Y.; Dreaden E. C.; Padera R. F.; Braatz R. D.; Spector M.; Hammond P. T. Designer Dual Therapy Nanolayered Implant Coatings Eradicate Biofilms and Accelerate Bone Tissue Repair. ACS Nano 2016, 10, 4441–4450. 10.1021/acsnano.6b00087. [DOI] [PMC free article] [PubMed] [Google Scholar]
- Mucalo M. R.; Worth A. J. Biomedicals from Bone. Chem. N.Z. 2008, 72, 13–18. [Google Scholar]
- Heise U.; Osborn J. F.; Duwe F. Hydroxyapatite ceramic as a bone substitute. Int. Orthop. 1990, 14, 329–338. 10.1007/bf00178768. [DOI] [PubMed] [Google Scholar]
- Fathi M. H.; Hanifi A.; Mortazavi V. Preparation and bioactivity evaluation of bone-like hydroxyapatite nanopowder. J. Mater. Process. Technol. 2008, 202, 536–542. 10.1016/j.jmatprotec.2007.10.004. [DOI] [Google Scholar]
- Ferraris S.; Yamaguchi S.; Barbani N.; Cazzola M.; Cristallini C.; Miola M.; Vernè E.; Spriano S. Bioactive materials: In vitro investigation of different mechanisms of hydroxyapatite precipitation. Acta Biomater. 2020, 102, 468. 10.1016/j.actbio.2019.11.024. [DOI] [PubMed] [Google Scholar]
- Ratnayake J. T. B.; Gould M. L.; Shavandi A.; Mucalo M.; Dias G. J. Development and characterization of a xenograft material from New Zealand sourced bovine cancellous bone. J. Biomed. Mater. Res., Part B 2017, 105, 1054–1062. 10.1002/jbm.b.33644. [DOI] [PubMed] [Google Scholar]
- Herrera V.New Zealand’s Position with Regard to BSE; Ministry of Primary Industries Biosecurity New Zealand, 2019, March 25, 2019.
- Riaz M.; Zia R.; Ijaz A.; Hussain T.; Mohsin M.; Malik A. Synthesis of monophasic Ag doped hydroxyapatite and evaluation of antibacterial activity. Mater. Sci. Eng. C 2018, 90, 308–313. 10.1016/j.msec.2018.04.076. [DOI] [PubMed] [Google Scholar]
- Rinaudo M. Chitin and chitosan: Properties and applications. Prog. Polym. Sci. 2006, 31, 603–632. 10.1016/j.progpolymsci.2006.06.001. [DOI] [Google Scholar]
- Felt O.; Buri P.; Gurny R. Chitosan: A Unique Polysaccharide for Drug Delivery. Drug Dev. Ind. Pharm. 1998, 24, 979–993. 10.3109/03639049809089942. [DOI] [PubMed] [Google Scholar]
- Ueno H.; Mori T.; Fujinaga T. Topical formulations and wound healing applications of chitosan. Adv. Drug Delivery Rev. 2001, 52, 105–115. 10.1016/s0169-409x(01)00189-2. [DOI] [PubMed] [Google Scholar]
- Liu M.; Zeng X.; Ma C.; Yi H.; Ali Z.; Mou X.; Li S.; Deng Y.; He N. Injectable hydrogels for cartilage and bone tissue engineering. Bone Res. 2017, 5, 17014. 10.1038/boneres.2017.14. [DOI] [PMC free article] [PubMed] [Google Scholar]
- Liu M.; Zheng H.; Chen J.; Li S.; Huang J.; Zhou C. Chitosan-chitin nanocrystal composite scaffolds for tissue engineering. Carbohydr. Polym. 2016, 152, 832–840. 10.1016/j.carbpol.2016.07.042. [DOI] [PubMed] [Google Scholar]
- Liu M.; Wu C.; Jiao Y.; Xiong S.; Zhou C. Chitosan-halloysite nanotubes nanocomposite scaffolds for tissue engineering. J. Mater. Chem. B 2013, 1, 2078–2089. 10.1039/c3tb20084a. [DOI] [PubMed] [Google Scholar]
- Liu M.; Dai L.; Shi H.; Xiong S.; Zhou C. In vitro evaluation of alginate/halloysite nanotube composite scaffolds for tissue engineering. Mater. Sci. Eng., C 2015, 49, 700–712. 10.1016/j.msec.2015.01.037. [DOI] [PubMed] [Google Scholar]
- Kozen B. G.; Kircher S. J.; Henao J.; Godinez F. S.; Johnson A. S. An Alternative Hemostatic Dressing: Comparison of CELOX, HemCon, and QuikClot. Acad. Emerg. Med. 2008, 15, 74–81. 10.1111/j.1553-2712.2007.00009.x. [DOI] [PubMed] [Google Scholar]
- Hashmi A.; Sodhi R. N. S.; Kishen A. Interfacial Characterization of Dentin Conditioned with Chitosan Hydroxyapatite Precursor Nanocomplexes Using Time-of-flight Secondary Ion Mass Spectrometry. J. Endod. 2019, 45, 1513–1521. 10.1016/j.joen.2019.08.011. [DOI] [PubMed] [Google Scholar]
- Reilly T.Characterization of In Vitro Generated Autologous Osteoid Tissue. Ph.D. Thesis, University of Otago, New Zealand, 2015. [Google Scholar]
- Fogh J.; Fogh J. M.; Orfeo T. One Hundred and Twenty-Seven Cultured Human Tumor Cell Lines Producing Tumors in Nude Mice23. J. Natl. Cancer Inst. 1977, 59, 221–226. 10.1093/jnci/59.1.221. [DOI] [PubMed] [Google Scholar]
- Fassina L.; Visai L.; Benazzo F.; Benedetti L.; Calligaro A.; De Angelis M. G. C.; Maliardi V.; Magenes G. Effects of electromagnetic stimulation on calcified matrix production by SAOS-2 cells over a polyurethane porous scaffold. Tissue Eng. 2006, 12, 1985–1999. 10.1089/ten.2006.12.1985. [DOI] [PubMed] [Google Scholar]
- Tripathi G.; Basu B. A porous hydroxyapatite scaffold for bone tissue engineering: Physico-mechanical and biological evaluations. Ceram. Int. 2012, 38, 341–349. 10.1016/j.ceramint.2011.07.012. [DOI] [Google Scholar]
- Wiens M.; Wang X.; Schloßmacher U.; Lieberwirth I.; Glasser G.; Ushijima H.; Schröder H. C.; Müller W. E. G. Osteogenic Potential of Biosilica on Human Osteoblast-Like (SaOS-2) Cells. Calcif. Tissue Int. 2010, 87, 513–524. 10.1007/s00223-010-9408-6. [DOI] [PubMed] [Google Scholar]
- Ratnayake J. T.; Ross E. D.; Dias G. J.; Shanafelt K. M.; Taylor S. S.; Gould M. L.; Guan G.; Cathro P. R. Preparation, characterisation and in-vitro biocompatibility study of a bone graft developed from waste bovine teeth for bone regeneration. Mater. Today Commun. 2019, 22, 100732. 10.1016/j.mtcomm.2019.100732. [DOI] [Google Scholar]
- Rodan S. B.; Imai Y.; Thiede M. A.; Wesolowski G.; Thompson D.; Bar-Shavit Z.; Shull S.; Mann K.; Rodan G. A. Characterization of a Human Osteosarcoma Cell Line (Saos-2) with Osteoblastic Properties. Cancer Res. 1987, 47, 4961–4966. [PubMed] [Google Scholar]
- Harley B. A. C.; Kim H.-D.; Zaman M. H.; Yannas I. V.; Lauffenburger D. A.; Gibson L. J. Microarchitecture of Three-Dimensional Scaffolds Influences Cell Migration Behavior via Junction Interactions. Biophys. J. 2008, 95, 4013–4024. 10.1529/biophysj.107.122598. [DOI] [PMC free article] [PubMed] [Google Scholar]
- Pecci R.; Baiguera S.; Ioppolo P.; Bedini R.; Del Gaudio C. 3D printed scaffolds with random microarchitecture for bone tissue engineering applications: Manufacturing and characterization. J. Mech. Behav. Biomed. Mater. 2020, 103, 103583. 10.1016/j.jmbbm.2019.103583. [DOI] [PubMed] [Google Scholar]
- Berretta J.; Bumgardner J. D.; Jennings J. A.. Lyophilized chitosan sponges. In Chitosan Based Biomaterials Volume 1; Jennings J. A., Bumgardner J. D., Eds.; Woodhead Publishing, 2017; Chapter 10, pp 239–253. [Google Scholar]
- Asadpour S.; Kargozar S.; Moradi L.; Ai A.; Nosrati H.; Ai J. Natural biomacromolecule based composite scaffolds from silk fibroin, gelatin and chitosan toward tissue engineering applications. Int. J. Biol. Macromol. 2020, 154, 1285. 10.1016/j.ijbiomac.2019.11.003. [DOI] [PubMed] [Google Scholar]
- Felfel R. M.; Gideon-Adeniyi M. J.; Zakir Hossain K. M.; Roberts G. A. F.; Grant D. M. Structural, mechanical and swelling characteristics of 3D scaffolds from chitosan-agarose blends. Carbohydr. Polym. 2019, 204, 59–67. 10.1016/j.carbpol.2018.10.002. [DOI] [PubMed] [Google Scholar]
- Loh Q. L.; Choong C. Three-Dimensional Scaffolds for Tissue Engineering Applications: Role of Porosity and Pore Size. Tissue Eng., Part B 2013, 19, 485–502. 10.1089/ten.teb.2012.0437. [DOI] [PMC free article] [PubMed] [Google Scholar]
- Chandrasekaran S.; Ramanathan S.; Basak T. Microwave food processing-A review. Food Res. Int. 2013, 52, 243–261. 10.1016/j.foodres.2013.02.033. [DOI] [Google Scholar]
- Nastić N.; Švarc-Gajić J.; Delerue-Matos C.; Barroso M. F.; Soares C.; Moreira M. M.; Morais S.; Mašković P.; Gaurina Srček V.; Slivac I.; Radošević K.; Radojković M. Subcritical water extraction as an environmentally-friendly technique to recover bioactive compounds from traditional Serbian medicinal plants. Ind. Crops Prod. 2018, 111, 579–589. 10.1016/j.indcrop.2017.11.015. [DOI] [Google Scholar]
- Barakat N. A. M.; Khil M. S.; Omran A. M.; Sheikh F. A.; Kim H. Y. Extraction of pure natural hydroxyapatite from the bovine bones bio waste by three different methods. J. Mater. Process. Technol. 2009, 209, 3408–3415. 10.1016/j.jmatprotec.2008.07.040. [DOI] [Google Scholar]
- Shavandi A.; Bekhit A. E.-D. A.; Sun Z.; Ali M. A. Bio-scaffolds produced from irradiated squid pen and crab chitosan with hydroxyapatite/β-tricalcium phosphate for bone-tissue engineering. Int. J. Biol. Macromol. 2016, 93, 1446–1456. 10.1016/j.ijbiomac.2016.04.046. [DOI] [PubMed] [Google Scholar]
- Nikpour M. R.; Rabiee S. M.; Jahanshahi M. Synthesis and characterization of hydroxyapatite/chitosan nanocomposite materials for medical engineering applications. Composites, Part B 2012, 43, 1881–1886. 10.1016/j.compositesb.2012.01.056. [DOI] [Google Scholar]
- Kong L.; Gao Y.; Cao W.; Gong Y.; Zhao N.; Zhang X. Preparation and characterization of nano-hydroxyapatite/chitosan composite scaffolds. J. Biomed. Mater. Res., Part A 2005, 75A, 275–282. 10.1002/jbm.a.30414. [DOI] [PubMed] [Google Scholar]
- Karageorgiou V.; Kaplan D. Porosity of 3D biomaterial scaffolds and osteogenesis. Biomaterials 2005, 26, 5474–5491. 10.1016/j.biomaterials.2005.02.002. [DOI] [PubMed] [Google Scholar]
- Rho J. Y.; Hobatho M. C.; Ashman R. B. Relations of mechanical properties to density and CT numbers in human bone. Med. Eng. Phys. 1995, 17, 347–355. 10.1016/1350-4533(95)97314-f. [DOI] [PubMed] [Google Scholar]
- Renders G. A. P.; Mulder L.; Van Ruijven L. J.; Van Eijden T. M. G. J. Porosity of human mandibular condylar bone. J. Anat. 2007, 210, 239–248. 10.1111/j.1469-7580.2007.00693.x. [DOI] [PMC free article] [PubMed] [Google Scholar]
- Liuyun J.; Yubao L.; Chengdong X. Preparation and biological properties of a novel composite scaffold of nano-hydroxyapatite/chitosan/carboxymethyl cellulose for bone tissue engineering. J. Biomed. Sci. 2009, 16, 65. 10.1186/1423-0127-16-65. [DOI] [PMC free article] [PubMed] [Google Scholar]
- Lodish H.; Berk A.; Kaiser C. A.; Krieger M.; Scott M. P.; Bretscher A.; Ploegh H.; Matsudaira P.. Molecular Cell Biology: Macmillan, 2008. [Google Scholar]
- Oliveira J. M.; Rodrigues M. T.; Silva S. S.; Malafaya P. B.; Gomes M. E.; Viegas C. A.; Dias I. R.; Azevedo J. T.; Mano J. F.; Reis R. L. Novel hydroxyapatite/chitosan bilayered scaffold for osteochondral tissue-engineering applications: Scaffold design and its performance when seeded with goat bone marrow stromal cells. Biomaterials 2006, 27, 6123–6137. 10.1016/j.biomaterials.2006.07.034. [DOI] [PubMed] [Google Scholar]
- Si J.; Yang Y.; Xing X.; Yang F.; Shan P. Controlled degradable chitosan/collagen composite scaffolds for application in nerve tissue regeneration. Polym. Degrad. Stab. 2019, 166, 73–85. 10.1016/j.polymdegradstab.2019.05.023. [DOI] [Google Scholar]
- Radhika Rajasree S. R.; Gobalakrishnan M.; Aranganathan L.; Karthih M. G. Fabrication and characterization of chitosan based collagen/ gelatin composite scaffolds from big eye snapper Priacanthus hamrur skin for antimicrobial and anti oxidant applications. Mater. Sci. Eng. C 2020, 107, 110270. 10.1016/j.msec.2019.110270. [DOI] [PubMed] [Google Scholar]
- Paulino A. T.; Simionato J. I.; Garcia J. C.; Nozaki J. Characterization of chitosan and chitin produced from silkworm crysalides. Carbohydr. Polym. 2006, 64, 98–103. 10.1016/j.carbpol.2005.10.032. [DOI] [Google Scholar]
- Reilly T.Characterization Of In Vitro Generated Autologous Osteoid Tissue. Ph.D Thesis, University of Otago, 2016. [Google Scholar]
- Zhang J.; Zhou A.; Deng A.; Yang Y.; Gao L.; Zhong Z.; Yang S. Pore architecture and cell viability on freeze dried 3D recombinant human collagen-peptide (RHC)-chitosan scaffolds. Mater. Sci. Eng. C 2015, 49, 174–182. 10.1016/j.msec.2014.12.076. [DOI] [PubMed] [Google Scholar]
- Deville S.; Saiz E.; Tomsia A. P. Freeze casting of hydroxyapatite scaffolds for bone tissue engineering. Biomaterials 2006, 27, 5480–5489. 10.1016/j.biomaterials.2006.06.028. [DOI] [PubMed] [Google Scholar]
- Kim M. Y.; Lee J. Chitosan fibrous 3D networks prepared by freeze drying. Carbohydr. Polym. 2011, 84, 1329–1336. 10.1016/j.carbpol.2011.01.029. [DOI] [Google Scholar]
- Murphy C. M.; Haugh M. G.; O’Brien F. J. The effect of mean pore size on cell attachment, proliferation and migration in collagen-glycosaminoglycan scaffolds for bone tissue engineering. Biomaterials 2010, 31, 461–466. 10.1016/j.biomaterials.2009.09.063. [DOI] [PubMed] [Google Scholar]
- Saravanan S.; Leena R. S.; Selvamurugan N. Chitosan based biocomposite scaffolds for bone tissue engineering. Int. J. Biol. Macromol. 2016, 93, 1354–1365. 10.1016/j.ijbiomac.2016.01.112. [DOI] [PubMed] [Google Scholar]
- Usala R. L.; Verbalis J. G. Disorders of water and sodium homeostasis and bone. Curr. Opin. Endocr. Metab. Res. 2018, 3, 83–92. 10.1016/j.coemr.2018.06.001. [DOI] [Google Scholar]
- Sunny M. C.; Ramesh P.; Varma H. K. Microstructured microspheres of hydroxyapatite bioceramic. J. Mater. Sci.: Mater. Med. 2002, 13, 623–632. 10.1023/a:1015709705074. [DOI] [PubMed] [Google Scholar]
- Chen P.; Liu L.; Pan J.; Mei J.; Li C.; Zheng Y. Biomimetic composite scaffold of hydroxyapatite/gelatin-chitosan core-shell nanofibers for bone tissue engineering. Mater. Sci. Eng. C 2019, 97, 325–335. 10.1016/j.msec.2018.12.027. [DOI] [PubMed] [Google Scholar]
- O’Brien F. J.; Harley B. A.; Yannas I. V.; Gibson L. J. The effect of pore size on cell adhesion in collagen-GAG scaffolds. Biomaterials 2005, 26, 433–441. 10.1016/j.biomaterials.2004.02.052. [DOI] [PubMed] [Google Scholar]
- Moreau J. L.; Xu H. H. K. Mesenchymal stem cell proliferation and differentiation on an injectable calcium phosphate - Chitosan composite scaffold. Biomaterials 2009, 30, 2675–2682. 10.1016/j.biomaterials.2009.01.022. [DOI] [PMC free article] [PubMed] [Google Scholar]
- Xu H. H. K.; Simon C. G. Fast setting calcium phosphate-chitosan scaffold: mechanical properties and biocompatibility. Biomaterials 2005, 26, 1337–1348. 10.1016/j.biomaterials.2004.04.043. [DOI] [PubMed] [Google Scholar]
- Trakoolwannachai V.; Kheolamai P.; Ummartyotin S. Development of hydroxyapatite from eggshell waste and a chitosan-based composite: In vitro behavior of human osteoblast-like cell (Saos-2) cultures. Int. J. Biol. Macromol. 2019, 134, 557–564. 10.1016/j.ijbiomac.2019.05.004. [DOI] [PubMed] [Google Scholar]
- Jasim D. A.; Lozano N.; Bussy C.; Barbolina I.; Rodrigues A. F.; Novoselov K. S.; Kostarelos K. Graphene-based papers as substrates for cell growth: Characterisation and impact on mammalian cells. FlatChem 2018, 12, 17–25. 10.1016/j.flatc.2018.11.006. [DOI] [Google Scholar]