

Abstract
Coal floatability evaluation is of vital importance in the prediction of flotation results and the design of a flotation flowsheet. In this work, a new experimental approach based on bubble–particle attachment kinetics (BPAK) and bubble–particle detachment kinetics (BPDK) were proposed to evaluate the floatability of coal particles. During attachment and detachment processes, a variation of coating angles θ(t) for different density coal particles were measured and fitted to a first-order model. Modified attachment rate constant ka* and modified detachment rate constant kd were used as yardsticks of floatability. For comparison, flotation kinetics, induction time, and contact angle measurements were also conducted. A consistent sequence of floatability was obtained as: −1.4 > 1.4–1.6 > +1.6 g/cm3. The modified flotation rate constant k* obtained in flotation kinetics was used as a yardstick to assess the accuracy of floatability evaluation methods. By individually fitting k* to parameters obtained in other tests, a simple and close linear relationship between k* and modified attachment rate constant ka* was established, rather than 1/kd in BPDK tests, induction time tind, or (1 – cosα) in contact angle measurements. Consequently, ka* is thought to be a better criterion as k* could be quantitatively predicted by BPAK tests. Throughout this work, BPAK is an effective method to evaluate coal floatability.
1. Introduction
Coal floatability is an overall reflection of properties influenced by many factors, such as the metamorphic grade, surface oxidation, impurity composition, particle size, and so on.1,2 The floatability of coal is directly related to the operation quality of the flotation process. An accurate evaluation of coal floatability is beneficial to the prediction of flotation results, which can be a reference for the design of a flowsheet.
Various procedures for coal floatability evaluation have been available for quite some time.3 Most of these methods are based on the results of the laboratory flotation test. In release analysis4,5 and tree analysis6,7 procedures, multistage flotation with cleaner or scavenger steps are conducted in a laboratory batch cell. The coal samples are properly fractionated according to grade; a yield–ash curve could be constructed to characterize flotation performance. The main disadvantage is that they are time consuming and rather tedious. Based on Zisman’s concept of critical surface tension, Hornsby and Leja8 developed small-scale frothless flotation tests in methanol solutions with different surface tensions to collect various products of varying floatabilities by which a cumulative yield versus cumulative ash data of floats and rejects were obtained. Dobiáš9 used a modified Hallimond tube to study the mineral floatability from kinetic data. This technique is simple, reproducible, and well accepted. Since the flotation is a time–rate recovery process, flotation kinetics tests were conducted to establish a model that incorporates both a recovery and a rate function.10−12 The higher the flotation rate and combustible recovery is, the better the coal floatability. The advantage of this procedure is that it is easy to gain the variation of coal floatability in the flotation process.
Besides the flotation procedures, testing techniques have also been used to characterize mineral floatability.13,14 Sun13 proposed a surface component hypothesis and derived an equation to calculate the floatability index using the results of an elemental analysis. However, it is quite difficult to conduct such complete chemical analyses. Another drawback is that since the analysis is based on the bulk sample, the influence of surface oxidation on floatability is not considered, leading to invalid results. Contact angle measurements14 are widely used for testing the hydrophobicity of minerals. Minerals with high contact angles have a high affinity for bubbles, indicating a good floatability. For this reason, the contact angle is considered to be a simple and important tool for flotation research. However, a quantitative relationship between the contact angle and flotation results has not been established yet.
Recently, induction time measurements have been widely used to assess coal floatability.15−17 A shorter induction time corresponds to a better floatability. Although an exponential decay relationship between the microflotation rate and back-calculated induction time was established in a reported work;18 it is still a great challenge to quantitatively link the flotation rate with experimentally measured induction time. The bubble deformation and the loose state of the particle bed during the measurement can affect the accuracy of the test results. Atomic force microscopy (AFM)19,20 can also define floatability by measuring the interaction force between a bubble and a particle. Only a small amount of the sample is needed in the AFM force tests.
The objective of this paper is to propose a new approach for floatability evaluation based on bubble–particle attachment kinetics (BPAK) and bubble–particle detachment kinetics (BPDK) tests. Compared to the above tests, this method takes into account the dynamic characteristics of the flotation process, and it allows for fast experiments with low sample consumption. In this method, the coating angle as a function of time in attachment and detachment processes were measured and fitted to a first-order model. For comparison, flotation tests, contact angle measurements, and induction time measurements were also carried out on coal samples with different densities. Parameters obtained in these methods were listed and compared to figure out which approach best approximates the flotation response.
2. Results and Discussion
2.1. Flotation Kinetics Results
Figure 1 gives the cumulative combustible recovery of various density fractions versus flotation time. It is obvious that the recovery of the three coal samples decreased in the following order: −1.4, 1.4–1.6, and +1.6 g/cm3. The flotation test data were fitted to the first-order rate equation using a nonlinear regression:12,21
| 1 |
Figure 1.
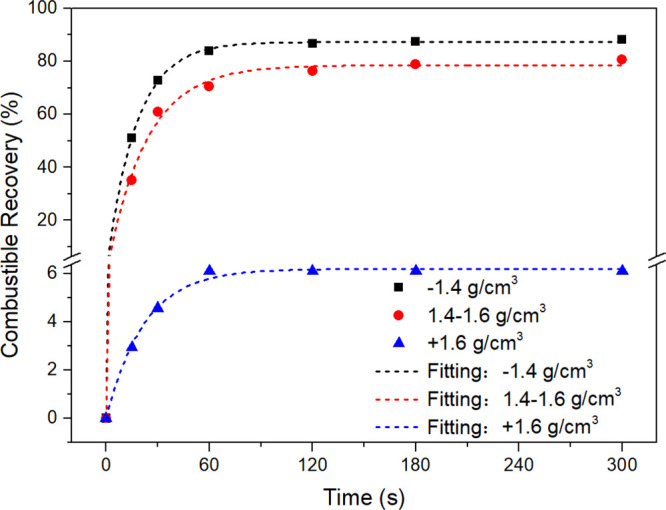
Combustible recovery as a function of time for different density coal particles.
The fitting parameters, including the ultimate combustible recovery (Rmax), flotation rate constant (k), and correlation coefficient (R2) are respectively shown in Table 1. Evaluating the floatability of coal by either Rmax or k alone can sometimes be misleading. The modified flotation rate constant introduced by Xu,12 expressed as k* = Rmax × k, is considered to be a good assessment of floatability. The values of k* for three density fractions were calculated and are presented in Table 1. The −1.4 g/cm3 particles appeared to have the highest k* followed by 1.4–1.6 and + 1.6 g/cm3 particles. This indicates that the floatability of coal particles is ranged as: −1.4 > 1.4–1.6 > +1.6 g/cm3.
Table 1. Fitting Results of Flotation Kinetics Tests with the First-Order Model.
| density fractions (g/cm3) | –1.4 | 1.4–1.6 | +1.6 |
|---|---|---|---|
| flotation kinetics | |||
| Rmax | 87.32 | 78.59 | 6.20 |
| k | 0.059 | 0.043 | 0.045 |
| R2 | 0.9996 | 0.9927 | 0.9950 |
| k* = Rmax × k | 5.139 | 3.417 | 0.281 |
2.2. Induction Time Results
Figure 2 is a plot of the attachment probability against contact time for coal particles with different densities. It is evident that the attachment probability increased with increasing contact time. Induction time tind was defined as the contact time that resulted in 50% of attachment probability. The induction time of −1.4 and 1.4–1.6 g/cm3 particles were 8.34 and 11.25 ms, respectively, while the induction time of +1.6 g/cm3 particles could not be obtained due to the extremely poor floatability, indicating a decreasing floatability with the increase of coal density, which was qualitatively consistent with the results of flotation experiments. However, a quantitative relationship between the induction time and flotation rate constant cannot be established as the induction time of +1.6 g/cm3 particles does not exist.
Figure 2.
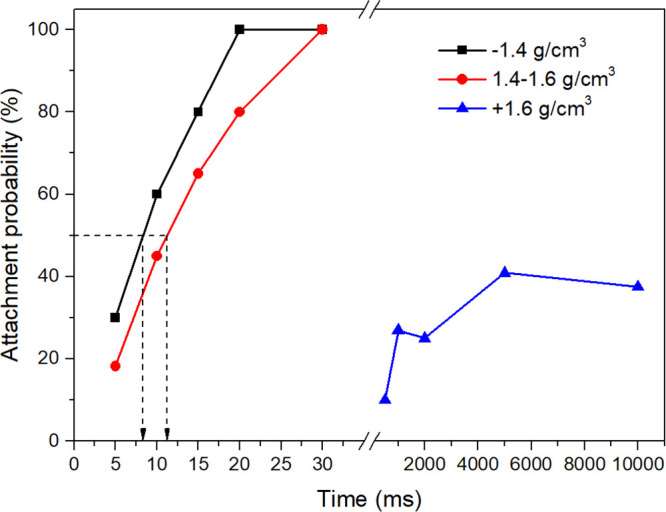
Induction time of coal particles with different densities.
2.3. Contact Angle Results
The contact angles of three density fractions were 64.5, 64.0, and 29.9°, respectively. A hydrophobicity index (1 – cosα), was proposed and calculated in this work to evaluate the floatability of coal particles based on the work of the adhesion equation: WSG = γSG(1 – cosα). The greater the (1 – cosα) is, the greater the work of adhesion between the particle and the bubble.21 Corresponding to the contact angle, the value of (1 – cosα) for the −1.4 and 1.4–1.6 g/cm3 particles were almost the same (0.5695 and 0.5616, respectively), quite higher than that of +1.6 g/cm3 particles (0.1331). The relationship between (1 – cosα) and k* were presented in Figure 3. Obviously, (1 – cosα) showed poor correlation with k*. Thus, evaluating the floatability by contact angle measurements is not very accurate. This is because the hydrophobicity expressed as contact angle is a thermodynamic characteristic, while floatability is a kinetic characteristic.22
Figure 3.
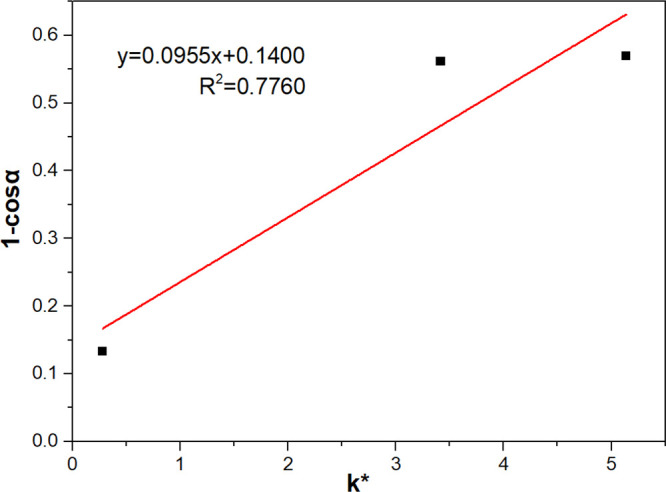
Hydrophobicity index (1 – cosα) versus modified flotation rate constant (k*) for coal particles.
2.4. BPAK Results
During the attachment process, the coating angle as a function of time for different density coal samples is shown in Figure 4. For all density fractions, the coating angle increased with increasing the attachment time. The bubbles had already been fully coated by particles at 75 s, reaching the maximum coating angle of ∼65° for −1.4 and 1.4–1.6 g/cm3 density fractions. For +1.6 g/cm3 coal particles, the attachment kinetics was much slower, only 36° at 300 s. The maximum coating angle θmax and attachment rate constant ka were extracted by fitting the experimental data with the first-order kinetics model (eq. 2) and are presented in Table 2.
| 2 |
Figure 4.
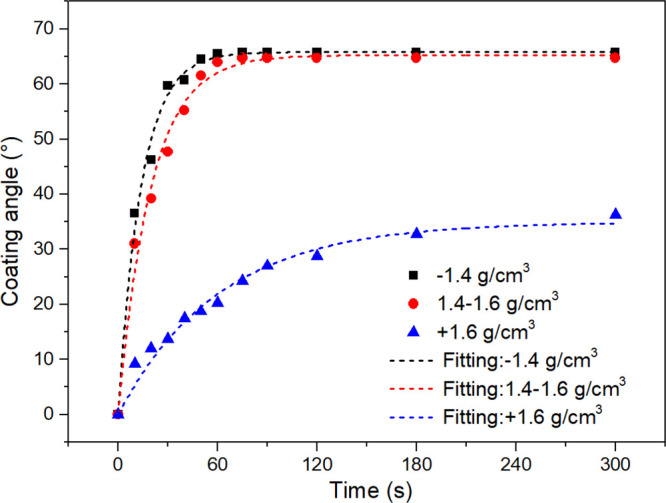
Coating angle as a function of time for different density coal particles in BPAK tests.
Table 2. Fitting Results of BPAK and BPDK Tests with the First-Order Model.
| density fractions (g/cm3) | –1.4 | 1.4–1.6 | +1.6 |
|---|---|---|---|
| attachment kinetics | |||
| θmax | 65.82 | 65.24 | 34.95 |
| ka | 0.071 | 0.050 | 0.016 |
| R2 | 0.9928 | 0.9873 | 0.9733 |
| ka* = θmax × ka | 4.673 | 3.262 | 0.559 |
| detachment kinetics | |||
| θmax′ | 47.63 | 54.94 | 30.24 |
| kd | 0.087 | 0.143 | 1.124 |
| R2 | 0.9695 | 0.9895 | 0.9571 |
| kd* = θmax × kd | 4.150 | 7.881 | 34.004 |
To take both θmax and ka into account, a modified attachment rate constant ka* was defined as ka = θmax × ka. High ka* represents good floatability. The ka values of coal particles with different densities were compared and exhibited the following order: ka, – 1.4* > ka,1.4 – 1.6 > ka, + 1.6*. From the aspect of attachment kinetics, the sequence of floatability was −1.4 > 1.4–1.6 > +1.6 g/cm3, which showed great agreement with flotation kinetics tests.
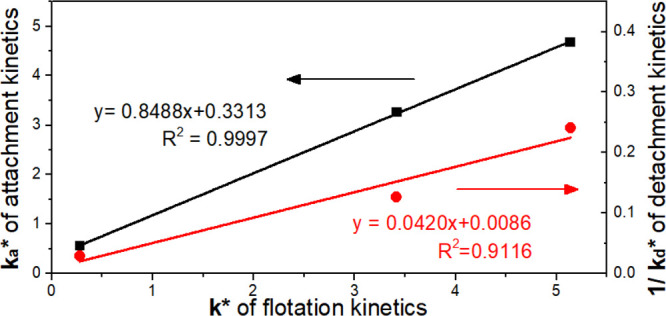
To establish a relationship between BPAK tests and flotation response, the results showing the relationship between ka* and k* are presented in Figure 5. ka showed a significant positive correlation with k*. The R2 value was greater than 0.999, demonstrating that the linear equation has good fitness to the data. Given this close linear correlation between ka* and k*, flotation kinetics can be predicted by testing attachment kinetics in turn. Compared to induction time and contact angle measurements, BPAK simulates the conditions in conventional flotation cells.
Figure 5.
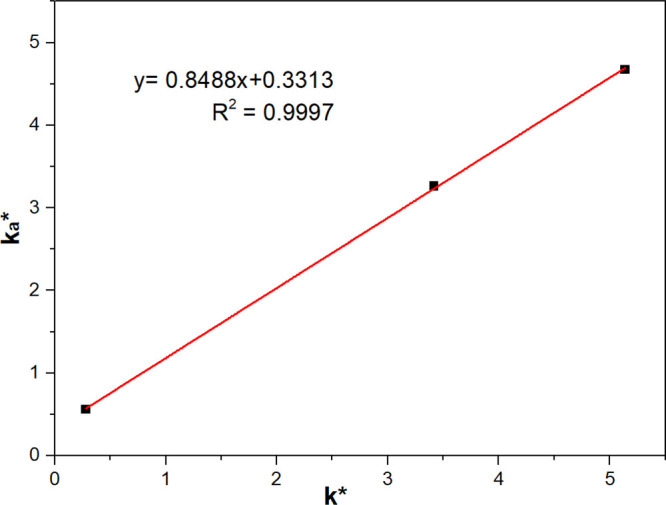
Modified attachment rate constant (ka*) versus modified flotation rate constant (k*) for coal particles.
2.5. BPDK Results
The variations of coating angles in the detachment process with time are shown in Figure 6. Obviously, the coating angle decreased gradually as the detachment proceeded, reaching a minimum in the end. For −1.4 g/cm3 coal particles, the coating angle θ decreased from 65 to 18° after 60 s of vibration, while the minimum value of θ for the 1.4–1.6 and + 1.6 g/cm3 particles are only 10 and 8°, respectively. A first-order exponential decay equation was employed to describe the bubble–particle detachment kinetics:
| 3 |
where θ0 is the initial coating angle, θmin is the minimum coating angle remained after vibration, and kd is the detachment rate constant. By defining the decrement of coating angle as θ′ = θ0 – θ(t), the equation can be transferred to eq 4.
| 4 |
Figure 6.
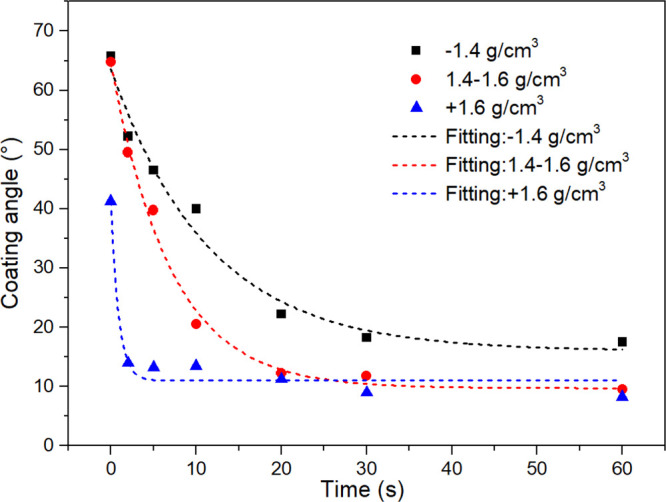
Coating angle as a function of time for different density coal particles in BPDK tests.
As seen from the fitting results shown in Table 2, the +1.6 g/cm3 particles exhibited the highest kd and the lowest θmax′. In this case, a comparison of the floatability of coals by only θmax or kd may draw incorrect conclusions. Similar to BPAK tests, the modified detachment rate constant kd* is defined as the result of multiplying kd and θmax, kd* = θmax × kd. Low kd* means that it is difficult for particles to detach from the bubbles, i.e., good floatability. A sequence of floatability was obtained by comparing the kd of different density particles: −1.4 > 1.4–1.6 > +1.6 g/cm3, which is consistent with the flotation kinetics tests results.
The inverse of the modified detachment rate constant, 1/kd*, was used for linear fitting with the k* (Figure 7). A low R2 value implies that the detachment kinetics is not well correlated with the flotation kinetics. A possible explanation for this may be as follows: In BPDK tests, the actuator drives the bubble–particle aggregate up and down. In this case, the detaching force due to vibration is approximately regarded as the tensile force (normal direction). While in flotation kinetics tests, the stresses due to tensile (normal direction) and shear forces (tangential direction) are both responsible for the bubble–particle detachment; the latter was not took into consideration in BPDK tests. Consequently, the ka obtained in BPAK tests is considered to be a better criterion for floatability than 1/kd* obtained in BPDK tests.
Figure 7.
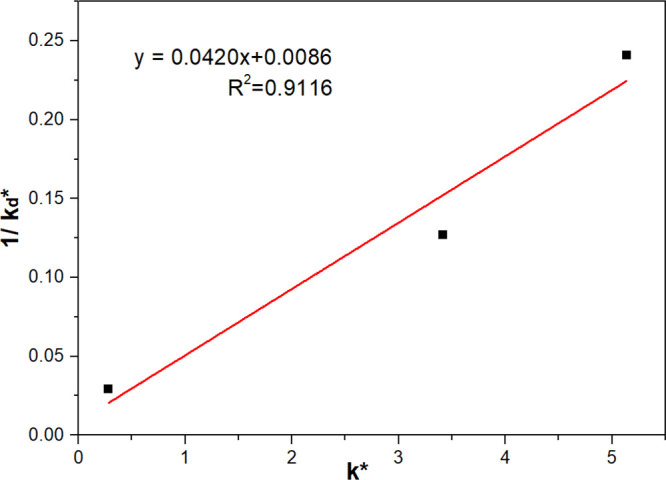
Inverse of the modified detachment rate constant (1/kd*) versus modified flotation rate constant (k*) for coal particles.
Results also showed that the ka* was negatively correlated with kd, as expected. The reason may be as follows: The ka* reflects the dynamics of the bubble–particle attachment process, which is dominated by surface forces. Among them, the hydrophobic force is the fundamental driving force for bubble–particle attachment, with its strength positively correlated with the particle contact angle. The greater the contact angle, the greater the hydrophobic force promoting the attachment. Correspondingly, the kd reflects the dynamic of the bubble–particle detachment process. According to the force analysis on the three-contact perimeter, detachment occurs when the detaching force exceeds the adhesive force. The adhesive force is positively related to the contact angle. The greater the contact angle is, the greater the adhesive force hindering the detachment.
3. Conclusions
A new approach based on bubble–particle attachment kinetics and detachment kinetics tests were carried out to evaluate the floatability of coal particles with different densities. A sequence of floatability was obtained as: −1.4 > 1.4–1.6 > +1.6 g/cm3, which was consistent with flotation kinetics, contact angle, and induction time tests.
The k* obtained in flotation kinetics was used as a yardstick to assess the accuracy of floatability evaluation methods. By individually fitting k* to indexes obtained in other tests, k* was found to follow a closer linear relationship with ka* rather than 1/kd and then (1 – cosα), so that k* could be quantitatively predicted by ka* obtained in BPAK tests. Consequently, the modified attachment rate constant ka is thought to be a good criterion for floatability evaluation.
The BPAK tests provide dynamic characteristic of the flotation process at the bubble–particle scale, offering a new sight into the evaluation of floatability. The applicability of this technique to different types of coal and minerals needs to be expanded in the future work.
4. Experimental Section
4.1. Material and Sample Preparation
Anthracite coal samples obtained from the Xuehu coal preparation plant (Henan Province, China) were crushed using a laboratory roll crusher. A size fraction of 0.2–0.4 mm was collected by a wet screening process. A float–sink test was carried out to divide these 0.2–0.4 mm samples into three density fractions: −1.4, 1.4–1.6, and +1.6 g/cm3. The ash contents of these samples were analyzed to be 7.81, 28.71, and 85.25%, respectively. All these experiments were conducted at a room temperature of 20 °C.
4.2. Methods
4.2.1. BPAK
A bubble–particle attachment and detachment test system was set up and shown in Figure 8. For BPAK tests, 4 g of coal particles were placed in a square container containing 200 mL deionized water. A magnetic stirrer at 1000 rpm was used to mix and disperse the pulp completely. To make the pulp clear enough for photography, the upper turbid pulp was poured out carefully after 1 min sedimentation, and then fresh water was added. For each test, an air bubble of 3 mm in diameter was formed at the end of the capillary tube using a syringe, 4 cm below the liquid level. The suspension was agitated at a speed of 250 rpm. The bubble images were captured after 10, 20, 30, 40, 50, 60, 75, 90, 120, 180, and 300 s. The coating angle θ is defined as the average coverage angle of the particles on the bubble.23
Figure 8.
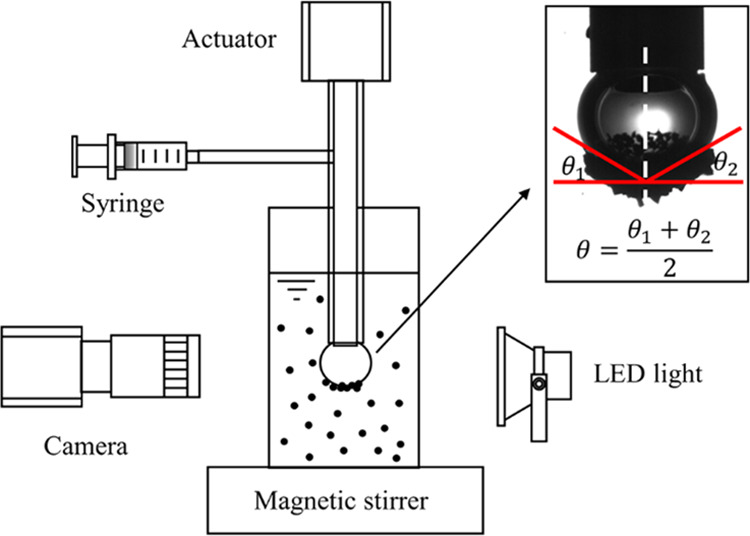
Schematic of the bubble–particle attachment and detachment test system.
4.2.2. BPDK
Detachment tests were carried out to study the detachment kinetics of the bubble–particle aggregate. In this work, a square wave generated by the oscillator with an amplitude of 1.0 mm, a frequency of 10 Hz, and a duty ratio of 10% is selected. At the beginning of the test, a bubble–particle aggregate with a maximum attachment angle was obtained as the initial angle θ0. Then, the magnetic stirrer was turned off. During the vibration operation, particles detached from the bubble, and a time series analysis of coating angle θ were conducted with the help of a digital camera and imaging software.
4.2.3. Flotation Kinetics
Flotation kinetics tests were conducted on a laboratory flotation machine of 0.5 L capacity. The impeller speed and pulp density were kept constant at 1800 rpm and 60 g/L, respectively. An adequate dosage of frother (sec-octyl alcohol), 200 g/t, was chosen to generate enough bubbles for the flotation of coal particles. No collector is added to keep unanimous with other tests. During the flotation process, six concentrates were collected at 15, 30, 60, 120, 180, and 300 s and placed into separate containers. All the flotation product samples were individually filtered, dried, and weighed to obtain their yields and ash contents. The combustible recovery was calculated using the formula as follows:
| 5 |
where γi is the yield of products and Ai and Af refer to the ash content of the products and feed for flotation, respectively.
4.2.4. Induction Time
Induction time measurements were also conducted on the test system in Figure 1. A thin monolayer of coal particles (1.0 g) were placed in a shallow cell containing 10 mL deionized water. Inside the cell, a bubble with 3 mm diameter was produced at the end of the capillary tube using a syringe and then was moved to the initial position of 0.15 mm above the particle bed. The travel distance of the actuator was 0.5 mm. The bubble was brought into contact with the particles for different preset time and a camera was used to check whether the attachment occurred. Each measurement was repeated for 20 times.
4.2.5. Contact Angle
Contact angle measurements were conducted on a drop shape analyzer (DSA100, KRUSS, Germany) using the pendant droplet method. Coal samples were ground to −0.074 mm and pressed into a plate. This plate was then placed on the platform and controlled to contact with a pendant droplet. Images were recorded and analyzed to determine the water contact angle α. Each sample was tested five times.
Acknowledgments
This work was supported by the National Key R&D Program of China (2018YFC0604702), Jiangsu Province Science Fund for Distinguished Young Scholars (BK20180032), National Nature Science Foundation of China (grant nos. 51922106, 21978318, 51904300, 51774286, and 51920105007), China Postdoctoral Science Foundation funded project (2018 M642369, 2019 T120482), Jiangsu Natural Science Fund-Youth Fund (BK20190639), and Young Elite Scientists Sponsorship Program by CAST (2018QNRC001).
Author Contributions
§ L.S. and Y.X. contributed equally to this work.
The authors declare no competing financial interest.
References
- Cebeci Y. The investigation of the floatability improvement of Yozgat Ayrıdam lignite using various collectors. Fuel 2002, 81, 281–289. 10.1016/S0016-2361(01)00165-X. [DOI] [Google Scholar]
- Xia Y.; Zhang R.; Cao Y.; Xing Y.; Gui X. Role of molecular simulation in understanding the mechanism of low-rank coal flotation: A review. Fuel 2020, 262, 116535. 10.1016/j.fuel.2019.116535. [DOI] [Google Scholar]
- Randolph J. M., Jr.Characterizing flotation response: a theoretical and experimental comparison of techniques. Virginia Tech, 1997. [Google Scholar]
- Dell C. Determination of froth-flotation washability data. J. Inst. Fuel 1957, 30, 523–526. [Google Scholar]
- Dell C. C. An improved release analysis procedure for determining coal washability. J. Inst. Fuel 1964, 37, 149–150. [Google Scholar]
- Nicol S.; Bensley C.; Teh K.; Firth B.. The estimation of coal flotation response. In Proc. Congr. Improving Froth Flotation of Coal; Australian Coal Industry Research Laboratories: 1983; pp 116–134. [Google Scholar]
- Pratten S. J.; Bensley C. N.; Nicol S. K. An evaluation of the flotation response of coals. Int. J. Miner. Process. 1989, 27, 243–262. 10.1016/0301-7516(89)90067-7. [DOI] [Google Scholar]
- Hornsby D. T.; Leja J. A technique for evaluating floatability of coal fines, using methanol solutions. Coal Prep. 1984, 1, 1–19. 10.1080/07349348408945536. [DOI] [Google Scholar]
- Dobiáš B. Modified Hallimond tube for the study of the flotability and flotation kinetics of minerals. Colloid Polym. Sci. 1981, 259, 775–776. 10.1007/BF01419327. [DOI] [Google Scholar]
- Yuan X.-M.; Palsson B. I.; Forssberg K. S. E. Statistical interpretation of flotation kinetics for a complex sulphide ore. Miner. Eng. 1996, 9, 429–442. 10.1016/0892-6875(96)00028-3. [DOI] [Google Scholar]
- Zhang H.; Liu J.; Cao Y.; Wang Y. Effects of particle size on lignite reverse flotation kinetics in the presence of sodium chloride. Powder Technol. 2013, 246, 658–663. 10.1016/j.powtec.2013.06.033. [DOI] [Google Scholar]
- Xu M. Modified flotation rate constant and selectivity index. Miner. Eng. 1998, 11, 271–278. 10.1016/S0892-6875(98)00005-3. [DOI] [Google Scholar]
- Sun S.-C. Hypothesis for different floatabilities of coals, carbons and hydrocarbon minerals. Trans. AIME 1954, 199, 67–75. [Google Scholar]
- Chau T. T. A review of techniques for measurement of contact angles and their applicability on mineral surfaces. Miner. Eng. 2009, 22, 213–219. 10.1016/j.mineng.2008.07.009. [DOI] [Google Scholar]
- Yoon R.-H.; Yordan J. L. Induction time measurements for the quartz—amine flotation system. J. Colloid Interface Sci. 1991, 141, 374–383. 10.1016/0021-9797(91)90333-4. [DOI] [Google Scholar]
- Peng F. F. Surface energy and induction time of fine coals treated with various levels of dispersed collector and their correlation to flotation responses. Energy Fuels 1996, 10, 1202–1207. 10.1021/ef950076u. [DOI] [Google Scholar]
- Xing Y.; Zhang Y.; Liu M.; Xu M.; Guo F.; Han H.; Gao Z.; Cao Y.; Gui X. Improving the floatability of coal with varying surface roughness through hypobaric treatment. Powder Technol. 2019, 345, 643–648. 10.1016/j.powtec.2019.01.058. [DOI] [Google Scholar]
- Min M. A.; Nguyen A. V. An exponential decay relationship between micro-flotation rate and back-calculated induction time for potential flow and mobile bubble surface. Miner. Eng. 2013, 40, 67–80. 10.1016/j.mineng.2012.09.017. [DOI] [Google Scholar]
- Xing Y.; Xu M.; Gui X.; Cao Y.; Babel B.; Rudolph M.; Weber S.; Kappl M.; Butt H.-J. The application of atomic force microscopy in mineral flotation. Adv. Colloid Interface Sci. 2018, 256, 373–392. 10.1016/j.cis.2018.01.004. [DOI] [PubMed] [Google Scholar]
- Xia Y.; Xing Y.; Li M.; Liu M.; Tan J.; Cao Y.; Gui X. Studying interactions between undecane and graphite surfaces by chemical force microscopy and molecular dynamics simulations. Fuel 2020, 269, 117367. 10.1016/j.fuel.2020.117367. [DOI] [Google Scholar]
- Bu X.; Xie G.; Chen Y.; Ni C. The Order of Kinetic Models in Coal Fines Flotation. Int. J. Coal Prep. Util. 2016, 37, 113–123. 10.1080/19392699.2016.1140150. [DOI] [Google Scholar]
- Wills B. A.; Finch J.. Wills’ mineral processing technology: an introduction to the practical aspects of ore treatment and mineral recovery; Butterworth-Heinemann: 2015. [Google Scholar]
- Chu P.; Mirnezami M.; Finch J. A. Quantifying particle pick up at a pendant bubble: A study of non-hydrophobic particle–bubble interaction. Miner. Eng. 2014, 55, 162–164. 10.1016/j.mineng.2013.10.009. [DOI] [Google Scholar]