Abstract
Laser-induced breakdown spectroscopy (LIBS) to detect the light elements such as lithium (Li) and boron (B) and heavy elements such as copper (Cu) and lead (Pb) in raw fish samples is reported in this work. This is made possible by understanding that the soft target absorbs recoil energy and as a result, the ablated atoms gushing from the soft target do not acquire sufficient speed to form a shock wave. In order to overcome this problem, we set a subtarget on the back of the soft target so as to produce the repulsion force by which the gushing speed of the ablated atoms is increased, yielding a sufficiently high plasma temperature or sufficiently large thermal energy needed for the excitation of the ablated atoms. Excellent spectral qualities of various soft samples such as margarine, butter, peanut butter, strawberry jam, raw tuna, raw gindara, and raw salmon are presented. Furthermore, a linear calibration curve with a zero intercept is also obtained for Li, Cu, and Pb. The detection limit of Li, Cu, and Pb is found to be around 0.1 mg/L. This modification of LIBS for soft samples by using a subtarget effect clearly promises a rapid and in situ soft sample analysis since there is practically no sample digestion in the analysis.
Introduction
Indonesia, as the largest archipelago country with the second longest coastline in the world, has a lot of fish reserves.1 Even so, the average fish consumption in Indonesia is still relatively low at 46.49 kg/capita/year according to the 2018 data.1 It is widely known that fish is one source of protein, fats, vitamins, and minerals that are needed by the human body, especially in the growing period. Therefore, the Indonesian government continuously encourages its people to consume fish through a national campaign called “Eat Fish” as an effort to improve nutrition for its population.1 However, along with the increase in fish consumption and also with the advancing industry, the problem of heavy metal pollution such as Pb, Hg, and Cu as well as dangerous light metals such as Li and B in fish also needs to be examined. The standard method used to check the impurity content of fresh fish is usually to use the atomic absorption spectrometry (AAS) or the inductively coupled plasma (ICP) technique.2 However, the two techniques above require sample pretreatment, which is very complicated and time consuming. The sample must be ashed first and then dissolved in strong acid before use.
Since it was first discovered, the method of emission spectrochemical analysis using lasers by Breech and Cross3 has evolved rapidly. The researchers were interested in the simplicity of this method, which basically only uses lasers and detectors to determine the contents of elements in a sample. The rapid development in terms of laser technology and detectors such as intensified charge coupled devices (ICCD) further accelerates progress in this field. Researchers are also interested because this method can be used for microanalysis and nondestructive analysis in addition to its possibilities for real-time monitoring and on-line analytical results.4,5
Over time, the above method develops in two ways. The first, commonly referred to as laser-induced breakdown spectroscopy (LIBS), was first introduced by Radziemski et al. in 1981.6,7 In this method the target–laser interaction occurs at atmospheric air pressure. The second, called laser-induced shock wave plasma spectroscopy (LISPS), was first introduced by Kagawa et al. in 1982.8,9 In this method, the–laser target interaction occurs at low-pressure surrounding gas. Furthermore, because the LIBS method is more easily applied in field studies or in situ analysis, only the LIBS terminology is used next even though the interaction occurs at low pressure. Although LIBS has enjoyed its popularity as evidenced by its huge number of publications, it can still benefit from overcoming its disability to directly detect very soft samples. It is nevertheless well known that strong shock wave plasma propagating at roughly 10 km/s or faster is required to generate a sufficiently high plasma temperature or sufficiently large thermal energy needed for the excitation of the ablated atoms. This condition cannot be effectively met by ordinary LIBS both at high and low pressures for soft samples due to the lack of repulsion force from the soft sample surface. To overcome this, the researchers mainly used two methods. First is by freezing the sample to be analyzed. However, this method has a very significant disadvantage, which is during the target–laser interaction process, the sample will quickly melt, so the experiment itself must be done in a hurry and may become inaccurate.10−12 Second is with certain pretreatments to reduce the water content in the sample, such as a drying process followed by pelletization of the sample. The treatment of this sample is also very complicated, and the possibility of errors can occur at this stage of the process.13−15
In order to get strong shock wave plasma needed for the excitation of the ablated atoms as explained above, we recall our previous publication by understanding that the soft target absorbs recoil energy and as a result, the ablated atoms gushing from the soft target do not acquire sufficient speed to form a shock wave. If the process is true, then we can set the subtarget on the back of the target to produce the repulsion force by which the gushing speed of the ablated atoms is increased.16−20 To prove whether this technique can be applied to soft raw fish sample, the present study is undertaken.
Results and Discussion
As we all know, in LIBS, one of the main parameters that determines the quality of the spectrum is laser energy. So in the initial experiment, we will determine the best laser energy that gives high emission intensity and low background. Figure 2a shows the emission spectrum from a margarine sample using a Cu subtarget at 39, 54, 83, and 122 mJ laser energies. From Figure 2a, it is clear that the 122 mJ laser energy provides the best results. At energies above 122 mJ, we find Cu emissions from the subtarget, so the laser energy we will use for our next experiment is 122 mJ.
Figure 2.
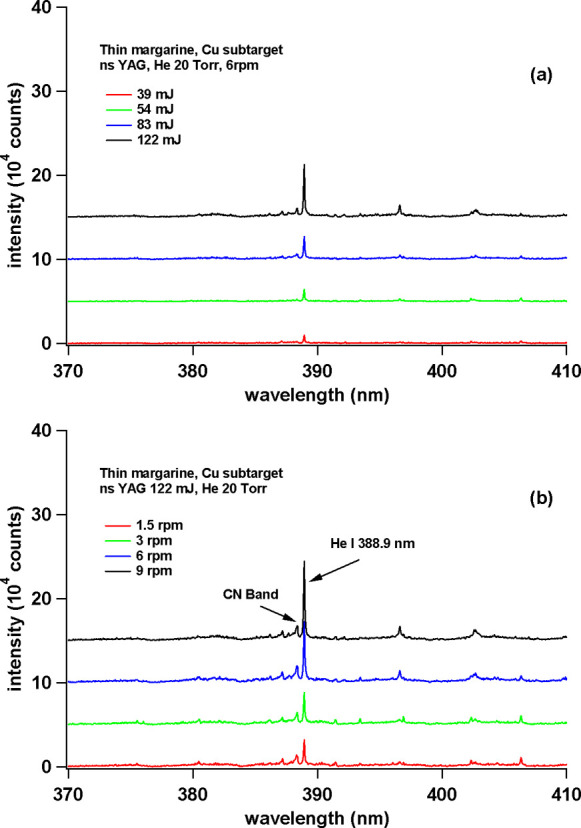
(a) Emission spectra of thin margarine obtained by varying the laser irradiation energy. The rotation speed of the sample holder is fixed at 6 rpm. (b) Emission spectra of thin margarine obtained by varying the rotation speed of the sample holder. The laser irradiation energy is fixed at 122 mJ.
The next parameter we need to know is the effect of the sample rotational speed on the quality of the spectrum and for that, we again use margarine samples with a Cu subtarget. The sample rotational speed is set at 1.5, 3, 6, and 9 rpm. From Figure 2b, one clearly sees that at a sample rotational speed of 9 rpm, the emission intensity is the highest. So in the next experiment, we rotate the sample at 9 rpm.
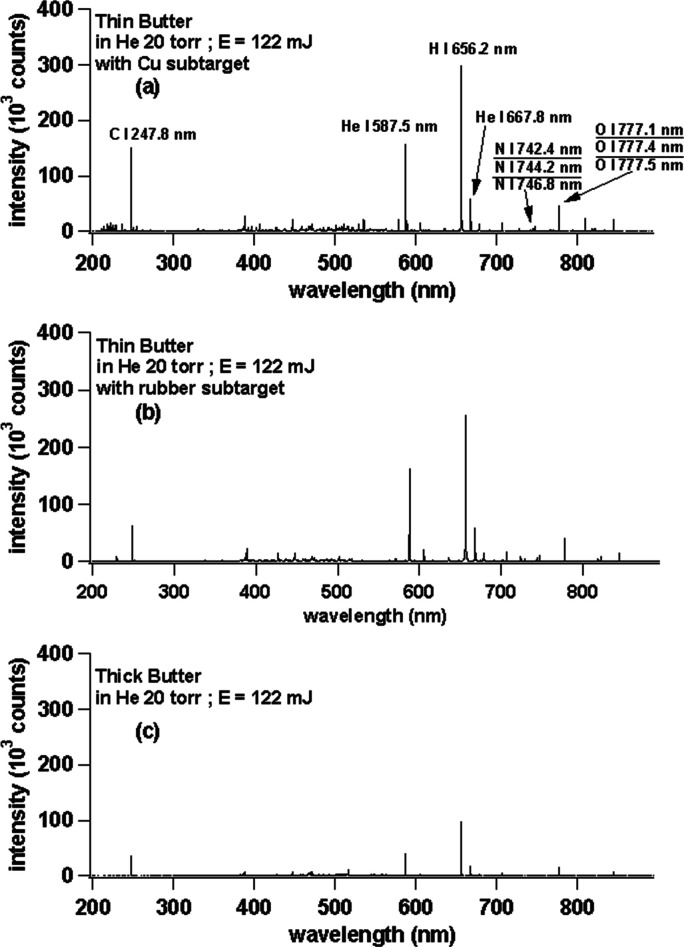
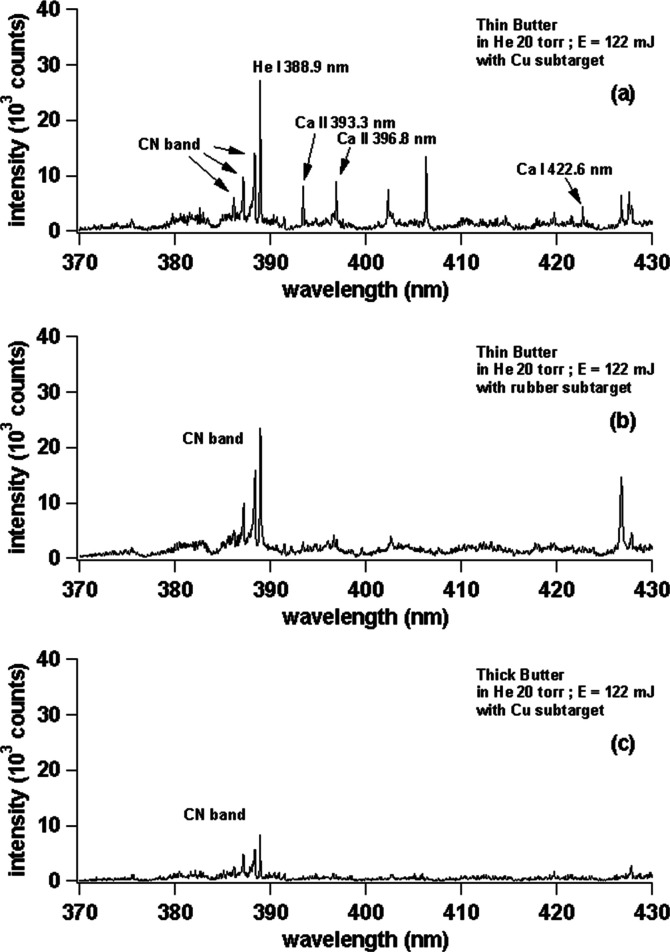
Under the condition of laser energy at 122 mJ and sample rotated at 9 rpm in surrounding He gas at 20 Torr, we proceed to the main body of the experiments. However, before using fresh fish meat samples, we first try with some other soft samples such as commercially available butter, margarine, peanut butter, and strawberry jam. Figure 3 shows the emission spectra of (a) thin butter with a Cu subtarget, (b) thin butter with a rubber subtarget, and (c) thick butter with laser irradiation energy of 122 mJ in He surrounding gas at 20 Torr. From the three images above, it is clearly seen that the best spectrum quality is in Figure 3a, while in Figure 3b, we find that the major constituent emission (C I 247.8 nm) is only half as compared to Figure 3a. Figure 3c has the worst result compared to Figure 3a,b as the C I 247.8 nm emission intensity is only one-fifth as compared to Figure 3a. When we enlarge the spectrum in Figure 3 in the wavelength region between 370 and 430 nm, we obtain a spectra as shown in Figure 4. From Figure 4, it is again clearly seen that there is an occurrence of a strong CN band at 388.3 nm and Ca emissions at 393.3, 396.8, and 422.6 nm. Note that Ca emission is not observable in the case of the rubber subtarget as shown in Figure 4. In the case without a subtarget (Figure 4), the CN band emission is extremely weak, and Ca emission is also not observable as in the case of Figure 4b. From these results, we conclude that the Cu subtarget gives the best results for soft samples as compared to the rubber subtarget. This is easily understood since the rubber subtarget gives weaker repulsion force to the ablated atoms as compared to the harder Cu subtarget. The use of He gas at low pressure (20 Torr) is based on our previous experience where low-pressure helium provides higher emission intensities and lower background signals, thus giving a higher signal-to-noise ratio (S/N).23−25
Figure 3.
Emission spectra of (a) thin butter with a Cu subtarget, (b) thin butter with a rubber subtarget, and (c) thick butter. The laser irradiation energy is fixed at 122 mJ. The gate delay and gate width of the ICCD are set at 200 ns and 30 μs, respectively.
Figure 4.
Enlarged view of the emission spectra of (a) thin butter with a Cu subtarget, (b) thin butter with a rubber subtarget, and (c) thick butter in the wavelength range of 370–430 nm. The laser irradiation energy is fixed at 122 mJ. The gate delay and gate width of the ICCD are set at 200 ns and 30 μs, respectively.
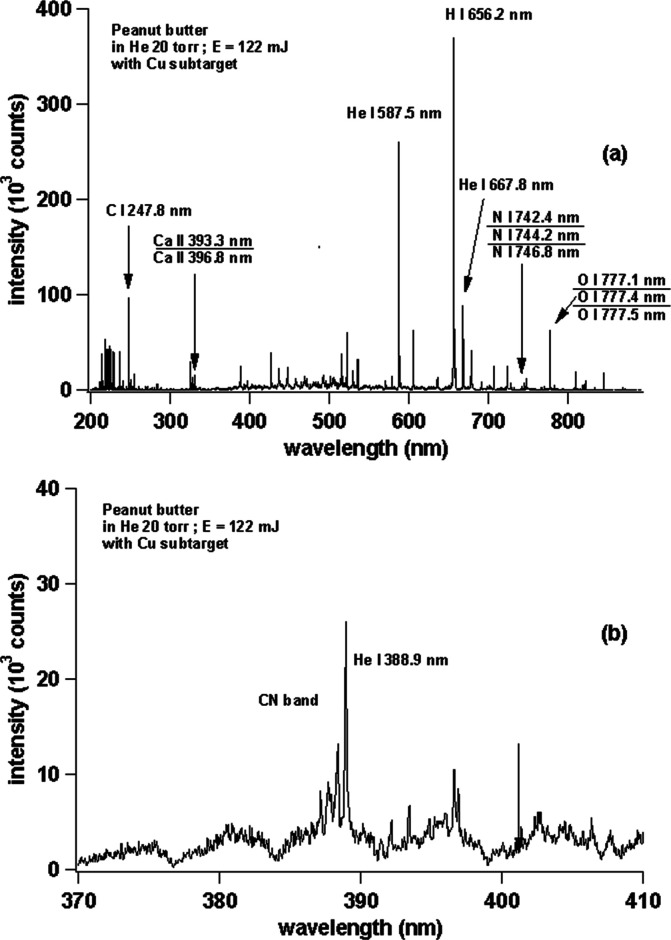
In order to strengthen the above result, we replace the sample with peanut butter, and we only use the Cu subtarget because the Cu subtarget gives the best results as described in Figures 3a and 4a. The conditions of the laser, surrounding gas, and ICCD are the same as in the experiments in Figure 3. Figure 5 shows the emission spectrum of peanut butter with a Cu subtarget (a) at a wavelength region of 200–850 nm and (b) zooming area at a wavelength of 370–410 nm. Look again at Figure 5a, very sharp emission lines from C, Ca, He, H, N, and O with very low background are observed. Figure 5b also shows strong CN emissions from peanut butter samples. The results of this experiment again confirm that the emission spectrum with a good S/N can be obtained by using a Cu subtarget even though the sample is very soft. This is one of the advantages of LIBS at low pressure, employing a subtarget effect.
Figure 5.
(a) Emission spectra of peanut butter with Cu subtarget. (b) Enlarged view of the emission spectra in the wavelength range of 370–410 nm.
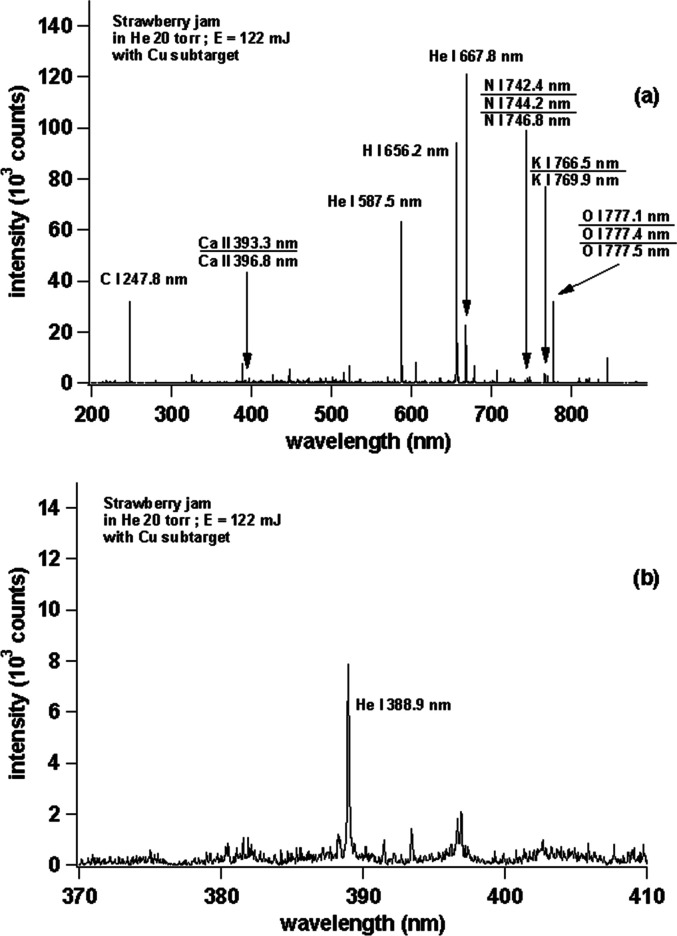
In the next experiment, we changed the sample to strawberry jam, and Figure 6a shows the strawberry jam spectrum in the wavelength region between 200 and 850 nm, and Figure 6b shows the zoomed area in the wavelength region between 370 and 410 nm. From Figure 6a, one clearly sees very sharp emission lines from C, Ca, He, H, N, K, and O with a high S/N ratio. However, in Figure 6b, CN emission appears to be very weak, and this is different from the result for the peanut butter sample as shown in Figure 5b.
Figure 6.
(a) Emission spectra of strawberry jam with a Cu subtarget. (b) Enlarged view of the emission spectra in the wavelength range of 370–410 nm.
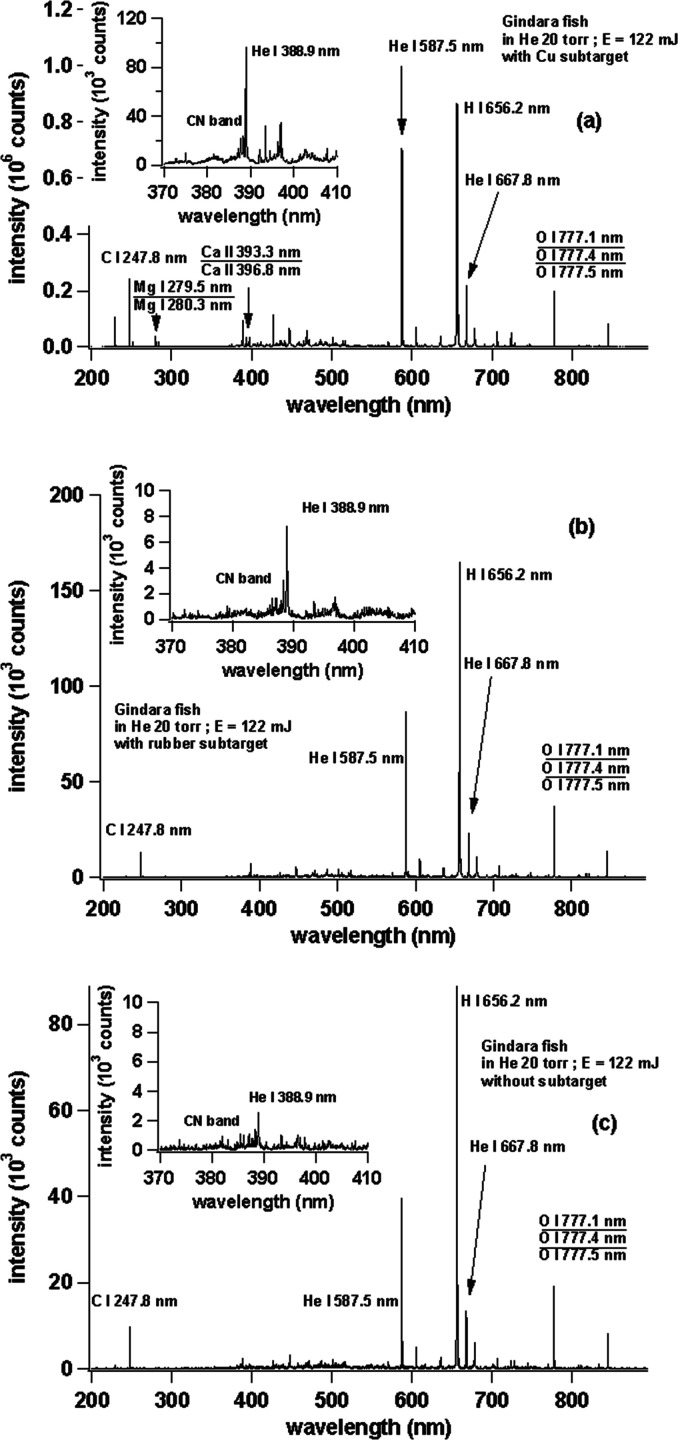
Turning to the main sample of this research, we use raw gindara fish and the resulted spectra are shown in Figure 7 ((a) with a Cu subtarget, (b) with a rubber subtarget, and (c) without a subtarget, namely, a thick cut sample, as explained in the procedure). One sees that the highest emission intensity is obtained in the case of the Cu subtarget; for example, the C I 247.8 nm emission intensity in the Cu subtarget is almost seven times higher than in the rubber subtarget and also in the case of the rubber subtarget, no emission lines are found for Ca II 393.3 nm, Ca II 396.8nm, and Ca I 422.6 nm, which in turn is clearly observable when in the case of a Cu subtarget. For the case without a subtarget, the resulted spectra are the worst as seen in Figure 7c. The overall emission intensity is roughly only half as compared with the rubber subtarget. However, it should also be noted that for all the spectrum in Figure 7, we find a strong and sharp H I 656.2 nm emission line along with a strong and sharp gas emission of He I 587.5 and He I 667.8 nm, owing to the different repulsion forces given by the subtarget for the ablated atoms. This phenomenon is also found for the above samples of margarine, peanut butter, butter, and strawberry jam. This is consistent with our previous publication in which the excitation of hydrogen atoms is mainly due to the collision between the H atoms and He metastable excited-state atoms through a Penning-like energy transfer process. In such a case, thermal excitation due to the shock wave formation only play a limited role in the excitation of the H atoms.26−36
Figure 7.
Emission spectra of (a) raw gindara with a Cu subtarget, (b) raw gindara with a rubber subtarget, and (c) raw gindara without a subtarget. The laser irradiation energy is fixed at 122 mJ. The gate delay and gate width of the ICCD are set at 200 ns and 30 μs, respectively.
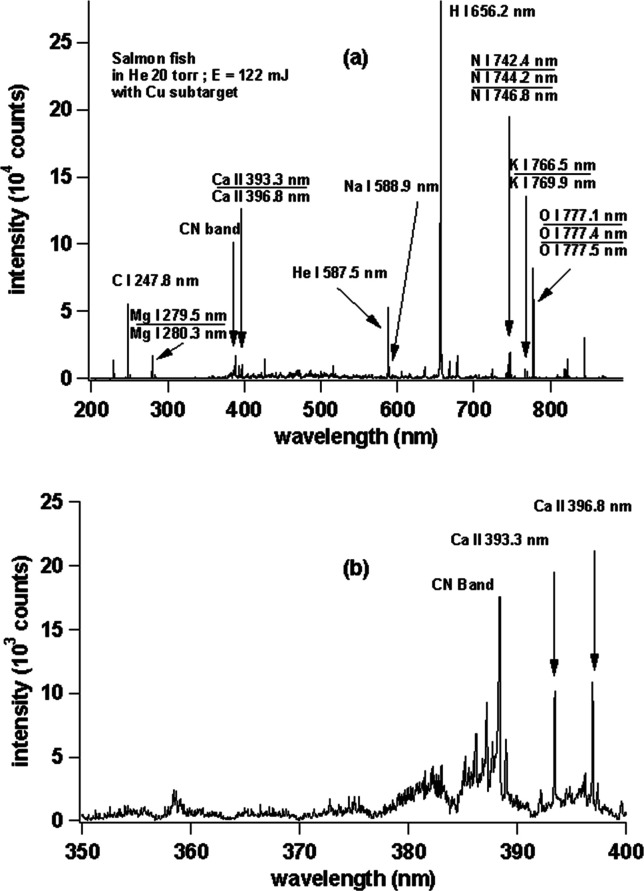
Having known the superiority of the Cu subtarget, we changed the gindara fish sample to a salmon sample, and the resulted spectrum is shown in Figure 8 for the (a) wavelength region between 200 and 900 nm and the (b) zoomed area of (a) from 350 to 400 nm. Again, we can clearly see sharp and strong emission lines of C I 247.8 nm; Mg I 279.5 nm and Mg I 280.3 nm; Ca II 393.3 nm and Ca II 396.8 nm; Na I 588.9 nm and Na I 589.5 nm; H I 656.2 nm; N I 742.4 nm; N I 744.2 nm and N I 746.8 nm; K I 766.5 nm and K I 769.9 nm; and O I 777.1 nm, O I 777.4 nm, and O I 777.5 nm. We also clearly see the occurrence of gas emission lines of He I 587.5 nm and He I 667.8 nm (not marked in the figure). Meanwhile, a strong CN band at 388.3 nm is also found as shown in Figure 8b.
Figure 8.
(a) Emission spectra of raw salmon with a Cu subtarget. (b) Enlarged view of the emission spectra in the wavelength range of 350–400 nm.
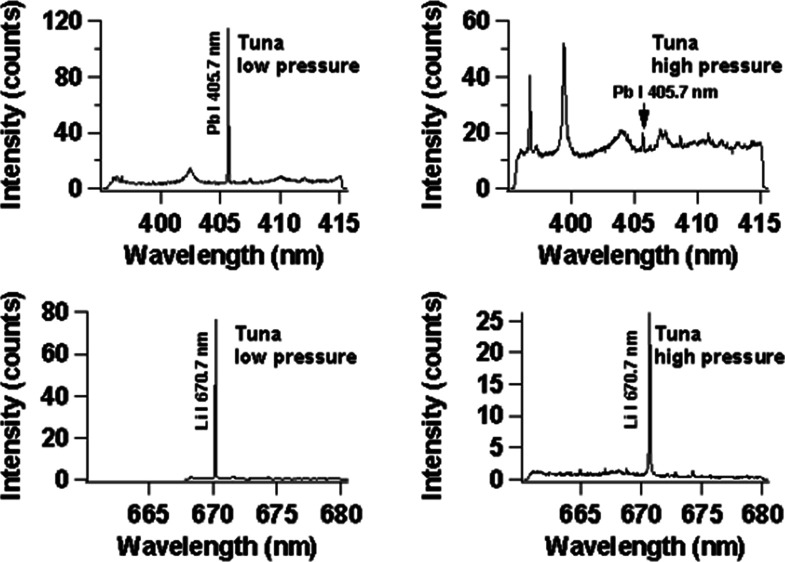
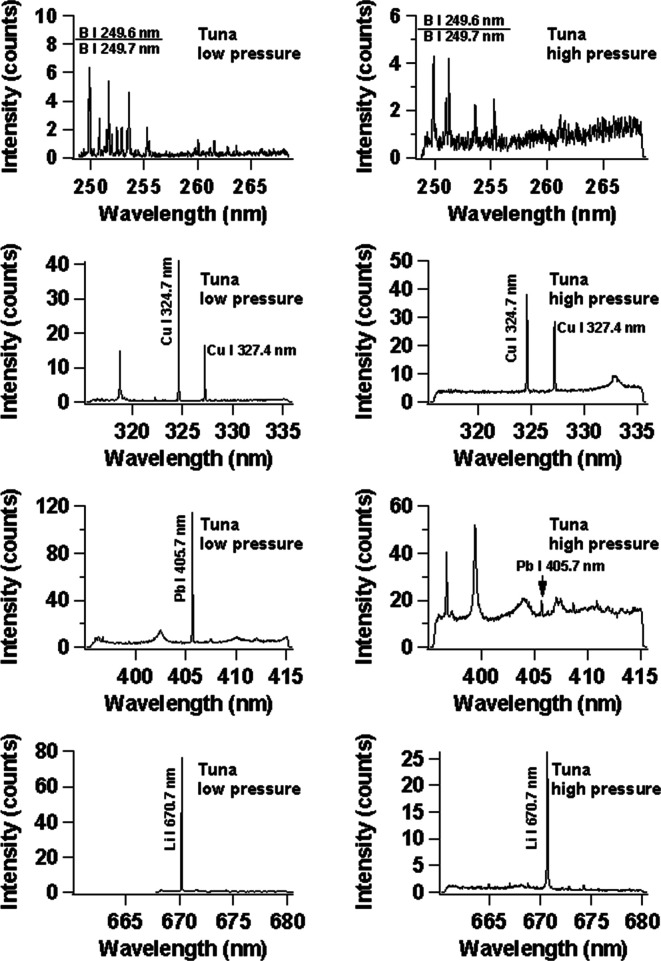
Finally, in order to compare our low-pressure He plasma with the ordinary LIBS technique in atmospheric air pressure, we use a tuna sample containing 30 mg/L of Cu, 26 mg/L of Li, 42 mg/L of Pb, and 28 mg/L of B with the Cu subtarget, and the result is shown in Figure 9. The left column is for the case of low-pressure He surrounding gas, and the right column is for the case of ordinary LIBS at atmospheric air pressure. In this case, we used a high-resolution spectrograph as explained in the procedure. It is clearly seen that the obtained results are much better in the case of low-pressure He surrounding gas as compared to atmospheric air pressure. One should also note that the S/N for the emission lines of Cu I 324.7 nm, Cu I 327.4 nm, Pb I 405.7 nm, and Li I 670.7 nm are much higher (20×) in the case of low-pressure He surrounding gas as compared to atmospheric air pressure.
Figure 9.
Emission spectra of B, Cu, Pb, and Li in raw salmon. The spectra on the left and right sides are obtained at low and high pressures, respectively. The subtarget is Cu, and the laser irradiation energy is fixed at 122 mJ. The gate delay and gate width of the ICCD are set at 200 ns and 30 μs, respectively.
Finally, using the data of Figure 9 and other two kinds of tuna samples containing 70 mg/L Cu, 63 mg/L Li, 78 mg/L Pb, and 72 mg/L B and 98 mg/L Cu, 95 mg/L Li, 110 mg/L Pb, 80 mg/L B, a calibration curve is made, and the results are presented in Figure 10, (a) for Li, (b) for Cu and (c) for Pb. Again, a linear calibration curve with zero intercept and slope of unity is obtained for all the above elements. We do not make the calibration curve of B since the emission lines of B I 249.6 nm and B I 249.7 nm are hardly separated by our spectrograph. Combining the data from Figure 9 and Figure 10 and by employing the conventional criterion of the detection limit as a ratio of the signal intensity against three times the average surrounding background intensity, we find that the detection limit of Li, Cu, and Pb is all around 0.1 mg/L, which is lower than the maximum allowable concentration of those elements in fish.
Figure 10.
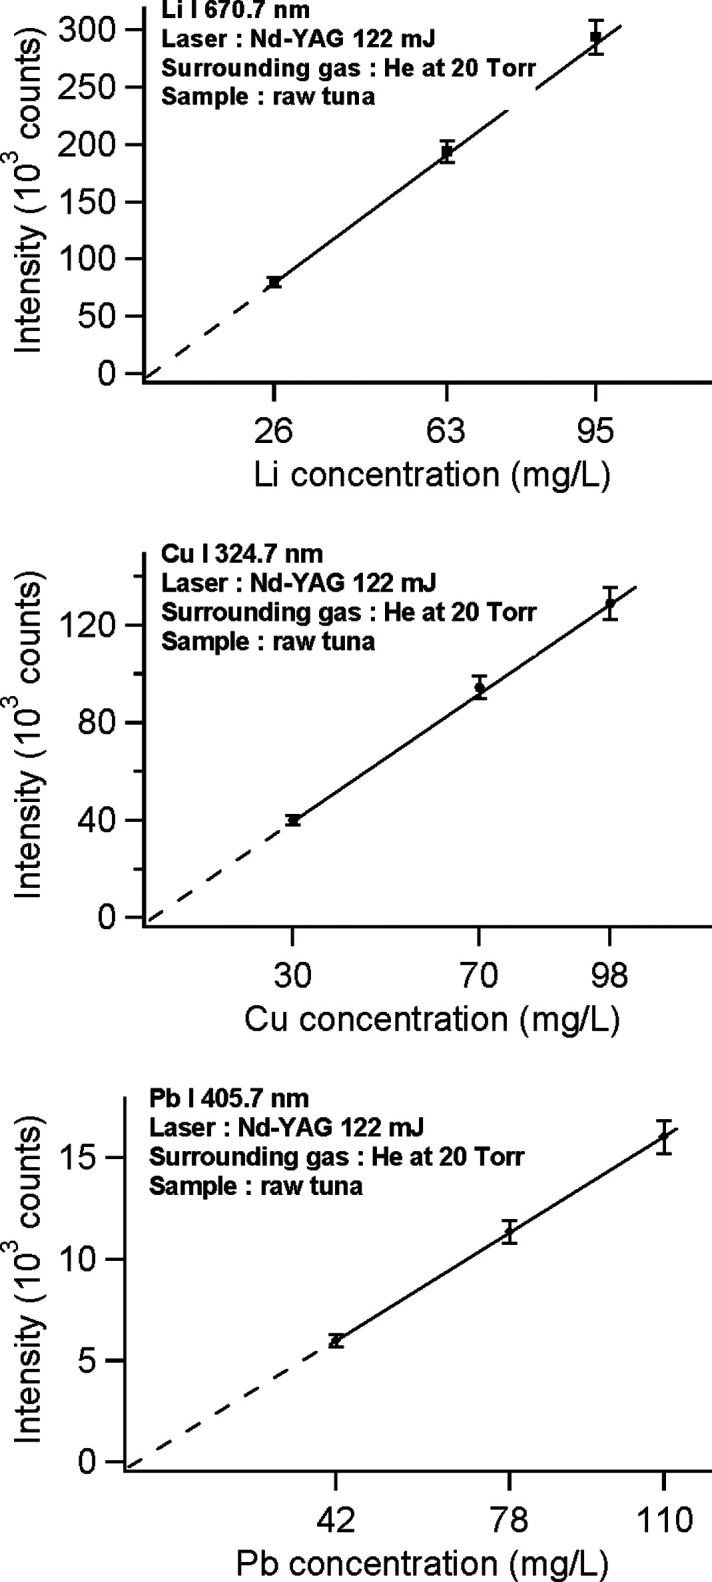
(a) Emission intensity of Li I 670.7 nm versus its concentration in raw tuna taken from samples containing different concentrations of Li (26, 63, and 95 mg/L). (b) Emission intensity of Cu I 324.7 nm versus its concentration in raw tuna taken from samples containing different concentrations of Cu (30, 70, and 98 mg/L) . (c) Emission intensity of Pb I 405.7 nm versus its concentration in raw tuna taken from samples containing different concentrations of Pb (42, 78, and 110 mg/L).
Conclusions
In summary, a method for detecting light and heavy elements in raw fish using LIBS with a subtarget at low-pressure He gas has been developed. We have demonstrated that the presence of a metal subtarget on the back of the soft material greatly helps in improving the spectral quality of the sample. By using this technique, a detection limit of 0.1 mg/L for Li, Cu, and Pb, which is below the maximum tolerable levels of the international standard, can be achieved. This result showed that our proposed method could be applied for accurate quantitative measurement of light and heavy elements in the soft materials.
Experimental Procedure
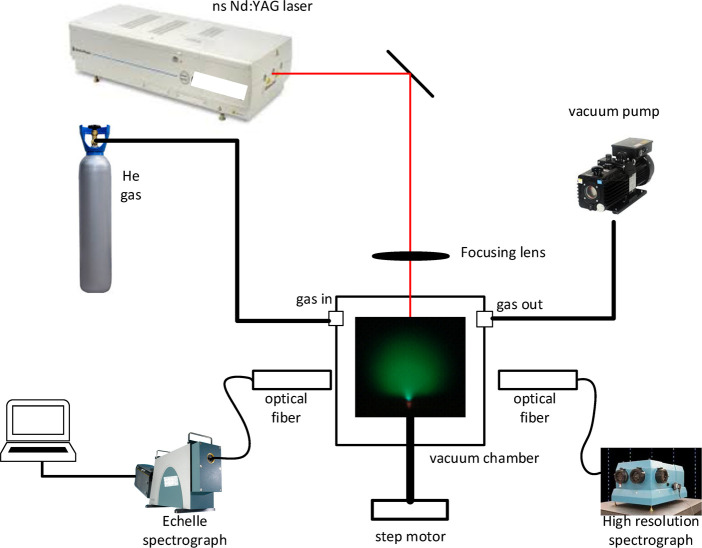
The experimental setup used in this study is provided in Figure 1. The chamber used in this work is a rectangular chamber of 11 × 11 × 11 cm3 dimension. It is equipped with a number of large quartz plates to allow the detection of the plasma and for passing the laser irradiation. The chamber is connected with one servo motor to rotate the sample holders as shown in the figure. The chamber can be evacuated down to 0.1 Torr by a rotary vacuum pump (Ulvac, GLD-136C) and measured precisely using an analog Pirani gauge (Diavac limited model PT-9P).
Figure 1.
Schematic diagram of the experimental setup used in this work.
The laser used in this experiment is a nanosecond Nd-YAG laser (Quanta Ray model LAB-130, 8 ns, maximum energy of 450 mJ) operated at its fundamental wavelength of 1064 nm with a 10 Hz repetition rate and a fixed energy output of 122 mJ. This laser system is focused using a quartz lens with 150 mm focal length onto the sample to be analyzed.
The spectral measurement of the plasma emission is carried out by employing an Echelle spectrograph (Andor Mechelle M5000, with wavelength accuracy better than ±0.05 nm). For the measurement in search of a calibration curve and for the estimation of the detection limit, a gated ICCD system (OMA system, Andor I*Star intensified CCD 1024 × 256 pixels) of 12 pm spectral resolution at 500 nm is attached to the output port of a spectrograph (McPherson model 2061 with 1000 mm focal length f/8.6 Czerny Turner configuration), which has its input port connected to an optical fiber output end. The opposite end of the fiber is inserted into the chamber for collection of the plasma emission. The gate delay and gate width of the ICCD are fixed at 200 ns and 30 μs, respectively, in order to yield the most favorable emission spectra as shown in our previous works.21,22
For samples of butter, margarine, strawberry jam, and peanut butter, which we obtained from grocery stores, we use without pretreatment. Meanwhile, two kinds of subtarget materials are used, namely, a rubber sheet with a thickness of 2 mm and a copper plate with a thickness of 0.4 mm. In this case, samples are spread evenly on the rubber sheet or copper plate with a thickness of less than 1 mm. To stimulate the situation without a subtarget, we put the above sample in a Petri dish with a diameter of 30 mm until its height reaches around 8 mm (we call this kind of sample a thick sample). In this condition, the focus of the laser beam is dropped on the upper surface of the sample so that no subtarget effect occurs. In fact, we found no damage whatsoever at the bottom of the Petri dish after careful observation under the microscope. All of the above samples are rotated at 9 rpm during all of the experiments.
The raw fish (gindara, tuna, and salmon) slices at 30 mm × 30 mm with a thickness of 5 mm are first dried by pressing it on a tissue paper several times until the water content is around 20% based on measurement using a commercial water content meter. Then, the sample is dried using a refrigerator set at a temperature of 2 °C and a humidity of around 20% for 3 h. After all the above treatment, the thickness of the samples is around 2 mm with a water concentration of 7%. This sample is then used for basic LIBS analysis on a raw fish sample. Next, for the experiment concerning quantitative analysis, the raw fish sample (in this case, only tuna) is immersed in a HNO3 solution containing 250 mg/L each of B, Li, Cu, and Pb for 2 h. Then, the sample is dried using a refrigerator set at a temperature of 2 °C and a humidity of around 20% for 3 h. The thickness of the samples becomes around 2 mm. Under this condition, the sample is first analyzed by an ICP technique, and the contents of B, Li, Cu, and Pb in the sample are 29, 26, 30, and 42 mg/L, respectively. This sample is then used for quantitative analysis with LIBS. We also prepare different sets of tuna samples, which are immersed in a HNO3 solution containing, each with 500 mg/L and 1000 mg/L of B, Li, Cu, and Pb for 2 h for the purpose of obtaining the calibration curve. The actual concentration of each element in the sample can be seen in the horizontal axis of Figure 10. Due to the limitation in our laboratory, we only prepared three different concentrations for calibration curves. It should also be noted that the treatment of this sample is a bit rough because our main goal is to only include impurities in fresh fish meat. To stimulate the condition without the subtarget for the raw fish sample, a thick raw fish of 12 mm thickness is used on purpose and after the above treatment, the thickness of the raw fish is found to be around 5 mm.
Acknowledgments
This work was partially supported through a basic research grant in physics, the Academy of Sciences for the Developing World, Third World Academy of Sciences (TWAS), under contract no. 060150 RG/PHYS/AS/UNESCO FR:3240144882. This project is also partially funded by the Indonesia Ministry of Research, Technology, and Higher Education through a research grant under contract number 42SP2H/DRPM/LMG/L/2020.
The authors declare no competing financial interest.
References
- Available at: www.packard.org/
- Heggum C.CODEX ALIMENTARIUS. In Encylopedia of Dairy Sciences; Hubert R. Ed.; Elsevier: 2002, pp. 463–473. [Google Scholar]
- Breech F.; Cross L. Optical Microemission Stimulated by a Ruby Maser. Appl. Spectrosc. 1962, 16, 1. [Google Scholar]
- Miziolek A.; Palleschi V.; Schechter I.. Laser-Induced Breakdown Spectroscopy (LIBS): Fundamentals and Applications; Cambridge University Press: 2006, 10.1017/CBO9780511541261. [DOI] [Google Scholar]
- Cremers D. A.; Radziemski L. J.. Handbook of Laser-Induced Breakdown Spectroscopy; John Wiley & Sons, Ltd: 2013. [Google Scholar]
- Loree T. R.; Radziemski L. J. Laser-Induced Breakdown Spectroscopy: Time-Integrated Applications. Plasma Chem. Plasma Process. 1981, 1, 271–279. 10.1007/BF00568835. [DOI] [Google Scholar]
- Radziemski L. J.; Loree T. R. Laser-Induced Breakdown Spectroscopy: Time-Resolved Spectrochemical Applications. Plasma Chem. Plasma Process. 1981, 1, 281–293. 10.1007/BF00568836. [DOI] [Google Scholar]
- Kagawa K.; Yokoi S. Application of the N2 Laser to Laser Microprobe Spectrochemical Analysis. Spectrochim. Acta, Part B 1982, 37, 789–795. 10.1016/0584-8547(82)80093-1. [DOI] [Google Scholar]
- Kagawa K.; Ohtani M.; Yokoi S.; Nakajima S. Characteristics of the Plasma Induced by the Bombardment of N2 Laser Pulse at Low Pressures. Spectrochim. Acta, Part B 1984, 39, 525–536. 10.1016/0584-8547(84)80060-9. [DOI] [Google Scholar]
- Ponce L. V.; Flores T.; Sosa-Saldaña M.; Alvira F. C.; Bilmes G. M. Laser-Induced breakdown spectroscopy determination of toxic metals in fresh fish. Appl. Opt. 2016, 55, 254–258. 10.1364/AO.55.000254. [DOI] [PubMed] [Google Scholar]
- Alvira F. C.; Flores Reyes T.; Ponce Cabrera L.; Osorio L. M.; Perez Baez Z.; Bautista G. V. Qualitative evaluation of Pb and Cu in fish using laser-induced breakdown spectroscopy with multipulse excitation by ultracompact laser source. Appl. Opt. 2015, 54, 4453–4457. 10.1364/AO.54.004453. [DOI] [PubMed] [Google Scholar]
- Temiz H. T.; Sezer B.; Berkkan A.; Tamer U.; Boyaci I. H. Assessment of laser induced breakdown spectroscopy as a tool for analysis of butter adulteration. J. Food Compos. Anal. 2018, 67, 48–54. 10.1016/j.jfca.2017.12.032. [DOI] [Google Scholar]
- Rezk R. A.; Galmed A. H.; Abdelkreem M.; Abdel Ghany N. A.; Harith M. A. Quantitative analysis of Cu and Co adsorbed on fish bones via laser-induced breakdown spectroscopy. Opt. Laser Technol. 2016, 83, 131–139. 10.1016/j.optlastec.2016.02.025. [DOI] [Google Scholar]
- Huang L.; Chen T.; He X.; Yang H.; Wang C.; Liu M.; Yao M. Determination of heavy metal chromium in pork by laser-induced breakdown spectroscopy. Appl. Opt. 2017, 56, 24–28. 10.1364/AO.56.000024. [DOI] [Google Scholar]
- Viana L. F.; Súarez Y. R.; Cardoso C. A. L.; Lima S. M.; da Cunha Andrade L. H.; Lima-Junior S. E. Use of fish scales in environmental monitoring by the application of Laser-Induced Breakdown Spectroscopy (LIBS). Chemosphere 2019, 228, 258–263. 10.1016/j.chemosphere.2019.04.070. [DOI] [PubMed] [Google Scholar]
- Suliyanti M. M.; Hedwig R.; Kurniawan H.; Kagawa K. The role of sub-target in the transversely excited atmospheric Pressure CO2 laser-induced shock-wave plasma. Jpn. J. Appl. Phys. 1998, 37, 6628–6632. 10.1143/JJAP.37.6628. [DOI] [Google Scholar]
- Kagawa K.; Lie T. J.; Hedwig R.; Abdulmadjid S. N.; Suliyanti M. M.; Kurniawan H. Subtarget effect on laser plasma generated by transversely excited atmospheric CO2 laser at atmospheric gas pressure. Jpn. J. Appl. Phys. 2000, 39, 2643. 10.1143/JJAP.39.2643. [DOI] [Google Scholar]
- Kurniawan H.; Nakajima S.; Batubara J. E.; Marpaung M.; Okamoto M.; Kagawa K. Laser-induced shock wave plasma in glass and its application to elemental analysis. Appl. Spectrosc. 1995, 49, 1067–1072. 10.1366/0003702953964949. [DOI] [Google Scholar]
- Hedwig R.; Lie T. J.; Tjia M. O.; Kagawa K.; Kurniawan H. Confinement effect in enhancing shock wave plasma generation at low pressure by TEA CO2 laser bombardment on quartz sample. Spectrochim. Acta, Part B 2003, 58, 531–542. 10.1016/S0584-8547(03)00009-0. [DOI] [Google Scholar]
- Hedwig R.; Kurniawan H.; Kagawa K. Confinement effect of primary plasma on glass sample induced by irradiation of Nd-YAG laser at low pressure. Jpn. J. Appl. Phys. 2001, 40, 5938–5941. 10.1143/JJAP.40.5938. [DOI] [Google Scholar]
- Kurniawan K. H.; Tjia M. O.; Kagawa K. Review of laser-induced plasma, its mechanism, and application to quantitative analysis of hydrogen and deuterium. Appl. Spectrosc. Rev. 2013, 49, 323–434. 10.1080/05704928.2013.825267. [DOI] [Google Scholar]
- Kurniawan K. H.; Kagawa K. Hydrogen and deuterium analysis using laser-induced plasma spectroscopy. Appl. Spectrosc. Rev. 2006, 41, 99–130. 10.1080/05704920500510687. [DOI] [Google Scholar]
- Hedwig R.; Lahna K.; Lie Z. S.; Pardede M.; Kurniawan K. H.; Tjia M. O.; Kagawa K. Application of picosecond laser-induced breakdown spectroscopy to quantitative analysis of boron in meatballs and other biological samples. Appl. Opt. 2016, 55, 8986–8992. 10.1364/AO.55.008986. [DOI] [PubMed] [Google Scholar]
- Lahna K.; Idroes R.; Idris N.; Abdulmadjid S. N.; Kurniawan K. H.; Tjia M. O.; Pardede M.; Kagawa K. Formation and emission characteristics of CN molecules in laser induced low pressure He plasma and its applications to N analysis in coal and fossilization study. Appl. Opt. 2016, 55, 1731–1737. 10.1364/AO.55.001731. [DOI] [PubMed] [Google Scholar]
- Idris N.; Pardede M.; Jobiliong E.; Lie Z. S.; Hedwig R.; Suliyanti M. M.; Kurniawan D. P.; Kurniawan K. H.; Kagawa K.; Tjia M. O. Enhancement of carbon detection sensitivity in laser induced breakdown spectroscopy with low pressure ambient helium gas. Spectrochim. Acta, Part B 2019, 151, 26–32. 10.1016/j.sab.2018.11.001. [DOI] [Google Scholar]
- Idris N.; Terai S.; Lie T. J.; Kurniawan H.; Kobayashi T.; Maruyama T.; Kagawa K. Atomic hydrogen emission induced by TEA CO2 laser bombardment on solid samples at low pressure and its analytical application. Appl. Spectrosc. 2005, 59, 115–120. 10.1366/0003702052940530. [DOI] [PubMed] [Google Scholar]
- Kurniawan K. H.; Lie T. J.; Idris N.; Kobayashi T.; Maruyama T.; Suyanto H.; Kagawa K.; OnTjia M. Hydrogen emission by Nd-YAG laser-induced shock wave plasma and its application to the quantitative analysis of zircalloy. J. Appl. Phys. 2004, 96, 1301–1309. 10.1063/1.1763990. [DOI] [Google Scholar]
- Suyanto H.; Lie Z. S.; Niki H.; Kagawa K.; Fukumoto K.; Rinda H.; Abdulmadjid S. N.; Marpaung A. M.; Pardede M.; Suliyanti M. M.; Hidayah A. N.; Jobiliong E.; Lie T. J.; Tjia M. O.; Kurniawan K. H. Quantitative analysis of deuterium in zircaloy using double-pulse laser-induced breakdown spectrometry (LIBS) and helium gas plasma without a sample chamber. Anal. Chem. 2012, 84, 2224–2231. 10.1021/ac202744r. [DOI] [PubMed] [Google Scholar]
- Marpaung A. M.; Kurniawan H.; Tjia M. O.; Kagawa K. Comprehensive study on the pressure dependence of shock wave plasma generation under TEA CO2 laser bombardment on metal sample. J. Phys. D: Appl. Phys. 2001, 34, 758–771. 10.1088/0022-3727/34/5/315. [DOI] [Google Scholar]
- Kurniawan K. H.; Lie T. J.; Idris N.; Kobayashi T.; Maruyama T.; Kagawa K.; Tjia M. O.; Chumakov A. N. Hydrogen analysis of zircaloy tube used in nuclear power station using laser plasma technique. J. Appl. Phys. 2004, 96, 6859–6862. 10.1063/1.1808480. [DOI] [Google Scholar]
- Kurniawan H.; Kobayashi T.; Nakajima S.; Kagawa K. Correlation between front speed and initial explosion energy of the blast wave induced by a TEA CO2 laser. Jpn. J. Appl. Phys. 1992, 31, 1213–1214. 10.1143/JJAP.31.1213. [DOI] [Google Scholar]
- Hattori H.; Kakui H.; Kurniawan H.; Kagawa K. Liquid refractometry by the rainbow method. Appl. Opt. 1998, 37, 4123–4129. 10.1364/AO.37.004123. [DOI] [PubMed] [Google Scholar]
- Ramli M.; Kagawa K.; Abdulmadjid S. N.; Idris N.; Budi W. S.; Marpaung M. A.; Kurniawan K. H.; Lie T. J.; Suliyanti M. M.; Hedwig R.; Pardede M.; Lie Z. S.; Tjia M. O. Some notes on the role of meta-stable excited state of helium atom in laser-induced helium gas breakdown spectroscopy. Appl. Phys. B: Lasers Opt. 2007, 86, 729–734. 10.1007/s00340-006-2566-6. [DOI] [Google Scholar]
- Kurniawan K. H.; Lie T. J.; Suliyanti M. M.; Hedwig R.; Abdulmadjid S. N.; Pardede M.; Idris N.; Kobayashi T.; Kusumoto Y.; Kagawa K.; Tjia M. O. Detection of deuterium and hydrogen using laser-induced helium gas plasma at atmospheric pressure. J. Appl. Phys. 2005, 98, 093302 10.1063/1.2126789. [DOI] [Google Scholar]; -1-3
- Pardede M.; Kurniawan K. H.; Lie T. J.; Hedwig R.; Idris N.; Kobayashi T.; Maruyama T.; Lee Y. I.; Kagawa K.; Tjia M. O. Hydrogen analysis in solid samples using laser-induced helium plasma at atmospheric pressure. J. Appl. Phys. 2005, 98, 043105 10.1063/1.2009820. [DOI] [Google Scholar]; -1-5
- Kurniawan K. H.; Lie T. J.; Suliyanti M. M.; Hedwig R.; Pardede M.; Ramli M.; Niki H.; Abdulmadjid S. N.; Idris N.; Lahna K.; Kusumoto Y.; Kagawa K.; Tjia M. O. The role of He in enhancing the intensity and lifetime of H and D emissions from laser-induced atmospheric-pressure plasma. J. Appl. Phys. 2009, 105, 103303. 10.1063/1.3129317. [DOI] [Google Scholar]; -1-6


